 🏗️ New Construction
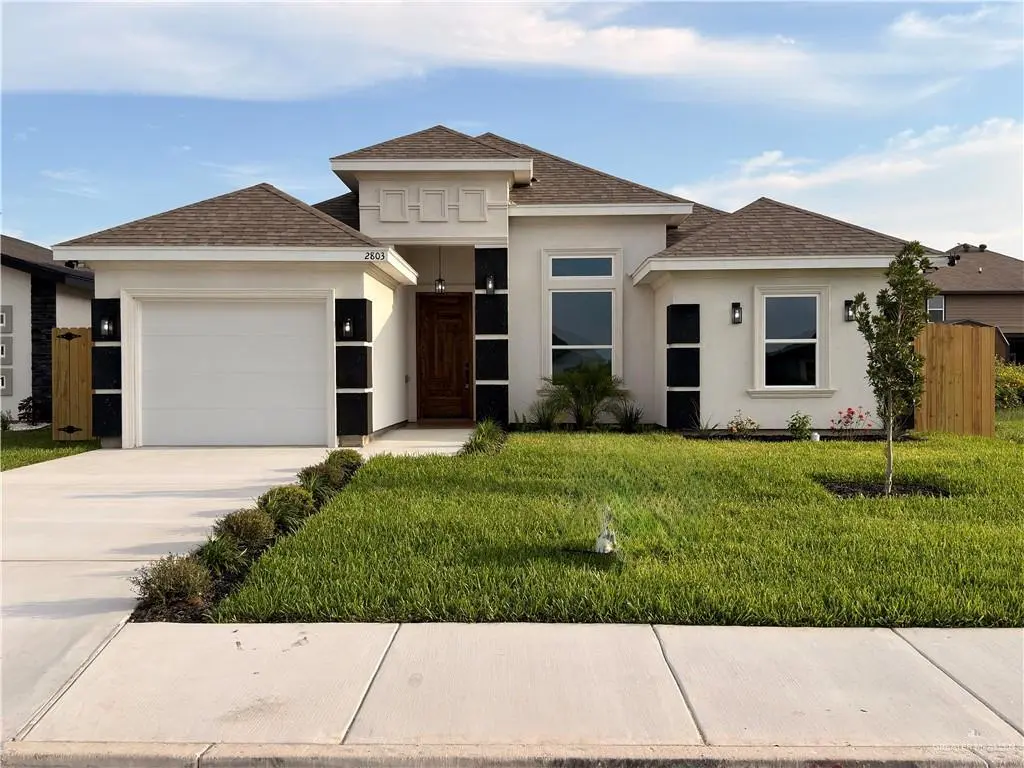
2308 E Sabinal Ave · Hidalgo, TX
Flood risk No data
- FEMA flood zone
- —
- Chance of flooding over 30 yrs
- —
- Est. flood insurance / yr
- —
Fire risk No data
- Est. fire insurance / yr
- —
Heat risk No data
- Hot days now (above threshold)
- —
- Hot days in 30 yrs
- —
Wind risk No data
- Chance of severe wind over 30 yrs
- —
Air-quality risk No data
- Unhealthy air days now
- —
- Unhealthy air days in 30 yrs
- —
Risk factors via First Street. Map © Google.
Why this score? — see what drove the D- grade
The composite is a weighted blend of 9 inputs, each scored 0–100. Each bar is that input's sub-score; the figure is the points it added to the 100-point composite (weight × sub-score).
- Appreciation +10.0/10.0
- Cash flow +7.6/30.0
- ARV discount +7.5/15.0
- Livability +3.4/5.0
- Rent growth +2.5/5.0
- Schools +2.5/10.0
- Condition / age +2.5/5.0
- 1% rule +2.2/10.0
- DSCR +1.7/10.0
$272,900
🖨 Deal sheet (PDF) 📄 Offer letter ✓ Due diligence
Listing remarks
Modern luxury meets prime location in this beautiful new Hidalgo, Tx Las Arboledas Ph 6 Subdivision! This exceptional home boasts 3 bedrooms, 2.5 bathrooms, a 1-car garage, and a brilliant open-concept floor plan. The interior is highlighted by striking vaulted ceilings and stylish wood-look tile throughout. The true showstopper is the expansive master suite, featuring a remarkably large master bathroom designed to impress. Both guest bedrooms offer generous square footage and excellent closet space. Step outside to a peaceful backyard setting, complete with a convenient patio half-bath. Situated in a quiet, family-friendly neighborhood just minutes from prime shopping, dining, and internat
Key facts
- Master suite
- Backyard setting
- Vaulted ceilings
Tags
Property features AI
Finance
- Other: Lot dimensions approximately 50 x 120 (about 0.1377 acres); Lot improvements include wood fencing
- HOA & community: No association; Community has curbs
Exterior
- Parking: Attached garage (garage faces front); 1 covered parking space (1 total garage space)
- Security: Smoke detector(s)
- Utilities: City sewer; Paved road access; Electric water heater
- Home design: New construction; Living area based on blueprints
- Construction: Stucco exterior; Composition shingle roof; Slab foundation; Built as new construction
- Exterior features: Sprinkler system; Professional landscaping; Curb and gutters; Sidewalks; Covered patio
Interior
- Kitchen: No conveying appliances
- Bedrooms: Master bedroom with sitting area and walk-in closet(s)
- Flooring: Tile flooring
- Bathrooms: 2 full bathrooms; 1 half bathroom
- Heating & cooling: Central heating (electric); Central air conditioning (electric)
- Interior features: Entrance foyer; Quartz countertops; Ceiling fan(s); Decorative / high ceilings; Walk-in closet(s); Double-pane energy-efficient windows; No window coverings; Smoke detector(s)
- Laundry & utility: Laundry room with washer/dryer connections; Electric water heater located in garage
Neighborhood map
What this means for you Summary
Snapshot
- This is a 3-bed/2.5-bath single-family listed at $273k.
Deal economics
- At list price, monthly cash flow is $-327 ($-4k/yr) — negative.
- To cash-flow at today's rent, offer at most $221k (19.0% below list).
- To meet the 1% rule (rent ≥ 1% of price), the offer needs to be $193k (29.1% below list).
- Recommended offer: $193k (29.1% below list) — sets the bar for 1% rule.
Location & tenants
- Location reads 68/100 on livability (#488 in TX) — a middle-class / working-renter tenant base. Strengths: cost of living A+, housing A+, crime A-; Watch: amenities F, commute F, employment F.
- Valley View ISD (suburban): math 24% / reading 38% proficiency, ranked #631 of 826 in TX (top 76%) — families likely to look elsewhere, expect single-tenant / working-renter base with shorter leases; 85% free/reduced lunch — lower-income household profile, screen leases tightly.
- Zoned schools: Wilbur E Lucas El (math 32% / reading 37%, grade F, #1,995 of 4,322 statewide, top 50%, 468 students, 94% FRL); Valley View J H (math 23% / reading 35%, grade F, #1,103 of 1,662 statewide, top 67%, 483 students, 95% FRL); Valley View H S (math 12% / reading 47%, grade F, #1,112 of 1,632 statewide, top 70%, 1,170 students, 96% FRL).
- Market conditions: 98 active listings in the ZIP; 2 comparable units currently listed for rent nearby; 7,378 units permitted in Hidalgo County in 2024 (641 in 5+ unit buildings).
Forward outlook
- In year one you build about $29k of equity ($2k loan paydown + $27k appreciation (10.0% local appreciation)).
- Hidalgo County population projected at +28% by 2050 — long-run rental-demand tailwind backs the buy-and-hold thesis.
- By year 2, paydown + projected appreciation supports a ~$46k cash-out refi (75% LTV) — recoverable capital for the next deal without selling this one.
Negotiation context
- It's been on market 23 days — a 2% lower offer ($269k) is reasonable based on typical stale-listing flexibility.
Questions for the listing agent
- What do current leases actually rent for vs. the listed asking? Can we see a recent rent roll and the last 12 months of T-12 income?
- Is there a deadline driving the sale (1031 exchange, divorce, estate, relocation)? That informs how much negotiation room exists.
- Schools are D-rated, which usually means shorter tenancies and higher turnover. Who's the typical renter profile here, and what's been the actual vacancy rate?
- The area grade is low — what's the realistic commute time and amenity access for the typical tenant pool here? Any planned neighborhood developments (good or bad) we should know about?
- What's the average days-on-market for RENTAL listings here right now (not sales)? A rising rental-DOM trend means longer vacancies and softer asking-rent achievability than the comps imply.
- What's the recent tenant-quality profile in this submarket — average credit score on applications, eviction rate, late-payment / NSF rate, and stable-employment percentage? A property-management company in the area should have these aggregated.
- How much new for-sale + rental construction is in the pipeline within 1–3 miles? Heavy new supply typically softens prices + rents 12–24 months out; constrained supply supports both.
Investment metrics
- 1% rule
- 0.72% ✗
- Cap rate
- 4.83%
- Cash-on-cash
- -5.22%
- DSCR
- 0.77
- GRM
- 11.6
CMA / ARV
- ARV (on-the-fly)
- $268,470
- Comps found
- 12
Show comp detail 12 sales within ~0.75 mi
| Address | Dist | Beds/Ba | Sqft | Sold | Price | $/sf | Match |
|---|---|---|---|---|---|---|---|
| 1607 Las Palmas Ave | 0.08mi | 3/2.0 | 1,585 (+1%) | 2mo | $224,000 | $141 | 91 |
| 3107 Sabinal St | 0.13mi | 3/2.0 | 1,544 (-2%) | 3mo | $259,900 | $168 | 86 |
| 2310 E Sabinal Ave | 0.01mi | 3/2.5 | 1,414 (-10%) | 2mo | $249,500 | $176 | 82 |
| 2409 E Tamarindo Ave | 0.12mi | 3/2.0 | 1,474 (-6%) | 1mo | $255,000 | $173 | 81 |
| 2412 Sabinal Ave | 0.12mi | 3/2.0 | 1,405 (-10%) | 1mo | $229,000 | $163 | 74 |
| 2805 Q St | 0.49mi | 3/2.0 | 1,544 (-2%) | 3mo | $249,900 | $162 | 70 |
| 3003 E Q St | 0.55mi | 3/2.0 | 1,498 (-5%) | 0mo | $269,000 | $180 | 64 |
| 2809 E Palo Blanco Ave | 0.49mi | 3/2.5 | 1,745 (+11%) | 1mo | $299,000 | $171 | 58 |
| 2908 E Uva Ave | 0.53mi | 3/2.0 | 1,730 (+10%) | 3mo | $299,900 | $173 | 54 |
| 3104 E Uva Ave E | 0.63mi | 3/3.5 | 1,726 (+10%) | 2mo | $294,900 | $171 | 49 |
| 1515 32nd St | 0.68mi | 3/2.5 | 1,740 (+11%) | 2mo | $285,000 | $164 | 49 |
| 1305 N Sabinas St | 0.71mi | 3/2.0 | 1,403 (-11%) | 3mo | $185,000 | $132 | 45 |
Match score weights: distance 35% · size 25% · config 20% · recency 20%. Top-matched comps best support the ARV.
Projected returns pro-forma
10.0% appreciation · 3.0% rent growth · sell at horizon
- IRR
- 20.6%
- Equity multiple
- 2.67×
- Total profit
- $125,413
- Equity at exit
- $241,859
- IRR
- 18.7%
- Equity multiple
- 6.13×
- Total profit
- $385,760
- Equity at exit
- $521,578
Cash invested: $75,172 (down + closing). Projections, not guarantees.
Landlord ↔ Tenant lean methodology
- Overall (STATE)
- 87 Strongly Landlord-Friendly
- State Texas
- 87 Strongly Landlord-Friendly · R+5
- County
- — inherits STATE
- City
- — inherits STATE
ZIP-level market 78557
- Home prices YoY
- 17.9%
- Active inventory
- 98
- Price-to-rent
- 11.8×
Monthly cashflow live
- Estimated rent
- $1,934 medium interval (Pro) →
- Mortgage (P&I)
- −$1,408
- Tax est. 1.5%
- −$336 /mo · $4,027/yr
- Insurance
- −$112
- HOA
- −$0
- Vacancy / Maint / Mgmt
- −$406
- Net cashflow
- $-327
Break-even live
Sensitivity live
| Price | -10% $-142 | -5% $-234 | +0% $-327 | +5% $-420 | +10% $-513 |
|---|---|---|---|---|---|
| Rent | -10% $-480 | -5% $-404 | +0% $-327 | +5% $-251 | +10% $-174 |
| Rate | -1.0pp $-192 | -0.5pp $-259 | base $-327 | +0.5pp $-397 | +1.0pp $-467 |
UW: 25.0% down · 7.5% · 30yr · 1.5% tax · 5.0% vac · 8.0% maint · 8.0% mgmt
Financing live
Cash to close
- Down payment
- $67,118
- Closing costs
- $8,054
- Reserves months
- —
- Total cash needed
- —
Loan-product check · same deal, 3 products live
Conventional
25% down · 7.5% · 30yr
- Down + closing
- —
- Monthly P&I
- —
- Monthly cashflow
- —
- DSCR
- —
- Eligible?
- —
Personal DTI + credit; lowest rate.
DSCR
20% down · 8.5% · 30yr
- Down + closing
- —
- Monthly P&I
- —
- Monthly cashflow
- —
- DSCR
- —
- Eligible?
- —
No personal income docs; deal must DSCR.
Hard money
10% down · 12.0% · 12mo
- Down + closing
- —
- Monthly P&I
- —
- Monthly cashflow
- —
- DSCR
- —
- Eligible?
- —
Short-term bridge; refi at stabilization.
Rent comps 2 comps
| Address | Beds | Baths | Sqft | Rent | $/sqft | DOM | Units | Dist |
|---|---|---|---|---|---|---|---|---|
| 2304 E Tamarindo Ave Hidalgo, TX | 3.0 | 2.0 | 1442 | $1,950 | $1.35 | 25d | 1 | 0.04mi |
| 2509 Coma St Hidalgo, TX | 4.0 | 2.5 | 1804 | $1,750 | $0.97 | 25d | 1 | 1.13mi |
Listing history 17 events
-
2026-06-19days on market $272,900 Active 23 DOM
-
2026-06-18days on market $272,900 Active 22 DOM
-
2026-06-17days on market $272,900 Active 21 DOM
-
2026-06-16days on market $272,900 Active 20 DOM
-
2026-06-15days on market $272,900 Active 19 DOM
-
2026-06-14days on market $272,900 Active 17 DOM
-
2026-06-12days on market $272,900 Active 16 DOM
-
2026-06-09days on market $272,900 Active 13 DOM
-
2026-06-08days on market $272,900 Active 12 DOM
-
2026-06-07days on market $272,900 Active 11 DOM
-
2026-06-05days on market $272,900 Active 8 DOM
-
2026-06-03days on market $272,900 Active 7 DOM
-
2026-06-02days on market $272,900 Active 6 DOM
-
2026-06-01days on market $272,900 Active 5 DOM
-
2026-05-31days on market $272,900 Active 4 DOM
-
2026-05-30days on market $272,900 Active 3 DOM
-
2026-05-28$272,900 Active
ⓘ Source: listings_history table (triggers on properties + properties_extension) + one-shot
backfill from property_details.listing_events for pre-trigger history.
Nearby sold comps map
Loading sold comps map…
Walkable amenities ~0.75 mi
Loading nearby amenities…
Taxation est. · year 1
- Rental income
- $23,214
- − Mortgage interest
- −$15,038
- − Property taxes
- −$4,027
- − Insurance
- −$1,342
- − Repairs & maintenance
- −$1,857
- − Management
- −$1,857
- − Depreciation
- −$7,810
- Taxable loss
- −$8,718
- Est. tax savings @ 24.0%
- +$2,092
- After-tax cash flow
- $-1,833/yr
For passive investors: Depreciation is non-cash, so a rental often shows a tax loss while cash-flowing — sheltering income. Rental losses are passive: they offset passive income freely, and up to $25,000/yr can offset ordinary (W-2) income if you actively participate and your MAGI is under $100k (phasing out to $0 by $150k); unused losses carry forward. On sale, claimed depreciation is recaptured at up to 25%, and gains may owe capital-gains tax (a 1031 exchange can defer both). Figures are a year-1 estimate at your 24.0% rate — not tax advice; consult a CPA.
Schools (NCES district)
- District
- Valley View ISD
- NCES district ID
- 4843800
- Math proficiency
- 24% ▼ -42.00%
- Reading proficiency
- 38% ▼ -16.00%
- Median HH income
- $33,158
- Composite
- 25.37/100
- National rank
- #7473
- State rank
- #631 of 826 in TX
Livability — Hidalgo
- Score
- 68/100
- State rank
- #488
- US rank
- #9681
Category grades
Schools grade is shown separately in the Schools card above.
Census & demographics
- Census place
- Hidalgo, TX
- City population
- 14,250
- Population (ZIP)
- 14,250
Population outlook (Hidalgo County) Hauer SSP2
- Today (2025)
- 955,232 people
- By 2030
- 1,009,774 · +5.7%
- By 2040
- 1,120,332 · +17.3%
- By 2050
- 1,225,036 · +28.2%
- By 2075
- 1,439,189 · +50.7%
- By 2100
- 1,533,429 · +60.5%
Race, ethnicity, and origin ACS 2023
- Neighborhood character
- Predominantly Hispanic (99%)
- Race & ethnicity
- Hispanic / Latino 99% Two or more races 47%
- Hispanic origin (detail)
- Mexican 93%
- Foreign-born
- 39% · Canada
- Languages at home
- 6% English-only · Spanish 94%
Political lean MEDSL · Hidalgo
- 2024 margin
- Toss-up / Even · D 48.1% · R 51.0%
- 2008→2024 swing
- -41.6pp toward R · 2008: 38.7pp · 2024: -2.9pp
- All cycles
- 2024: R+2.9 2020: D+17.1 2016: D+40.5 2012: D+41.8 2008: D+38.7
Not yet ingested
- Civics
- —
Market trends
- HPI YoY
- ▲ 34.26%
- Current HPI
- 225.701
- Rent YoY
- —
- Metro
- —
- State GDP YoY
- ▲ 3.95%
- F500 in state
- 110
Industry mix (Fortune 500 HQ in TX)
| Industry | F500 HQs | Revenue |
|---|---|---|
| Energy | 16 | $1,198B |
|
||
| Technology | 5 | $198B |
|
||
| Engineering / Construction | 4 | $72B |
|
||
| Energy Services | 3 | $60B |
|
||
| Utilities | 3 | $41B |
|
||
| Healthcare | 2 | $330B |
|
||
Price history
1 event — show timeline
- 2026-05-28 Listed $272,900 MCALLENMLS
Cash-flow waterfall
monthlySold comps — $/sqft
last 12 mo · ≤1 miLoading sold comps…