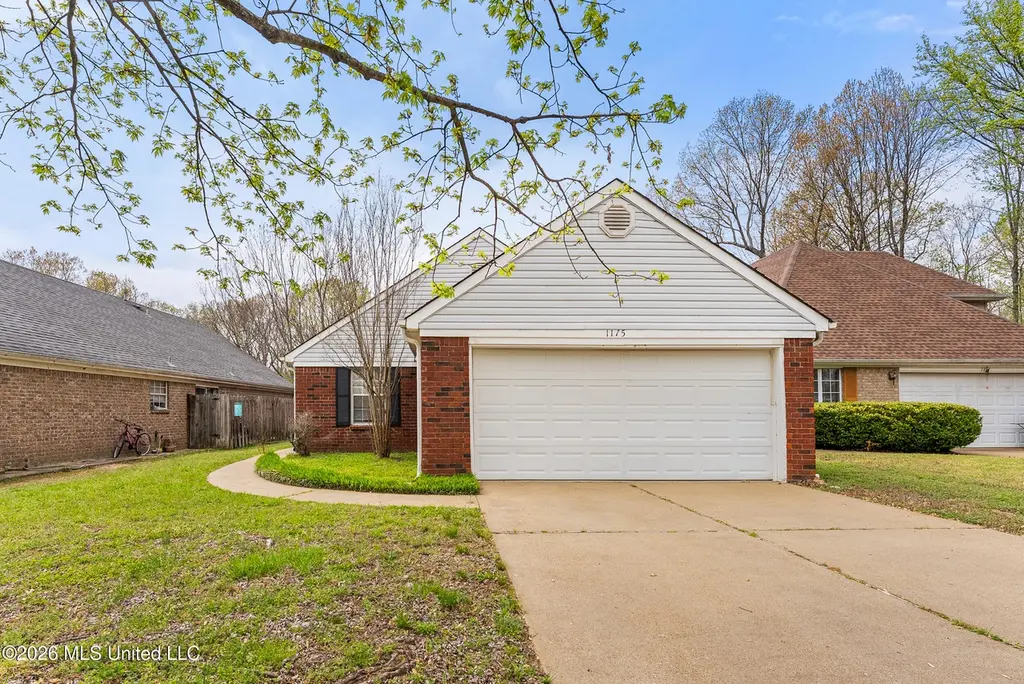
1175 Wilson Rdg · Walls, MS
Flood risk 1/10 · Minimal
- FEMA flood zone
- X (unshaded)
- Chance of flooding over 30 yrs
- 0.0%
- Est. flood insurance / yr
- $507 – $1,088
Fire risk 3/10 · Minor
- Est. fire insurance / yr
- $1,241 – $2,305
Heat risk 6/10 · Moderate
- Hot days now (above 109°F)
- 7 days/yr
- Hot days in 30 yrs
- 21 days/yr
Wind risk 4/10 · Minor
- Chance of severe wind over 30 yrs
- 17.0%
Air-quality risk 2/10 · Minimal
- Unhealthy air days now
- 2 days/yr
- Unhealthy air days in 30 yrs
- 2 days/yr
Risk factors via First Street. Map © Google.
Why this score? — see what drove the D grade
The composite is a weighted blend of 9 inputs, each scored 0–100. Each bar is that input's sub-score; the figure is the points it added to the 100-point composite (weight × sub-score).
- Cash flow +13.3/30.0
- ARV discount +9.0/15.0
- DSCR +4.0/10.0
- Schools +4.0/10.0
- Livability +3.2/5.0
- 1% rule +3.1/10.0
- Rent growth +2.5/5.0
- Condition / age +2.5/5.0
- Appreciation +0.0/10.0
$189,999
🖨 Deal sheet 📄 Offer letter ✓ Due diligence
Listing remarks
Spacious single-story home featuring 3 bedrooms, 2 bathrooms, and a 2-car garage with a functional and inviting layout. The main living areas offer comfortable space for both everyday living and entertaining, while the kitchen provides ample cabinet and counter space and opens to the dining and living areas for easy flow. The primary bedroom includes an en-suite bathroom and generous closet space. Additional bedrooms offer flexibility for guests, office, or hobbies. Enjoy the backyard with space to relax or entertain. Great opportunity with plenty of potential!
Key facts
- 5,662 sq ft lot
- 2 garage spots
- Built 1998
Neighborhood map
What this means for you Summary
Snapshot
- This is a 3-bed/2.0-bath single-family listed at $190k.
Deal economics
- At list price, monthly cash flow is $0 ($-5/yr) — negative.
- To cash-flow at today's rent, offer at most $190k (0.0% below list).
- To meet the 1% rule (rent ≥ 1% of price), the offer needs to be $154k (19.2% below list).
- Recommended offer: $154k (19.2% below list) — sets the bar for 1% rule.
Location & tenants
- Location reads 64/100 on livability (#124 in MS) — a middle-class / working-renter tenant base. Strengths: crime A+, cost of living A+; Watch: amenities F, commute F, employment F.
- Desoto County School District (suburban): math 48% / reading 42% proficiency, ranked #20 of 130 in MS (top 15%) — families likely to look elsewhere, expect single-tenant / working-renter base with shorter leases.
- Zoned schools: Lake Cormorant Elementary (math 48% / reading 55%, grade C-, #56 of 375 statewide, top 15%, 647 students, 100% FRL); Lake Cormorant Middle (math 51% / reading 30%, grade F, #60 of 179 statewide, top 37%, 764 students, 100% FRL); Lake Cormorant High (math 29% / reading 42%, grade F, #66 of 197 statewide, top 34%, 969 students, 100% FRL) — zoned schools average 100% FRL vs 43% district-wide (56 pts higher); higher-poverty schools than district average — tighter screening recommended.
- Market conditions: 56 active listings in the ZIP; 1,155 units permitted in DeSoto County in 2024 (0 in 5+ unit buildings).
Forward outlook
- Local home prices are declining (-3.0%/yr); year-one equity from $1k of loan paydown is wiped out by about $6k of value loss. Plan a longer hold.
- DeSoto County population projected at +33% by 2050 — long-run rental-demand tailwind backs the buy-and-hold thesis.
Negotiation context
- It's been on market 27 days — a 2% lower offer ($187k) is reasonable based on typical stale-listing flexibility.
- 8 sale attempts since 23y ago with the ask held roughly flat each time — persistent listings suggest the price (not the market) is what's stuck; bring a comps-based counter.
Risks & watch-outs
- Climate carrying-cost: extreme-heat days projected 7→21/yr by 2055 (HVAC capex compounding) — expect insurance premiums to compound above CPI over the hold.
Questions for the listing agent
- What do current leases actually rent for vs. the listed asking? Can we see a recent rent roll and the last 12 months of T-12 income?
- What does the HOA fee cover, when was the last increase, and are there any pending special assessments or reserve-fund shortfalls?
- Is there a deadline driving the sale (1031 exchange, divorce, estate, relocation)? That informs how much negotiation room exists.
- Schools are D-rated, which usually means shorter tenancies and higher turnover. Who's the typical renter profile here, and what's been the actual vacancy rate?
- The area grade is low — what's the realistic commute time and amenity access for the typical tenant pool here? Any planned neighborhood developments (good or bad) we should know about?
- What's the average days-on-market for RENTAL listings here right now (not sales)? A rising rental-DOM trend means longer vacancies and softer asking-rent achievability than the comps imply.
- What's the recent tenant-quality profile in this submarket — average credit score on applications, eviction rate, late-payment / NSF rate, and stable-employment percentage? A property-management company in the area should have these aggregated.
- How much new for-sale + rental construction is in the pipeline within 1–3 miles? Heavy new supply typically softens prices + rents 12–24 months out; constrained supply supports both.
Investment metrics
- 1% rule
- 0.81% ✗
- Cap rate
- 6.29%
- Cash-on-cash
- -0.01%
- DSCR
- 1.00
- GRM
- 10.3
CMA / ARV
- ARV (on-the-fly)
- $196,636
- Comps found
- 3
Show comp detail 3 sales within ~0.75 mi
| Address | Dist | Beds/Ba | Sqft | Sold | Price | $/sf | Match |
|---|---|---|---|---|---|---|---|
| 1131 Wilson Rdg | 0.03mi | 3/2.0 | 1,203 (+0%) | 15mo | $195,000 | $162 | 86 |
| 1120 Wilson Rdg | 0.04mi | 3/2.0 | 1,280 (+7%) | 13mo | $210,000 | $164 | 76 |
| 1070 Wilson Ridge Rdg | 0.07mi | 3/2.0 | 1,300 (+8%) | 11mo | $220,000 | $169 | 74 |
Match score weights: distance 35% · size 25% · config 20% · recency 20%. Top-matched comps best support the ARV.
Projected returns pro-forma
-3.0% appreciation · 3.0% rent growth · sell at horizon
- IRR
- -16.4%
- Equity multiple
- 0.42×
- Total profit
- $-30,855
- Equity at exit
- $28,329
- IRR
- -8.1%
- Equity multiple
- 0.49×
- Total profit
- $-27,059
- Equity at exit
- $16,428
Cash invested: $53,200 (down + closing). Projections, not guarantees.
Landlord ↔ Tenant lean methodology
- Overall (STATE)
- 90 Strongly Landlord-Friendly
- State Mississippi
- 90 Strongly Landlord-Friendly · R+11
- County
- — inherits STATE
- City
- — inherits STATE
ZIP-level market 38641
- Home prices YoY
- -10.2%
- Active inventory
- 56
- Price-to-rent
- 10.3×
Monthly cashflow live
- Estimated rent
- $1,536 medium interval (Pro) →
- Mortgage (P&I)
- −$996
- Tax from tax record
- −$128 /mo · $1,538/yr
- Insurance
- −$79
- HOA
- −$10
- Vacancy / Maint / Mgmt
- −$323
- Net cashflow
- $-0
Break-even live
UW: 25.0% down · 7.5% · 30yr · 1.5% tax · 5.0% vac · 8.0% maint · 8.0% mgmt
Financing live
Cash to close
- Down payment
- $47,500
- Closing costs
- $5,700
- Reserves months
- —
- Total cash needed
- —
Loan-product check · same deal, 3 products live
Conventional
25% down · 7.5% · 30yr
- Down + closing
- —
- Monthly P&I
- —
- Monthly cashflow
- —
- DSCR
- —
- Eligible?
- —
Personal DTI + credit; lowest rate.
DSCR
20% down · 8.5% · 30yr
- Down + closing
- —
- Monthly P&I
- —
- Monthly cashflow
- —
- DSCR
- —
- Eligible?
- —
No personal income docs; deal must DSCR.
Hard money
10% down · 12.0% · 12mo
- Down + closing
- —
- Monthly P&I
- —
- Monthly cashflow
- —
- DSCR
- —
- Eligible?
- —
Short-term bridge; refi at stabilization.
HOA detail
- Monthly dues
- $10 · $120/yr
Listing history 30 events
-
2026-06-10status $189,999 Pending 27 DOM
-
2026-06-09days on market $189,999 Active 27 DOM
-
2026-06-08days on market $189,999 Active 26 DOM
-
2026-06-07days on market $189,999 Active 25 DOM
-
2026-06-03pricedays on market $189,999 Active 21 DOM
-
2026-06-02days on market $192,500 Active 20 DOM
-
2026-06-01days on market $192,500 Active 19 DOM
-
2026-05-31days on market $192,500 Active 18 DOM
-
2026-04-17status Pending
-
2026-03-31$192,500 Active
-
2026-01-26historical
-
2026-01-09price $212,000
-
2025-12-15$213,180 Active
-
2025-10-31historical
-
2025-09-05price $213,180
-
2025-08-20price $219,900
-
2025-08-07$224,400 Active
-
2023-07-09historical
-
2023-07-06historical
-
2021-10-11historical
-
2021-10-11historical
-
2021-10-11historical
-
2021-10-11historical
-
2017-02-24historical
-
2017-01-25$93,000
-
2015-03-23$105,000
-
2014-03-21$107,525
-
2006-04-28soldstatus
-
2004-07-01$96,900
-
2003-09-11$96,900
ⓘ Source: listings_history table (triggers on properties + properties_extension) + one-shot
backfill from property_details.listing_events for pre-trigger history.
Tax reassessment forecast MS · Resets to sale price
- Current annual tax
- $1,538 · $128/mo
- Projected year-2 tax
- $1,538 · $128/mo
- Expected delta
- $0/yr ($0/mo · 0.0%)
ⓘ Screening estimate from a state-policy table — verify with the county assessor before closing.
Climate risk First Street
- Flood 1/10 Low FEMA zone X (unshaded) · 0% chance over 30 yrs
- Wildfire 3/10 Moderate
- Heat 6/10 Major 7 d/yr ≥109°F today · 21 d/yr by 30 yrs out
- Wind 4/10 Moderate 17% chance of damaging wind over 30 yrs
- Air quality 2/10 Low 2 unhealthy d/yr today · 2 by 30 yrs out
Nearby sold comps map
Loading sold comps map…
Walkable amenities ~0.75 mi
Loading nearby amenities…
Taxation est. · year 1
- Rental income
- $18,429
- − Mortgage interest
- −$10,643
- − Property taxes
- −$1,538
- − Insurance
- −$950
- − Repairs & maintenance
- −$1,474
- − Management
- −$1,474
- − HOA
- −$120
- − Depreciation
- −$5,527
- Taxable loss
- −$3,298
- Est. tax savings @ 24.0%
- +$791
- After-tax cash flow
- $786/yr
For passive investors: Depreciation is non-cash, so a rental often shows a tax loss while cash-flowing — sheltering income. Rental losses are passive: they offset passive income freely, and up to $25,000/yr can offset ordinary (W-2) income if you actively participate and your MAGI is under $100k (phasing out to $0 by $150k); unused losses carry forward. On sale, claimed depreciation is recaptured at up to 25%, and gains may owe capital-gains tax (a 1031 exchange can defer both). Figures are a year-1 estimate at your 24.0% rate — not tax advice; consult a CPA.
Schools (NCES district)
- District
- Desoto County School District
- NCES district ID
- 2801320
- Math proficiency
- 48% ▼ -13.00%
- Reading proficiency
- 42% ▼ -6.00%
- Median HH income
- $59,272
- Composite
- 39.56/100
- National rank
- #3933
- State rank
- #20 of 130 in MS
Livability — Walls
- Score
- 64/100
- State rank
- #124
- US rank
- #13666
Category grades
Schools grade is shown separately in the Schools card above.
Census & demographics
- City population
- 9,171
- Population (ZIP)
- 2,102
Population outlook (DeSoto County) Hauer SSP2
- Today (2025)
- 203,338 people
- By 2030
- 217,692 · +7.1%
- By 2040
- 245,320 · +20.6%
- By 2050
- 270,133 · +32.8%
- By 2075
- 323,341 · +59.0%
- By 2100
- 348,742 · +71.5%
Race, ethnicity, and origin ACS 2023
- Neighborhood character
- Predominantly White (76%)
- Race & ethnicity
- White 76% Black 13% Hispanic / Latino 8% Two or more races 5%
- Hispanic origin (detail)
- Mexican 8%
- Common ancestry
- Lithuanian 5% Slovak 2% Italian 1%
- Foreign-born
- 3% · Canada
- Languages at home
- 91% English-only · Spanish 8% German/W. Germanic 1%
Political lean MEDSL · DeSoto
- 2024 margin
- Strong R (+24.1) · D 36.7% · R 60.8% · Other 2.5%
- 2008→2024 swing
- +14.2pp toward D · 2008: -38.2pp · 2024: -24.1pp
- All cycles
- 2024: R+24.1 2020: R+23.9 2016: R+34.8 2012: R+33.5 2008: R+38.2
Not yet ingested
- Civics
- —
Market trends
- HPI YoY
- ▼ -21.08%
- Current HPI
- 186.4506
- Rent YoY
- —
- Metro
- —
- State GDP YoY
- —
- F500 in state
- 0
Price history
+98.7% since first listed22 events — show timeline
- 2026-04-17 Pending — MLSU
- 2026-03-31 Listed $192,500 MLSU
- 2026-01-26 Listing Removed — MLSU
- 2026-01-09 Price Changed $212,000 MLSU
- 2025-12-15 Listed $213,180 MLSU
- 2025-10-31 Listing Removed — MLSU
- 2025-09-05 Price Changed $213,180 MLSU
- 2025-08-20 Price Changed $219,900 MLSU
- 2025-08-07 Listed $224,400 MLSU
- 2023-07-09 Rental Removed — APPFOLIO
- 2023-07-06 Rental Removed — RENT.
- 2021-10-11 Listing Removed — MLSU
- 2021-10-11 Listing Removed — MLSU
- 2021-10-11 Listing Removed — MLSU
- 2021-10-11 Listing Removed — MLSU
- 2017-02-24 Listing Removed — MLSU
- 2017-01-25 Listed $93,000 MLSU
- 2015-03-23 Listed $105,000 MLSU
- 2014-03-21 Listed $107,525 MLSU
- 2006-04-28 Sold (Public Records) — Public Records
- 2004-07-01 Listed $96,900 MLSU
- 2003-09-11 Listed $96,900 MLSU
Property tax history
+1.3%/yrLatest (2025): $1,538 · +8.5% YoY. Source: county tax records.
Cash-flow waterfall
monthlySold comps — $/sqft
last 12 mo · ≤1 miLoading sold comps…