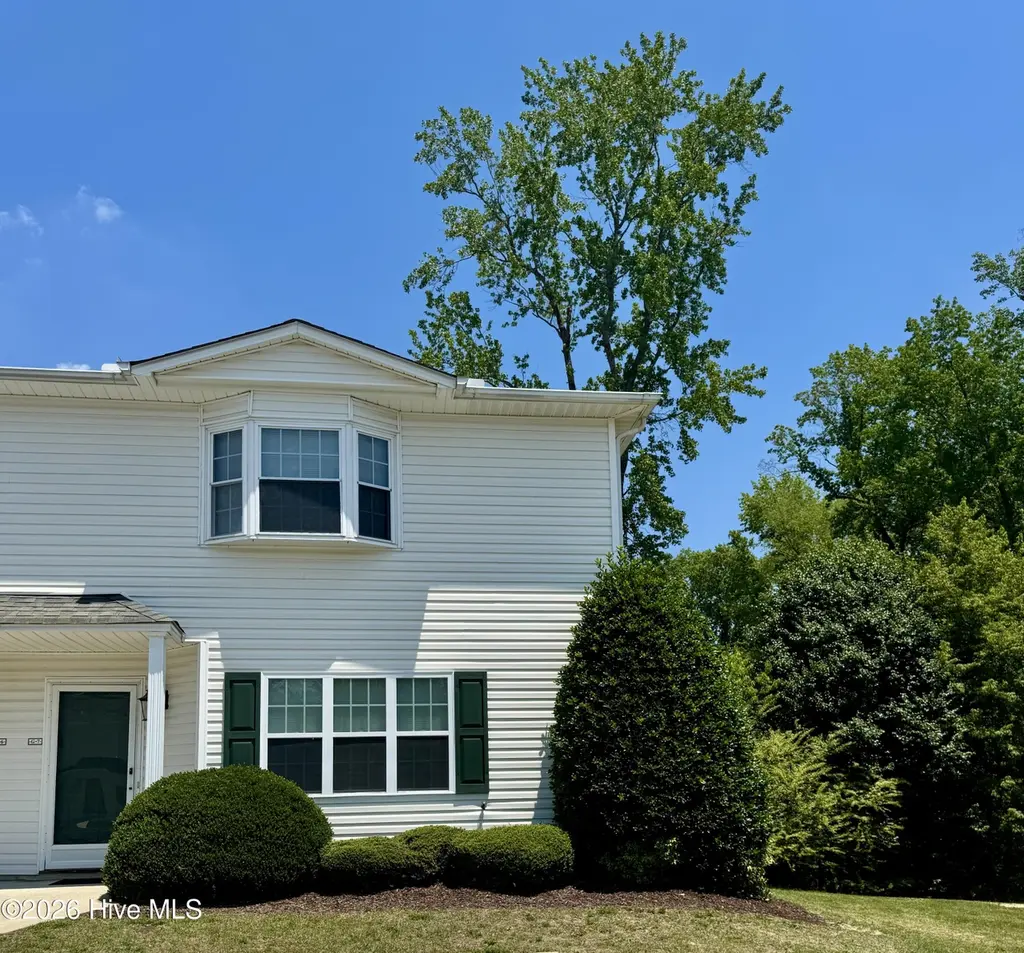
1225 Cross Creek Cir Unit G7 · Greenville, NC
Flood risk 1/10 · Minimal
- FEMA flood zone
- X (unshaded)
- Chance of flooding over 30 yrs
- 0.0%
- Est. flood insurance / yr
- $507 – $1,088
Fire risk 3/10 · Minor
- Est. fire insurance / yr
- $906 – $1,684
Heat risk 8/10 · Major
- Hot days now (above 106°F)
- 7 days/yr
- Hot days in 30 yrs
- 17 days/yr
Wind risk 8/10 · Major
- Chance of severe wind over 30 yrs
- 80.0%
Air-quality risk 3/10 · Minor
- Unhealthy air days now
- 3 days/yr
- Unhealthy air days in 30 yrs
- 3 days/yr
Risk factors via First Street. Map © Google.
Why this score? — see what drove the D- grade
The composite is a weighted blend of 9 inputs, each scored 0–100. Each bar is that input's sub-score; the figure is the points it added to the 100-point composite (weight × sub-score).
- Cash flow +11.8/30.0
- ARV discount +6.1/15.0
- Rent growth +3.9/5.0
- Livability +3.9/5.0
- Schools +3.6/10.0
- DSCR +3.5/10.0
- 1% rule +3.3/10.0
- Condition / age +2.5/5.0
- Appreciation +0.0/10.0
$179,900
🖨 Deal sheet 📄 Offer letter ✓ Due diligence
Listing remarks MLS
Cross Creek Subdivision - great place to live and great place to invest! Perfect location and an End unit - close to Vidant and ECU. 3 bedrooms, 2.5 baths - upstairs bedroom with walk-in closet - Enjoy sitting by the fireplace in the living area or time spent in the spacious eat-in kitchen. Call quick to schedule your appointment - this will not last long!
Key facts
- End unit
- $78 HOA
- Built 2008
Tags
Property features AI
Finance
- Other: Subdivision: Cross Creek Townhomes
- HOA & community: Homeowners association with annual fee of $936 (about $78/month)
Exterior
- Parking: Assigned parking in a concrete parking lot
- Utilities: Public water; Sewer connected; Water connected
- Home design: Townhouse; Two levels / 2 stories; Entry level: 1; Vinyl siding and frame construction
- Construction: Shingle roof; Slab foundation; Built with vinyl siding and frame
- Exterior features: Patio; Fenced yard; Has a view; Paved road access
Interior
- Kitchen: Built-in electric oven; Dishwasher
- Bedrooms: Total of 5 rooms (includes bedrooms and living spaces)
- Flooring: Carpet; Vinyl
- Bathrooms: 2 full bathrooms; 1 half bathroom
- Heating & cooling: Heat pump heating; Electric heating; Central air conditioning
- Interior features: Walk-in closets; Ceiling fans; Window coverings; Insulated windows; Built-in electric oven; Dishwasher; Electric water heater; Laundry room
- Laundry & utility: Laundry room; Electric water heater
Neighborhood map
What this means for you Summary
Snapshot
- This is a 3-bed/2.5-bath townhouse listed at $180k.
Deal economics
- At list price, monthly cash flow is $-49 ($-583/yr) — negative.
- To cash-flow at today's rent, offer at most $171k (4.8% below list).
- To meet the 1% rule (rent ≥ 1% of price), the offer needs to be $149k (17.3% below list).
- Recommended offer: $149k (17.3% below list) — sets the bar for 1% rule.
- Cap rate 6.0% vs local median 3.8% in Greenville — top-decile yield for the area; either an underpriced asset or a hidden risk that comps aren't pricing in. Stress-test before assuming the spread holds.
Location & tenants
- Location reads 77/100 on livability (#30 in NC, #2,977 nationally) — a middle-class / working-renter tenant base. Strengths: commute A+, cost of living A+, health & safety A+; Watch: crime F, employment F.
- Pitt County Schools (rural): math 41% / reading 44% proficiency, ranked #100 of 178 in NC (top 56%) — families likely to look elsewhere, expect single-tenant / working-renter base with shorter leases.
- Zoned schools: Lakeforest Elementary (math 22% / reading 30%, grade F, #1,085 of 1,410 statewide, top 77%, 804 students, 98% FRL); E B Aycock Middle (math 27% / reading 30%, grade F, #355 of 475 statewide, top 76%, 661 students, 99% FRL); South Central (math 42% / reading 51%, grade D-, #344 of 535 statewide, top 64%, 1,675 students, 55% FRL) — zoned schools average 84% FRL vs 56% district-wide (28 pts higher); higher-poverty schools than district average — tighter screening recommended.
- Market conditions: Rents rising fast (+5.4%/yr); 350 active listings in the ZIP; 18 comparable units currently listed for rent nearby; rentals at typical pace (median 21d on market — plan ~3-4 weeks tenant-placement turnaround); 1,300 units permitted in Pitt County in 2024 (204 in 5+ unit buildings).
- This rent runs 36% of the median local income ($49k/yr) — at the standard rent-burdened threshold; future hikes will face affordability resistance.
Forward outlook
- Local home prices are declining (-3.0%/yr); year-one equity from $1k of loan paydown is wiped out by about $5k of value loss. Plan a longer hold.
- Pitt County population projected at +22% by 2050 — long-run rental-demand tailwind backs the buy-and-hold thesis.
Negotiation context
- It's been on market 31 days — a 3% lower offer ($175k) is reasonable based on typical stale-listing flexibility.
- 5 sale attempts since 18y ago with the ask held roughly flat each time — persistent listings suggest the price (not the market) is what's stuck; bring a comps-based counter.
- Current owner paid $95k; list at $180k implies a 89% gain — meaningful room to come down on a strong offer.
Risks & watch-outs
- Climate carrying-cost: severe wind risk, 80% chance of damaging wind over 30y; extreme-heat days projected 7→17/yr by 2055 (HVAC capex compounding) — expect insurance premiums to compound above CPI over the hold.
Questions for the listing agent
- What do current leases actually rent for vs. the listed asking? Can we see a recent rent roll and the last 12 months of T-12 income?
- It's been on market 31 days. Have you received any prior offers? Is the seller open to a 17% concession, seller financing, or rate buy-down credit?
- What does the HOA fee cover, when was the last increase, and are there any pending special assessments or reserve-fund shortfalls?
- Is there a deadline driving the sale (1031 exchange, divorce, estate, relocation)? That informs how much negotiation room exists.
- Crime grade is F in this area — have there been break-ins, vandalism, or insurance claims at this property in the last 3 years? What carrier currently insures it and at what premium?
- The area grade is low — what's the realistic commute time and amenity access for the typical tenant pool here? Any planned neighborhood developments (good or bad) we should know about?
- What's the average days-on-market for RENTAL listings here right now (not sales)? A rising rental-DOM trend means longer vacancies and softer asking-rent achievability than the comps imply.
- What's the recent tenant-quality profile in this submarket — average credit score on applications, eviction rate, late-payment / NSF rate, and stable-employment percentage? A property-management company in the area should have these aggregated.
- How much new for-sale + rental construction is in the pipeline within 1–3 miles? Heavy new supply typically softens prices + rents 12–24 months out; constrained supply supports both.
Investment metrics
- 1% rule
- 0.83% ✗
- Cap rate
- 5.97%
- Cash-on-cash
- -1.16%
- DSCR
- 0.95
- GRM
- 10.1
CMA / ARV
- ARV (on-the-fly)
- $174,360
- Comps found
- 12
Show comp detail 12 sales within ~0.75 mi
| Address | Dist | Beds/Ba | Sqft | Sold | Price | $/sf | Match |
|---|---|---|---|---|---|---|---|
| 1222 Cross Creek Cir Unit W5 | 0.02mi | 3/2.5 | 1,457 (+0%) | 9mo | $171,000 | $117 | 91 |
| 1225 Cross Creek Cir Unit G2 | 0.00mi | 3/2.5 | 1,454 (+0%) | 12mo | $180,000 | $124 | 90 |
| 1221 Cross Creek Cir Unit F2 | 0.04mi | 3/2.5 | 1,453 (0%) | 13mo | $175,000 | $120 | 87 |
| 1216 Cross Creek Cir Unit X6 | 0.06mi | 3/2.5 | 1,453 (0%) | 15mo | $175,000 | $120 | 85 |
| 1035 Spring Forest Rd Unit D10 | 0.40mi | 3/2.5 | 1,453 (0%) | 10mo | $152,000 | $105 | 73 |
| 1005 Spring Forest Rd Unit G6 | 0.39mi | 3/2.5 | 1,453 (0%) | 12mo | $175,000 | $120 | 72 |
| 965 Spring Forest Rd Unit A6 | 0.44mi | 3/2.5 | 1,453 (0%) | 10mo | $125,000 | $86 | 72 |
| 1025 Spring Forest Rd Unit E4 | 0.41mi | 3/2.5 | 1,450 (-0%) | 12mo | $170,000 | $117 | 70 |
| 3028 Spring Creek Rd Unit B | 0.22mi | 3/2.5 | 1,338 (-8%) | 17mo | $229,500 | $172 | 63 |
| 904 Spring Forest Rd Unit E9 | 0.63mi | 2/2.5 (-1) | 1,344 (-8%) | 9mo | $155,000 | $115 | 45 |
| 870 Spring Forest Rd Unit G9 | 0.69mi | 2/2.5 (-1) | 1,302 (-10%) | 9mo | $161,000 | $124 | 38 |
| 2907 Flintridge Dr | 0.69mi | 3/2.0 | 1,267 (-13%) | 12mo | $190,000 | $150 | 35 |
Match score weights: distance 35% · size 25% · config 20% · recency 20%. Top-matched comps best support the ARV.
Projected returns pro-forma
-3.0% appreciation · 5.44% rent growth · sell at horizon
- IRR
- -15.5%
- Equity multiple
- 0.43×
- Total profit
- $-28,492
- Equity at exit
- $26,824
- IRR
- -3.4%
- Equity multiple
- 0.75×
- Total profit
- $-12,609
- Equity at exit
- $15,554
Cash invested: $50,372 (down + closing). Projections, not guarantees.
Landlord ↔ Tenant lean methodology
- Overall (STATE)
- 85 Strongly Landlord-Friendly
- State North Carolina
- 85 Strongly Landlord-Friendly · R+3
- County
- — inherits STATE
- City
- — inherits STATE
ZIP-level market 27834
- Rents YoY
- 5.4%
- Active inventory
- 350
- Price-to-rent
- 10.1×
Monthly cashflow live
- Estimated rent
- $1,488 high interval (Pro) →
- Mortgage (P&I)
- −$943
- Tax from tax record
- −$128 /mo · $1,531/yr
- Insurance
- −$75
- HOA
- −$78
- Vacancy / Maint / Mgmt
- −$312
- Net cashflow
- $-49
Break-even live
UW: 25.0% down · 7.5% · 30yr · 1.5% tax · 5.0% vac · 8.0% maint · 8.0% mgmt
Financing live
Cash to close
- Down payment
- $44,975
- Closing costs
- $5,397
- Reserves months
- —
- Total cash needed
- —
Loan-product check · same deal, 3 products live
Conventional
25% down · 7.5% · 30yr
- Down + closing
- —
- Monthly P&I
- —
- Monthly cashflow
- —
- DSCR
- —
- Eligible?
- —
Personal DTI + credit; lowest rate.
DSCR
20% down · 8.5% · 30yr
- Down + closing
- —
- Monthly P&I
- —
- Monthly cashflow
- —
- DSCR
- —
- Eligible?
- —
No personal income docs; deal must DSCR.
Hard money
10% down · 12.0% · 12mo
- Down + closing
- —
- Monthly P&I
- —
- Monthly cashflow
- —
- DSCR
- —
- Eligible?
- —
Short-term bridge; refi at stabilization.
Rent comps 18 comps
| Address | Beds | Baths | Sqft | Rent | $/sqft | DOM | Units | Dist |
|---|---|---|---|---|---|---|---|---|
| 1151 Cross Creek Cir Unit D Greenville, NC | 3.0 | 2.5 | 1338 | $1,550 | $1.16 | 13d | 1 | 0.20mi |
| 1151 Cross Creek Cir Greenville, NC | 3.0 | 2.5 | 1338 | $1,600 | $1.20 | 21d | 1 | 0.20mi |
| 1150 Cross Creek Cir Greenville, NC | 2.0 | 2.0 | 1100 | $1,200 | $1.09 | 21d | 1 | 0.22mi |
| 1035 Spring Forest Rd Greenville, NC | 3.0 | 2.0–2.5 | 1453 | $1,450 | $1.00 | 21d | 2 | 0.40mi |
| 1015 Spring Forest Rd Unit F5 Greenville, NC | 3.0 | 2.5 | 1453 | $1,200 | $0.83 | 21d | 1 | 0.42mi |
| 935 Spring Forest Rd Greenville, NC | 2.0 | 2.0 | 1000 | $1,299 | $1.30 | 21d | 4 | 0.57mi |
| 904 Gabriel Dr Greenville, NC | 1.0–2.0 | 1.0–2.0 | 966 | $1,875 | $1.94 | 21d | 17 | 0.60mi |
| 1510 Bridle Ct Greenville, NC | 1.0–3.0 | 1.0–2.0 | 798 | $1,250 | $1.57 | 21d | 1 | 0.89mi |
| 3709 Nantucket Rd Unit A Greenville, NC | 3.0 | 2.0 | 1427 | $1,700 | $1.19 | 13d | 1 | 1.06mi |
| 203 Shiloh Dr Unit E Greenville, NC | 2.0 | 1.5 | 1000 | $1,130 | $1.13 | 21d | 1 | 1.12mi |
| 1710 Garland St Greenville, NC | 2.0 | 1.0 | 884 | $1,195 | $1.35 | 21d | 1 | 1.17mi |
| 600 Howell St Apt E Greenville, NC | 2.0 | 1.0 | 1050 | $815 | $0.78 | 21d | 1 | 1.27mi |
| 1951 Cambria Dr Unit B Greenville, NC | 3.0 | 3.0 | 1552 | $1,800 | $1.16 | 21d | 1 | 1.32mi |
| 207 Belvedere Dr Greenville, NC | 3.0 | 2.0 | 1695 | $2,300 | $1.36 | 21d | 1 | 1.34mi |
| 1548 Manning Forest Dr Unit M7 Greenville, NC | 2.0 | 1.5 | 1094 | $1,300 | $1.19 | 13d | 1 | 1.44mi |
| 1304 Myrtle St Greenville, NC | 3.0 | 1.0 | 978 | $1,375 | $1.41 | 21d | 1 | 1.47mi |
| 3278 Colony Ct Greenville, NC | 1.0–3.0 | 1.0–2.0 | 1170 | $1,350 | $1.15 | 21d | 1 | 1.49mi |
| 504 Davenport St Unit A Greenville, NC | 2.0 | 1.0 | 900 | $895 | $0.99 | 13d | 1 | 1.50mi |
HOA detail
- Monthly dues
- $78 · $936/yr
Listing history 27 events
-
2026-06-19days on market $179,900 Active 31 DOM
-
2026-06-18days on market $179,900 Active 30 DOM
-
2026-06-17days on market $179,900 Active 29 DOM
-
2026-06-16days on market $179,900 Active 28 DOM
-
2026-06-15days on market $179,900 Active 27 DOM
-
2026-06-13days on market $179,900 Active 24 DOM
-
2026-06-10days on market $179,900 Active 22 DOM
-
2026-06-09days on market $179,900 Active 21 DOM
-
2026-06-08days on market $179,900 Active 20 DOM
-
2026-06-07days on market $179,900 Active 19 DOM
-
2026-06-05days on market $179,900 Active 16 DOM
-
2026-06-03days on market $179,900 Active 15 DOM
-
2026-06-02days on market $179,900 Active 14 DOM
-
2026-06-01days on market $179,900 Active 13 DOM
-
2026-05-31days on market $179,900 Active 12 DOM
-
2026-05-30days on market $179,900 Active 11 DOM
-
2026-05-19$179,900 Active
-
2021-03-02soldstatus $95,000 359-char remark
Show marketing remark (359 chars)
Cross Creek Subdivision - great place to live and great place to invest! Perfect location and an End unit - close to Vidant and ECU. 3 bedrooms, 2.5 baths - upstairs bedroom with walk-in closet - Enjoy sitting by the fireplace in the living area or time spent in the spacious eat-in kitchen. Call quick to schedule your appointment - this will not last long!
-
2021-02-26soldstatus $95,000
-
2021-01-08$95,000 359-char remark
Show marketing remark (359 chars)
Cross Creek Subdivision - great place to live and great place to invest! Perfect location and an End unit - close to Vidant and ECU. 3 bedrooms, 2.5 baths - upstairs bedroom with walk-in closet - Enjoy sitting by the fireplace in the living area or time spent in the spacious eat-in kitchen. Call quick to schedule your appointment - this will not last long!
-
2014-08-28soldstatus 132-char remark
Show marketing remark (132 chars)
Move-in ready end unit in convenient Cross Creek. Home is centrally located & perfect for the medical community. Priced to sell!
-
2013-04-26$72,900 132-char remark
Show marketing remark (132 chars)
Move-in ready end unit in convenient Cross Creek. Home is centrally located & perfect for the medical community. Priced to sell!
-
2012-06-21soldstatus $81,500
-
2012-06-21soldstatus $81,500
-
2012-05-18$80,500
-
2009-05-22soldstatus $83,780
-
2008-11-04$83,350
ⓘ Source: listings_history table (triggers on properties + properties_extension) + one-shot
backfill from property_details.listing_events for pre-trigger history.
Tax reassessment forecast NC · Resets to sale price
- Current annual tax
- $1,531 · $128/mo
- Projected year-2 tax
- $1,531 · $128/mo
- Expected delta
- $0/yr ($0/mo · 0.0%)
ⓘ Screening estimate from a state-policy table — verify with the county assessor before closing.
Climate risk First Street
- Flood 1/10 Low FEMA zone X (unshaded) · 0% chance over 30 yrs
- Wildfire 3/10 Moderate
- Heat 8/10 Severe 7 d/yr ≥106°F today · 17 d/yr by 30 yrs out
- Wind 8/10 Severe 80% chance of damaging wind over 30 yrs
- Air quality 3/10 Moderate 3 unhealthy d/yr today · 3 by 30 yrs out
Nearby sold comps map
Loading sold comps map…
Walkable amenities ~0.75 mi
Loading nearby amenities…
Taxation est. · year 1
- Rental income
- $17,854
- − Mortgage interest
- −$10,077
- − Property taxes
- −$1,531
- − Insurance
- −$900
- − Repairs & maintenance
- −$1,428
- − Management
- −$1,428
- − HOA
- −$936
- − Depreciation
- −$5,233
- Taxable loss
- −$3,680
- Est. tax savings @ 24.0%
- +$883
- After-tax cash flow
- $300/yr
For passive investors: Depreciation is non-cash, so a rental often shows a tax loss while cash-flowing — sheltering income. Rental losses are passive: they offset passive income freely, and up to $25,000/yr can offset ordinary (W-2) income if you actively participate and your MAGI is under $100k (phasing out to $0 by $150k); unused losses carry forward. On sale, claimed depreciation is recaptured at up to 25%, and gains may owe capital-gains tax (a 1031 exchange can defer both). Figures are a year-1 estimate at your 24.0% rate — not tax advice; consult a CPA.
Schools (NCES district)
- District
- Pitt County Schools
- NCES district ID
- 3700012
- Math proficiency
- 41% ▬ 0.00%
- Reading proficiency
- 44% ▲ 2.00%
- Median HH income
- $40,631
- Composite
- 35.67/100
- National rank
- #4877
- State rank
- #100 of 178 in NC
Livability — Greenville
- Score
- 77/100
- State rank
- #30
- US rank
- #2977
Category grades
Schools grade is shown separately in the Schools card above.
Census & demographics
- Census place
- Greenville, NC
- County
- Pitt County · 142,592 people
- City population
- 115,121
- Metro
- Greenville, NC
- Population (ZIP)
- 56,347
- Household income
- $48,935
- Rent vs Own
- Severe rent burden
- 3319.0
Population outlook (Pitt County) Hauer SSP2
- Today (2025)
- 194,585 people
- By 2030
- 203,756 · +4.7%
- By 2040
- 220,807 · +13.5%
- By 2050
- 236,614 · +21.6%
- By 2075
- 275,940 · +41.8%
- By 2100
- 300,058 · +54.2%
Race, ethnicity, and origin ACS 2023
- Neighborhood character
- Diverse neighborhood (Simpson 0.59)
- Race & ethnicity
- Black 54% White 33% Hispanic / Latino 8% Two or more races 3% Asian 2%
- Hispanic origin (detail)
- Mexican 7%
- Common ancestry
- Lithuanian 1% Slovak 1% Romanian 1%
- Foreign-born
- 7% · Canada, China
- Languages at home
- 91% English-only · Spanish 6% Other Asian/Pacific 1%
Political lean MEDSL · Pitt
- 2024 margin
- Lean D (+6.0) · D 52.5% · R 46.5% · Other 1.1%
- 2008→2024 swing
- -2.8pp toward R · 2008: 8.8pp · 2024: 6.0pp
- All cycles
- 2024: D+6.0 2020: D+9.4 2016: D+7.4 2012: D+6.7 2008: D+8.8
Not yet ingested
- Civics
- —
Market trends
- HPI YoY
- ▼ -187.99%
- Current HPI
- 190.6869
- Rent YoY
- ▲ 5.44%
- Metro
- Greenville, NC
- State GDP YoY
- ▲ 3.28%
- F500 in state
- 26
Industry mix (Fortune 500 HQ in NC)
| Industry | F500 HQs | Revenue |
|---|---|---|
| Financial Services | 2 | $213B |
|
||
| Retail | 2 | $95B |
|
||
| Industrial Conglomerate | 1 | $38B |
|
||
| Metals / Steel | 1 | $35B |
|
||
| Utilities | 1 | $30B |
|
||
| Industrial Machinery | 1 | $19B |
|
||
Price history
+115.8% since first listed11 events — show timeline
- 2026-05-19 Listed $179,900 Hive MLS
- 2021-03-02 Sold (MLS) $95,000 Hive MLS
- 2021-02-26 Sold (Public Records) $95,000 Public Records
- 2021-01-08 Listed $95,000 Hive MLS
- 2014-08-28 Sold (MLS) — Hive MLS
- 2013-04-26 Listed $72,900 Hive MLS
- 2012-06-21 Sold (Public Records) $81,500 Public Records
- 2012-06-21 Sold (MLS) $81,500 Hive MLS
- 2012-05-18 Listed $80,500 Hive MLS
- 2009-05-22 Sold (MLS) $83,780 Hive MLS
- 2008-11-04 Listed $83,350 Hive MLS
Property tax history
+5.3%/yrLatest (2025): $1,531 · +0.8% YoY. Source: county tax records.
Cash-flow waterfall
monthlySold comps — $/sqft
last 12 mo · ≤1 miLoading sold comps…