323 N Princeton Ave #8 · Villa Park, IL
Flood risk 4/10 · Minor
- FEMA flood zone
- X (unshaded)
- Chance of flooding over 30 yrs
- 0.22%
- Est. flood insurance / yr
- $507 – $1,088
Fire risk 1/10 · Minimal
- Est. fire insurance / yr
- $804 – $1,492
Heat risk 3/10 · Minor
- Hot days now (above 102°F)
- 7 days/yr
- Hot days in 30 yrs
- 14 days/yr
Wind risk 2/10 · Minimal
- Chance of severe wind over 30 yrs
- —
Air-quality risk 4/10 · Minor
- Unhealthy air days now
- 4 days/yr
- Unhealthy air days in 30 yrs
- 5 days/yr
Risk factors via First Street. Map © Google.
Why this score? — see what drove the D grade
The composite is a weighted blend of 9 inputs, each scored 0–100. Each bar is that input's sub-score; the figure is the points it added to the 100-point composite (weight × sub-score).
- Cash flow +11.2/30.0
- ARV discount +7.5/15.0
- 1% rule +6.9/10.0
- Livability +3.8/5.0
- Rent growth +3.5/5.0
- DSCR +3.3/10.0
- Schools +2.9/10.0
- Condition / age +2.5/5.0
- Appreciation +0.0/10.0
$144,900
🖨 Deal sheet 📄 Offer letter ✓ Due diligence
Listing remarks
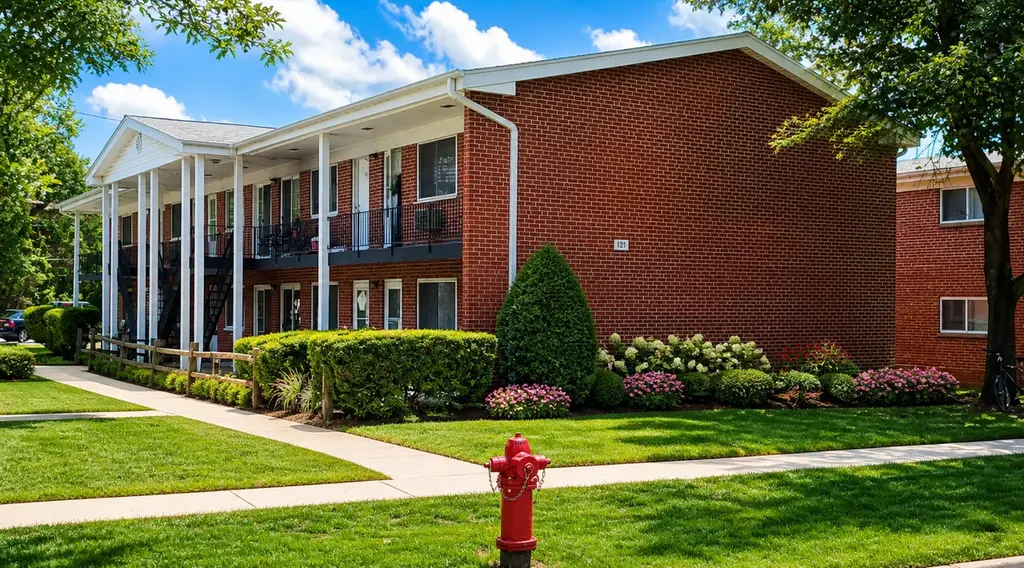
Go into an open floor plan with stainless steel appliances, hardwood floors, wood cabinets and electric heat. Microwave and range are brand new. Additional storage in the shared basement which also houses the shared in building washer and dryer units. Don't miss the opportunity to acquire a condo in a highly rated Villa Park, IL. The condo has two bedrooms and one bathroom, and is a perfect starter home to build equity while stopping paying rent. You will enjoy the well designed 660 sqft that was rehabbed in 2008. Located in an enjoyable neighborhood, and minutes from local attractions, public transportation, trails and public park. Ideal for commuters with a Metra station nearby. Easy acce
Key facts
- Open floor plan
- Brand new microwave
- Hardwood floors
Tags
Property features AI
Finance
- Other: Building contains 10 units; Living area source: appraiser; Directions: North on IL 83, west on IL 64, south on Ardmore, right on Division, right on Princeton to property
- HOA & community: Monthly association fee of $375; Association fee includes heat, water, gas, exterior maintenance, lawn care, and snow removal; Pets allowed with a size limit (max pet weight 20 lbs)
Exterior
- Parking: 1 parking space
- Utilities: Public water; Public sewer; Electric with circuit breakers
- Home design: Attached single (condo); Condo ownership; Entry at level 1; Built 61–70 years ago (built before 1978); Rehab completed in 2008
- Construction: Brick construction; Asphalt roof; Approximately 660 total finished square feet
- Exterior features: Common lot/grounds; School bus service; Commuter train access
Interior
- Kitchen: Range; Microwave; Dishwasher; Refrigerator
- Bedrooms: Master bedroom (main level); Two additional bedrooms (one listed as 'Bedroom 2' on main level; other bedrooms present)
- Flooring: Hardwood
- Bathrooms: 1 full bathroom
- Heating & cooling: Natural gas heating; Cooling: Other
- Interior features: Hardwood floors; 4 total rooms; Living room; Family room; Dining room; Laundry room
- Laundry & utility: Laundry room
Neighborhood map
What this means for you Summary
Snapshot
- This is a 2-bed/1.0-bath condo listed at $145k.
Deal economics
- At list price, monthly cash flow is $-56 ($-672/yr) — negative.
- To cash-flow at today's rent, offer at most $135k (6.8% below list).
- Meets the 1% rule at list price ($2k rent vs $145k).
- Recommended offer: $135k (6.8% below list) — sets the bar for cash-flow.
- Cap rate 5.8% vs local median 4.2% in Villa Park — top-decile yield for the area; either an underpriced asset or a hidden risk that comps aren't pricing in. Stress-test before assuming the spread holds.
Location & tenants
- Location reads 75/100 on livability (#221 in IL, #4,121 nationally) — a middle-class / working-renter tenant base. Strengths: employment A+, housing A+, crime B+; Watch: schools C-, health & safety C-, amenities F.
- Dupage Hsd 88 (suburban): math 29% / reading 35% proficiency, ranked #212 of 620 in IL (top 34%) — families likely to look elsewhere, expect single-tenant / working-renter base with shorter leases.
- Market conditions: Rents rising fast (+4.0%/yr); 41 active listings in the ZIP; 13 comparable units currently listed for rent nearby; rentals leasing fast (median 11d on market — plan ~1-2 weeks tenant-placement turnaround); solid renter incomes; 1,378 units permitted in DuPage County in 2024 (594 in 5+ unit buildings).
Forward outlook
- Local home prices are declining (-3.0%/yr); year-one equity from $1k of loan paydown is wiped out by about $4k of value loss. Plan a longer hold.
Negotiation context
- It's been on market 44 days — a 3% lower offer ($141k) is reasonable based on typical stale-listing flexibility.
- Current owner paid $82k; list at $145k implies a 76% gain — meaningful room to come down on a strong offer.
Risks & watch-outs
- Watch-outs: HOA is 22% of rent.
Questions for the listing agent
- What do current leases actually rent for vs. the listed asking? Can we see a recent rent roll and the last 12 months of T-12 income?
- It's been on market 44 days. Have you received any prior offers? Is the seller open to a 7% concession, seller financing, or rate buy-down credit?
- Built in 1962 — when were the roof, HVAC, electrical panel, plumbing, and water heater last replaced?
- What does the HOA fee cover, when was the last increase, and are there any pending special assessments or reserve-fund shortfalls?
- Any open or pending special assessments — roof, HVAC, plumbing, elevator, façade? What's the per-unit balance and payoff schedule, and is the seller paying it off at close or rolling it to the buyer?
- Is there a deadline driving the sale (1031 exchange, divorce, estate, relocation)? That informs how much negotiation room exists.
- The area grade is low — what's the realistic commute time and amenity access for the typical tenant pool here? Any planned neighborhood developments (good or bad) we should know about?
- What's the average days-on-market for RENTAL listings here right now (not sales)? A rising rental-DOM trend means longer vacancies and softer asking-rent achievability than the comps imply.
- What's the recent tenant-quality profile in this submarket — average credit score on applications, eviction rate, late-payment / NSF rate, and stable-employment percentage? A property-management company in the area should have these aggregated.
- How much new apartment / multifamily construction is in the pipeline within 1–3 miles? Heavy new supply (>2% of stock underway) typically softens rents 12–24 months out; light construction supports rent growth.
Investment metrics
- 1% rule
- 1.19% ✓
- Cap rate
- 5.83%
- Cash-on-cash
- -1.66%
- DSCR
- 0.93
- GRM
- 7.0
CMA / ARV
No comps found within radius.
Projected returns pro-forma
-3.0% appreciation · 4.01% rent growth · sell at horizon
- IRR
- -17.2%
- Equity multiple
- 0.38×
- Total profit
- $-24,996
- Equity at exit
- $21,605
- IRR
- -6.4%
- Equity multiple
- 0.56×
- Total profit
- $-17,805
- Equity at exit
- $12,528
Cash invested: $40,572 (down + closing). Projections, not guarantees.
Landlord ↔ Tenant lean methodology
- Overall (STATE)
- 43 Moderately Tenant-Leaning
- State Illinois
- 43 Moderately Tenant-Leaning · D+7
- County
- — inherits STATE
- City
- — inherits STATE
ZIP-level market 60181
- Rents YoY
- 4.0%
- Active inventory
- 41
- Price-to-rent
- 7.0×
Monthly cashflow live
- Estimated rent
- $1,723 high interval (Pro) →
- Mortgage (P&I)
- −$760
- Tax from tax record
- −$222 /mo · $2,668/yr
- Insurance
- −$60
- HOA
- −$375
- Vacancy / Maint / Mgmt
- −$362
- Net cashflow
- $-56
Break-even live
UW: 25.0% down · 7.5% · 30yr · 1.5% tax · 5.0% vac · 8.0% maint · 8.0% mgmt
Financing live
Cash to close
- Down payment
- $36,225
- Closing costs
- $4,347
- Reserves months
- —
- Total cash needed
- —
Loan-product check · same deal, 3 products live
Conventional
25% down · 7.5% · 30yr
- Down + closing
- —
- Monthly P&I
- —
- Monthly cashflow
- —
- DSCR
- —
- Eligible?
- —
Personal DTI + credit; lowest rate.
DSCR
20% down · 8.5% · 30yr
- Down + closing
- —
- Monthly P&I
- —
- Monthly cashflow
- —
- DSCR
- —
- Eligible?
- —
No personal income docs; deal must DSCR.
Hard money
10% down · 12.0% · 12mo
- Down + closing
- —
- Monthly P&I
- —
- Monthly cashflow
- —
- DSCR
- —
- Eligible?
- —
Short-term bridge; refi at stabilization.
Rent comps 13 comps
| Address | Beds | Baths | Sqft | Rent | $/sqft | DOM | Units | Dist |
|---|---|---|---|---|---|---|---|---|
| 335 N Yale Ave Villa Park, IL | 2.0 | 1.0 | 700 | $1,595 | $2.28 | 18d | 1 | 0.10mi |
| 26 N Ardmore Ave Villa Park, IL | 1.0 | 1.0 | 580 | $1,395 | $2.41 | 3d | 2 | 0.36mi |
| 239 E Maple Ave Unit 2 Villa Park, IL | 2.0 | 1.0 | 744 | $1,875 | $2.52 | 18d | 1 | 0.42mi |
| 27 E Park Blvd Apt 3 Villa Park, IL | 1.0 | 1.0 | 600 | $1,300 | $2.17 | 24d | 1 | 0.88mi |
| 912 E Saint Charles Rd Unit 1026694P Lombard, IL | 1.0 | 1.0 | 548 | $3,337 | $6.09 | 7d | 1 | 0.88mi |
| 6 S Monterey Ave Unit E Villa Park, IL | 1.0 | 1.0 | 700 | $1,950 | $2.79 | 24d | 1 | 0.89mi |
| 1 Ovaltine Ct Villa Park, IL | 1.0–2.0 | 1.0–2.0 | 1115 | $2,905 | $2.60 | 1d | 39 | 0.91mi |
| 1026 E Division St Unit B Lombard, IL | 1.0 | 1.0 | 600 | $1,450 | $2.42 | 24d | 1 | 1.17mi |
| 108 Fellows Ct Elmhurst, IL | 1.0 | 1.0 | 650 | $1,529 | $2.35 | 18d | 1 | 1.23mi |
| 108 Fellows Ct Elmhurst, IL | 1.0 | 1.0 | 650 | $1,458 | $2.24 | 2d | 1 | 1.23mi |
| 108 Fellows Ct Elmhurst, IL | 1.0 | 1.0 | 650 | $1,481 | $2.28 | 10d | 1 | 1.23mi |
| 100 Fellows Ct Elmhurst, IL | 2.0 | 1.0 | 585 | $1,728 | $2.95 | 1d | 20 | 1.31mi |
| 740 E North Broadway St Lombard, IL | 1.0 | 1.0 | 650 | $1,575 | $2.42 | 4d | 1 | 1.33mi |
HOA detail condo
- Monthly dues
- $375 · $4,500/yr
- Likely covers
- electric
- Assessments
- None detected in remarks — confirm with the listing agent.
Listing history 16 events
-
2026-06-18days on market $144,900 Active 44 DOM
-
2026-06-17days on market $144,900 Active 43 DOM
-
2026-06-16days on market $144,900 Active 42 DOM
-
2026-06-15pricedays on market $144,900 Active 41 DOM
-
2026-06-13days on market $149,900 Active 39 DOM
-
2026-06-09days on market $149,900 Active 35 DOM
-
2026-06-08days on market $149,900 Active 34 DOM
-
2026-06-07days on market $149,900 Active 33 DOM
-
2026-06-04days on market $149,900 Active 30 DOM
-
2026-06-03days on market $149,900 Active 29 DOM
-
2026-06-02days on market $149,900 Active 28 DOM
-
2026-06-01days on market $149,900 Active 27 DOM
-
2026-05-31days on market $149,900 Active 26 DOM
-
2026-05-20price $149,900
-
2026-05-05$155,000 Active
-
2010-05-19soldstatus $82,500
ⓘ Source: listings_history table (triggers on properties + properties_extension) + one-shot
backfill from property_details.listing_events for pre-trigger history.
Tax reassessment forecast IL · Partial reset (capped growth)
- Current annual tax
- $2,668 · $222/mo
- Projected year-2 tax
- $2,979 · $248/mo
- Expected delta
- +$311/yr (+$26/mo · 11.6%)
ⓘ Screening estimate from a state-policy table — verify with the county assessor before closing.
Climate risk First Street
- Flood 4/10 Moderate FEMA zone X (unshaded) · 22% chance over 30 yrs
- Wildfire 1/10 Low
- Heat 3/10 Moderate 7 d/yr ≥102°F today · 14 d/yr by 30 yrs out
- Wind 2/10 Low
- Air quality 4/10 Moderate 4 unhealthy d/yr today · 5 by 30 yrs out
Nearby sold comps map
Loading sold comps map…
Walkable amenities ~0.75 mi
Loading nearby amenities…
Taxation est. · year 1
- Rental income
- $20,682
- − Mortgage interest
- −$8,117
- − Property taxes
- −$2,668
- − Insurance
- −$724
- − Repairs & maintenance
- −$1,655
- − Management
- −$1,655
- − HOA
- −$4,500
- − Depreciation
- −$4,215
- Taxable loss
- −$2,851
- Est. tax savings @ 24.0%
- +$684
- After-tax cash flow
- $12/yr
For passive investors: Depreciation is non-cash, so a rental often shows a tax loss while cash-flowing — sheltering income. Rental losses are passive: they offset passive income freely, and up to $25,000/yr can offset ordinary (W-2) income if you actively participate and your MAGI is under $100k (phasing out to $0 by $150k); unused losses carry forward. On sale, claimed depreciation is recaptured at up to 25%, and gains may owe capital-gains tax (a 1031 exchange can defer both). Figures are a year-1 estimate at your 24.0% rate — not tax advice; consult a CPA.
Schools (NCES district)
- District
- Dupage Hsd 88
- NCES district ID
- 1713940
- Math proficiency
- 29% ▼ -1.00%
- Reading proficiency
- 35% ▲ 3.00%
- Median HH income
- $64,846
- Composite
- 29.26/100
- National rank
- #6561
- State rank
- #212 of 620 in IL
Livability — Villa Park
- Score
- 75/100
- State rank
- #221
- US rank
- #4121
Category grades
Schools grade is shown separately in the Schools card above.
Census & demographics
- Census place
- Villa Park, IL
- County
- DuPage County · 904,569 people
- City population
- 30,346
- Metro
- Chicago-Naperville-Elgin, IL-IN-WI
- Population (ZIP)
- 30,346
- Household income
- $92,142
- Rent vs Own
- Severe rent burden
- 508.0
Population outlook (DuPage County) Hauer SSP2
- Today (2025)
- 960,187 people
- By 2030
- 965,850 · +0.6%
- By 2040
- 965,812 · +0.6%
- By 2050
- 954,890 · -0.6%
- By 2075
- 910,185 · -5.2%
- By 2100
- 816,255 · -15.0%
Race, ethnicity, and origin ACS 2023
- Neighborhood character
- Diverse neighborhood (Simpson 0.58)
- Race & ethnicity
- White 59% Hispanic / Latino 25% Two or more races 14% Black 6% Asian 5%
- Hispanic origin (detail)
- Mexican 18% Puerto Rican 2%
- Common ancestry
- Romanian 7% Italian 3% Iranian 3%
- Foreign-born
- 17% · Canada, Jamaica
- Languages at home
- 71% English-only · Spanish 18% Other Indo-European 5% Russian/Polish/Slavic 2%
Political lean MEDSL · DuPage
- 2024 margin
- D (+13.3) · D 55.9% · R 42.5% · Other 1.6%
- 2008→2024 swing
- +2.5pp toward D · 2008: 10.8pp · 2024: 13.3pp
- All cycles
- 2024: D+13.3 2020: D+18.1 2016: D+14.1 2012: D+1.0 2008: D+10.8
Not yet ingested
- Civics
- —
Market trends
- HPI YoY
- ▼ -253.13%
- Current HPI
- 220.1057
- Rent YoY
- ▲ 4.01%
- Metro
- Chicago-Naperville-Elgin, IL-IN-WI
- State GDP YoY
- ▲ 1.59%
- F500 in state
- 60
Industry mix (Fortune 500 HQ in IL)
| Industry | F500 HQs | Revenue |
|---|---|---|
| Insurance | 4 | $201B |
|
||
| Consumer Goods | 4 | $87B |
|
||
| Industrial Machinery | 3 | $64B |
|
||
| Healthcare | 2 | $55B |
|
||
| Retail / Pharmacy | 1 | $148B |
|
||
| Agriculture / Food | 1 | $86B |
|
||
Price history
+81.7% since first listed3 events — show timeline
- 2026-05-20 Price Changed $149,900 MRED as Distributed by MLS Grid
- 2026-05-05 Listed $155,000 MRED as Distributed by MLS Grid
- 2010-05-19 Sold (Public Records) $82,500 Public Records
Property tax history
+4.0%/yrLatest (2024): $2,668 · +4.4% YoY. Source: county tax records.
Cash-flow waterfall
monthlySold comps — $/sqft
last 12 mo · ≤1 miLoading sold comps…