12952 Sawmill Rd · Marklesburg, PA
Flood risk 1/10 · Minimal
- FEMA flood zone
- X (unshaded)
- Chance of flooding over 30 yrs
- 0.0%
- Est. flood insurance / yr
- $473 – $860
Fire risk 2/10 · Minimal
- Est. fire insurance / yr
- $511 – $949
Heat risk 3/10 · Minor
- Hot days now (above 98°F)
- 7 days/yr
- Hot days in 30 yrs
- 16 days/yr
Wind risk 2/10 · Minimal
- Chance of severe wind over 30 yrs
- —
Air-quality risk 2/10 · Minimal
- Unhealthy air days now
- 1 days/yr
- Unhealthy air days in 30 yrs
- 2 days/yr
Risk factors via First Street. Map © Google.
Why this score? — see what drove the F grade
The composite is a weighted blend of 9 inputs, each scored 0–100. Each bar is that input's sub-score; the figure is the points it added to the 100-point composite (weight × sub-score).
- ARV discount +7.5/15.0
- Appreciation +6.5/10.0
- Cash flow +5.9/30.0
- Schools +3.3/10.0
- Livability +3.2/5.0
- Rent growth +2.5/5.0
- Condition / age +2.5/5.0
- 1% rule +1.3/10.0
- DSCR +0.3/10.0
$100,000
🖨 Deal sheet (PDF) 📄 Offer letter ✓ Due diligence
Listing remarks
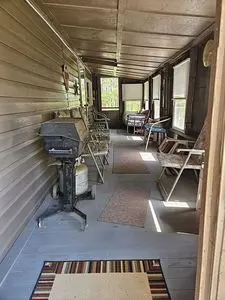
This is a camp on 1.42 acres in a quiet country setting 10 minutes from Seven Points Raystown Lake. Great location, not in a development where you have HOA fees or regulations of what you can or cannot do to your property. It has electric but does not have a well or septic. This has been family owned for 42 years and was used for hunting and weekend get aways. The buyer can put a well and septic in if they choose.
Key facts
- Not in a development
- No hoa fees
- Built 1950
Tags
Neighborhood map
What this means for you Summary
Snapshot
- This is a 2-bed/?-bath manufactured listed at $100k.
Deal economics
- At list price, monthly cash flow is $-196 ($-2k/yr) — negative.
- To cash-flow at today's rent, offer at most $72k (28.4% below list).
- To meet the 1% rule (rent ≥ 1% of price), the offer needs to be $63k (37.4% below list).
- Recommended offer: $63k (37.4% below list) — sets the bar for 1% rule.
Location & tenants
- Location reads 63/100 on livability (#1,274 in PA) — a middle-class / working-renter tenant base. Strengths: cost of living A+, housing A+; Watch: employment D+, amenities F, commute F.
- Huntingdon Area SD (town): math 32% / reading 47% proficiency, ranked #366 of 539 in PA (top 68%) — families likely to look elsewhere, expect single-tenant / working-renter base with shorter leases.
- Zoned schools: Southside El Sch (math 47% / reading 57%, grade C-, #586 of 1,518 statewide, top 42%, 328 students, 46% FRL); Huntingdon Area Ms (math 23% / reading 43%, grade F, #346 of 512 statewide, top 69%, 385 students, 50% FRL); Huntingdon Area Shs (math 62%, 539 students, 32% FRL) — zoned schools at 43% FRL track the district average.
- Market conditions: 12 active listings in the ZIP; 70 units permitted in Huntingdon County in 2024 (0 in 5+ unit buildings).
Forward outlook
- In year one you build about $4k of equity ($691 loan paydown + $3k appreciation (3.1% local appreciation)).
- Huntingdon County population projected at -14% by 2050 — secular population decline; favor cash flow + early exit over multi-decade hold.
- By year 9, paydown + projected appreciation supports a ~$32k cash-out refi (75% LTV) — recoverable capital for the next deal without selling this one.
Negotiation context
- It's been on market 26 days — a 2% lower offer ($98k) is reasonable based on typical stale-listing flexibility.
Risks & watch-outs
- Watch-outs: built in 1950 — expect roof / HVAC / electrical / plumbing capex.
Questions for the listing agent
- What do current leases actually rent for vs. the listed asking? Can we see a recent rent roll and the last 12 months of T-12 income?
- Built in 1950 — when were the roof, HVAC, electrical panel, plumbing, and water heater last replaced?
- Is there a deadline driving the sale (1031 exchange, divorce, estate, relocation)? That informs how much negotiation room exists.
- Schools are D-rated, which usually means shorter tenancies and higher turnover. Who's the typical renter profile here, and what's been the actual vacancy rate?
- The area grade is low — what's the realistic commute time and amenity access for the typical tenant pool here? Any planned neighborhood developments (good or bad) we should know about?
- What's the average days-on-market for RENTAL listings here right now (not sales)? A rising rental-DOM trend means longer vacancies and softer asking-rent achievability than the comps imply.
- What's the recent tenant-quality profile in this submarket — average credit score on applications, eviction rate, late-payment / NSF rate, and stable-employment percentage? A property-management company in the area should have these aggregated.
- How much new for-sale + rental construction is in the pipeline within 1–3 miles? Heavy new supply typically softens prices + rents 12–24 months out; constrained supply supports both.
Investment metrics
- 1% rule
- 0.63% ✗
- Cap rate
- 3.94%
- Cash-on-cash
- -8.41%
- DSCR
- 0.63
- GRM
- 13.3
CMA / ARV
No comps found within radius.
Projected returns pro-forma
3.08% appreciation · 3.0% rent growth · sell at horizon
- IRR
- -0.0%
- Equity multiple
- 1.00×
- Total profit
- $-26
- Equity at exit
- $45,402
- IRR
- 3.9%
- Equity multiple
- 1.60×
- Total profit
- $16,936
- Equity at exit
- $70,311
Cash invested: $28,000 (down + closing). Projections, not guarantees.
Landlord ↔ Tenant lean methodology
- Overall (STATE)
- 62 Landlord-Friendly
- State Pennsylvania
- 62 Landlord-Friendly · EVEN
- County
- — inherits STATE
- City
- — inherits STATE
ZIP-level market 16647
- Home prices YoY
- 3.0%
- Active inventory
- 12
- Price-to-rent
- 13.3×
Monthly cashflow live
- Estimated rent
- $626 medium interval (Pro) →
- Mortgage (P&I)
- −$524
- Tax est. 1.5%
- −$125 /mo · $1,500/yr
- Insurance
- −$42
- HOA
- −$0
- Lot rent leased land?
- −$0
- Vacancy / Maint / Mgmt
- −$132
- Net cashflow
- $-196
Break-even live
Sensitivity live
| Price | -10% $-127 | -5% $-162 | +0% $-196 | +5% $-231 | +10% $-265 |
|---|---|---|---|---|---|
| Rent | -10% $-246 | -5% $-221 | +0% $-196 | +5% $-171 | +10% $-147 |
| Rate | -1.0pp $-146 | -0.5pp $-171 | base $-196 | +0.5pp $-222 | +1.0pp $-248 |
UW: 25.0% down · 7.5% · 30yr · 1.5% tax · 5.0% vac · 8.0% maint · 8.0% mgmt
Financing live
Cash to close
- Down payment
- $25,000
- Closing costs
- $3,000
- Reserves months
- —
- Total cash needed
- —
Loan-product check · same deal, 3 products live
Conventional
25% down · 7.5% · 30yr
- Down + closing
- —
- Monthly P&I
- —
- Monthly cashflow
- —
- DSCR
- —
- Eligible?
- —
Personal DTI + credit; lowest rate.
DSCR
20% down · 8.5% · 30yr
- Down + closing
- —
- Monthly P&I
- —
- Monthly cashflow
- —
- DSCR
- —
- Eligible?
- —
No personal income docs; deal must DSCR.
Hard money
10% down · 12.0% · 12mo
- Down + closing
- —
- Monthly P&I
- —
- Monthly cashflow
- —
- DSCR
- —
- Eligible?
- —
Short-term bridge; refi at stabilization.
Listing history 18 events
-
2026-06-23days on market $100,000 Active 26 DOM
-
2026-06-22days on market $100,000 Active 25 DOM
-
2026-06-19days on market $100,000 Active 23 DOM
-
2026-06-18days on market $100,000 Active 22 DOM
-
2026-06-17days on market $100,000 Active 21 DOM
-
2026-06-16days on market $100,000 Active 20 DOM
-
2026-06-15days on market $100,000 Active 19 DOM
-
2026-06-14days on market $100,000 Active 17 DOM
-
2026-06-13days on market $100,000 Active 16 DOM
-
2026-06-10days on market $100,000 Active 14 DOM
-
2026-06-09days on market $100,000 Active 13 DOM
-
2026-06-08days on market $100,000 Active 12 DOM
-
2026-06-07days on market $100,000 Active 11 DOM
-
2026-06-02days on market $100,000 Active 6 DOM
-
2026-06-01days on market $100,000 Active 5 DOM
-
2026-05-31days on market $100,000 Active 4 DOM
-
2026-05-30days on market $100,000 Active 3 DOM
-
2026-05-28$100,000 Active
ⓘ Source: listings_history table (triggers on properties + properties_extension) + one-shot
backfill from property_details.listing_events for pre-trigger history.
Climate risk First Street
- Flood 1/10 Low FEMA zone X (unshaded) · 0% chance over 30 yrs
- Wildfire 2/10 Low
- Heat 3/10 Moderate 7 d/yr ≥98°F today · 16 d/yr by 30 yrs out
- Wind 2/10 Low
- Air quality 2/10 Low 1 unhealthy d/yr today · 2 by 30 yrs out
Nearby sold comps map
Loading sold comps map…
Walkable amenities ~0.75 mi
Loading nearby amenities…
Taxation est. · year 1
- Rental income
- $7,518
- − Mortgage interest
- −$5,602
- − Property taxes
- −$1,500
- − Insurance
- −$500
- − Repairs & maintenance
- −$601
- − Management
- −$601
- − Depreciation
- −$2,909
- Taxable loss
- −$4,196
- Est. tax savings @ 24.0%
- +$1,007
- After-tax cash flow
- $-1,347/yr
For passive investors: Depreciation is non-cash, so a rental often shows a tax loss while cash-flowing — sheltering income. Rental losses are passive: they offset passive income freely, and up to $25,000/yr can offset ordinary (W-2) income if you actively participate and your MAGI is under $100k (phasing out to $0 by $150k); unused losses carry forward. On sale, claimed depreciation is recaptured at up to 25%, and gains may owe capital-gains tax (a 1031 exchange can defer both). Figures are a year-1 estimate at your 24.0% rate — not tax advice; consult a CPA.
Schools (NCES district)
- District
- Huntingdon Area SD
- NCES district ID
- 4212090
- Math proficiency
- 32% ▲ 1.00%
- Reading proficiency
- 47% ▼ -4.00%
- Median HH income
- $43,534
- Composite
- 33.4/100
- National rank
- #5478
- State rank
- #366 of 539 in PA
Livability — Marklesburg
- Score
- 63/100
- State rank
- #1274
- US rank
- #15389
Category grades
Schools grade is shown separately in the Schools card above.
Census & demographics
- Population (ZIP)
- 836
Population outlook (Huntingdon County) Hauer SSP2
- Today (2025)
- 44,212 people
- By 2030
- 43,057 · -2.6%
- By 2040
- 40,537 · -8.3%
- By 2050
- 37,844 · -14.4%
- By 2075
- 31,411 · -29.0%
- By 2100
- 23,907 · -45.9%
Race, ethnicity, and origin ACS 2023
- Neighborhood character
- Predominantly White (97%)
- Race & ethnicity
- White 97% Hispanic / Latino 1%
- Common ancestry
- Romanian 2% Lithuanian 2% Iranian 1%
- Foreign-born
- 0% · Canada
- Languages at home
- 99% English-only · Spanish 1%
Political lean MEDSL · Huntingdon
- 2024 margin
- Solid R (+52.9) · D 23.2% · R 76.1%
- 2008→2024 swing
- -25.4pp toward R · 2008: -27.5pp · 2024: -52.9pp
- All cycles
- 2024: R+52.9 2020: R+51.0 2016: R+50.7 2012: R+37.4 2008: R+27.5
Not yet ingested
- Civics
- —
Market trends
- HPI YoY
- ▲ 3.08%
- Current HPI
- 104.4927
- Rent YoY
- —
- Metro
- —
- State GDP YoY
- ▲ 1.68%
- F500 in state
- 34
Industry mix (Fortune 500 HQ in PA)
| Industry | F500 HQs | Revenue |
|---|---|---|
| Healthcare | 2 | $309B |
|
||
| Insurance | 2 | $27B |
|
||
| Telecommunications / Media | 1 | $124B |
|
||
| Industrial Distribution | 1 | $22B |
|
||
| Financial Services | 1 | $20B |
|
||
| Chemicals / Materials | 1 | $18B |
|
||
Price history
1 event — show timeline
- 2026-05-28 Listed $100,000 FSBO.com
Property tax history
+3.6%/yrLatest (2026): $187 · +3.2% YoY. Source: county tax records.
Cash-flow waterfall
monthlySold comps — $/sqft
last 12 mo · ≤1 miLoading sold comps…