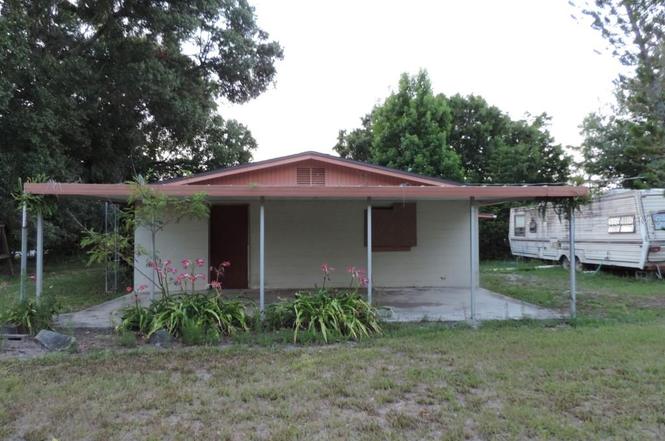
5418 Wilson Dr · Cleveland, FL
Flood risk 8/10 · Major
- FEMA flood zone
- X (shaded)
- Chance of flooding over 30 yrs
- 0.98%
- Est. flood insurance / yr
- $507 – $1,088
Fire risk 3/10 · Minor
- Est. fire insurance / yr
- $947 – $1,759
Heat risk 10/10 · Severe
- Hot days now (above 108°F)
- 7 days/yr
- Hot days in 30 yrs
- 28 days/yr
Wind risk 10/10 · Severe
- Chance of severe wind over 30 yrs
- 99.0%
Air-quality risk 2/10 · Minimal
- Unhealthy air days now
- 2 days/yr
- Unhealthy air days in 30 yrs
- 2 days/yr
Risk factors via First Street. Map © Google.
Why this score? — see what drove the C+ grade
The composite is a weighted blend of 9 inputs, each scored 0–100. Each bar is that input's sub-score; the figure is the points it added to the 100-point composite (weight × sub-score).
- Cash flow +23.6/30.0
- DSCR +7.6/10.0
- ARV discount +7.5/15.0
- 1% rule +7.2/10.0
- Schools +4.6/10.0
- Rent growth +3.5/5.0
- Livability +3.4/5.0
- Condition / age +2.5/5.0
- Appreciation +2.4/10.0
$159,500
🖨 Deal sheet 📄 Offer letter ✓ Due diligence
Listing remarks
This charming Punta Gorda property sits on an oversized, private lot and offers exceptional versatility, featuring a freshly painted interior with newer flooring, updated A/C units, and a beautifully renovated kitchen with wood cabinets. The spacious setting provides an abundance of privacy, and as an added bonus, a 2-bedroom 1 bathroom living room and kitchen mobile home is included—perfect for guests, extended family, or potential additional income. With its unique combination of space, updates, and flexibility, this property presents endless opportunities. Make an appointment to see it today!
Key facts
- Newer flooring
- Updated a c units
- Renovated kitchen
Tags
Property features AI
Finance
- Other: Zoned MHC (manufactured/home community); Total living area reported as 1,745; Total building area reported as 2,083; Lot described as 1/4 to less than 1/2 acre
- HOA & community: No HOA/association indicated
Exterior
- Parking: Carport (1 space)
- Utilities: Well water; Septic tank; Cable available
- Home design: Single-family residence; One story; Northeast-facing entry; Residential property
- Construction: Block construction; Metal roof; Slab foundation; Built on a 0.34-acre lot (approximately 180 x 125)
- Exterior features: Other exterior features
Interior
- Kitchen: Range; Refrigerator
- Bedrooms: 3 bedrooms
- Flooring: Terrazzo; Vinyl
- Bathrooms: 1 full bathroom
- Heating & cooling: Electric heating; Mini-split cooling units; Wall/window cooling units
- Interior features: Living room and dining room combined
- Laundry & utility: Dedicated laundry room
Neighborhood map
What this means for you Summary
Snapshot
- This is a 2-bed/1.0-bath other listed at $160k.
Deal economics
- At list price, monthly cash flow is $233 ($3k/yr) — positive.
- The deal already cash-flows at list — no discount required.
- Meets the 1% rule at list price ($2k rent vs $160k).
- Recommended offer: $140k (12.0% below list) — sets the bar for market timing.
- Cap rate 8.5% vs local median 4.8% in Cleveland — top-decile yield for the area; either an underpriced asset or a hidden risk that comps aren't pricing in. Stress-test before assuming the spread holds.
Location & tenants
- Location reads 67/100 on livability (#574 in FL) — a middle-class / working-renter tenant base. Strengths: crime A+, cost of living A+, housing A+; Watch: employment D, schools F, amenities F.
- Charlotte (suburban): math 54% / reading 54% proficiency, ranked #22 of 73 in FL (top 30%) — acceptable for families but not a draw, mixed tenant base, ~2y average lease.
- Market conditions: Rents rising fast (+4.1%/yr); 1037 active listings in the ZIP; 2 comparable units currently listed for rent nearby; 4,585 units permitted in Charlotte County in 2024 (703 in 5+ unit buildings).
- This rent runs 32% of the median local income ($72k/yr) — at the standard rent-burdened threshold; future hikes will face affordability resistance.
Forward outlook
- Local home prices are declining (-3.0%/yr); year-one equity from $1k of loan paydown is wiped out by about $5k of value loss. Plan a longer hold.
- Charlotte County population projected at +24% by 2050 — long-run rental-demand tailwind backs the buy-and-hold thesis.
Negotiation context
- It's been on market 131 days — a 12% lower offer ($140k) is reasonable based on typical stale-listing flexibility.
- 8 sale attempts since 12y ago; this cycle's ask has dropped $100k (39%) from the opening price — seller is motivated, your offer sets the floor, not the list.
- Current owner paid $22k; list at $160k implies a 625% gain — meaningful room to come down on a strong offer.
Risks & watch-outs
- Watch-outs: flood insurance adds $66/mo.
- Climate carrying-cost: severe flood risk; severe wind risk, 99% chance of damaging wind over 30y; extreme-heat days projected 7→28/yr by 2055 (HVAC capex compounding) — expect insurance premiums to compound above CPI over the hold.
Questions for the listing agent
- It's been on market 131 days. Have you received any prior offers? Is the seller open to a 12% concession, seller financing, or rate buy-down credit?
- Built in 1964 — when were the roof, HVAC, electrical panel, plumbing, and water heater last replaced?
- What's the actual annual flood-insurance premium (NFIP or private), and is the property in a SFHA with mandatory coverage?
- Why hasn't it sold? Are there any deal-killer items the seller is aware of (foundation, flood, title, zoning, code violations)?
- Is there a deadline driving the sale (1031 exchange, divorce, estate, relocation)? That informs how much negotiation room exists.
- Schools are F-rated, which usually means shorter tenancies and higher turnover. Who's the typical renter profile here, and what's been the actual vacancy rate?
- What's the average days-on-market for RENTAL listings here right now (not sales)? A rising rental-DOM trend means longer vacancies and softer asking-rent achievability than the comps imply.
- What's the recent tenant-quality profile in this submarket — average credit score on applications, eviction rate, late-payment / NSF rate, and stable-employment percentage? A property-management company in the area should have these aggregated.
- How much new for-sale + rental construction is in the pipeline within 1–3 miles? Heavy new supply typically softens prices + rents 12–24 months out; constrained supply supports both.
Investment metrics
- 1% rule
- 1.22% ✓
- Cap rate
- 8.55%
- Cash-on-cash
- 8.05%
- DSCR
- 1.36
- GRM
- 6.9
CMA / ARV
No comps found within radius.
Projected returns pro-forma
-3.0% appreciation · 4.13% rent growth · sell at horizon
- IRR
- -5.1%
- Equity multiple
- 0.81×
- Total profit
- $-8,612
- Equity at exit
- $23,782
- IRR
- 6.1%
- Equity multiple
- 1.48×
- Total profit
- $21,604
- Equity at exit
- $13,791
Cash invested: $44,660 (down + closing). Projections, not guarantees.
Landlord ↔ Tenant lean methodology
- Overall (STATE)
- 87 Strongly Landlord-Friendly
- State Florida
- 87 Strongly Landlord-Friendly · R+3
- County
- — inherits STATE
- City
- — inherits STATE
ZIP-level market 33982
- Home prices YoY
- -1.2%
- Rents YoY
- 4.1%
- Active inventory
- 1037
- Price-to-rent
- 6.9×
Monthly cashflow live
- Estimated rent
- $1,940 medium interval (Pro) →
- Mortgage (P&I)
- −$836
- Tax from tax record
- −$330 /mo · $3,961/yr
- Insurance
- −$66
- Flood insurance flood zone
- −$66 /mo · $798/yr
- HOA
- −$0
- Vacancy / Maint / Mgmt
- −$407
- Net cashflow
- $233
Break-even live
UW: 25.0% down · 7.5% · 30yr · 1.5% tax · 5.0% vac · 8.0% maint · 8.0% mgmt
Financing live
Cash to close
- Down payment
- $39,875
- Closing costs
- $4,785
- Reserves months
- —
- Total cash needed
- —
Loan-product check · same deal, 3 products live
Conventional
25% down · 7.5% · 30yr
- Down + closing
- —
- Monthly P&I
- —
- Monthly cashflow
- —
- DSCR
- —
- Eligible?
- —
Personal DTI + credit; lowest rate.
DSCR
20% down · 8.5% · 30yr
- Down + closing
- —
- Monthly P&I
- —
- Monthly cashflow
- —
- DSCR
- —
- Eligible?
- —
No personal income docs; deal must DSCR.
Hard money
10% down · 12.0% · 12mo
- Down + closing
- —
- Monthly P&I
- —
- Monthly cashflow
- —
- DSCR
- —
- Eligible?
- —
Short-term bridge; refi at stabilization.
Rent comps 2 comps
| Address | Beds | Baths | Sqft | Rent | $/sqft | DOM | Units | Dist |
|---|---|---|---|---|---|---|---|---|
| 3615 Dawson Ln Punta Gorda, FL | 2.0 | 2.0 | 1014 | $1,450 | $1.43 | 21d | 1 | 0.95mi |
| 3111 Riverside Dr Unit A Punta Gorda, FL | 2.0 | 2.0 | 1112 | $1,595 | $1.43 | 13d | 1 | 1.28mi |
Listing history 29 events
-
2026-06-05days on market $159,500 Active 131 DOM
-
2026-06-03days on market $159,500 Active 130 DOM
-
2026-06-02days on market $159,500 Active 129 DOM
-
2026-06-01days on market $159,500 Active 128 DOM
-
2026-05-31days on market $159,500 Active 127 DOM
-
2026-05-30days on market $159,500 Active 126 DOM
-
2026-04-23price $159,500
-
2026-04-23status Active
-
2026-04-06status Pending
-
2026-03-23price $160,000
-
2026-03-21status Active
-
2026-03-07status Pending
-
2026-03-02price $215,000
-
2026-01-22price $220,000
-
2026-01-20status Active
-
2026-01-08status Pending
-
2025-12-12$259,900 Active
-
2024-07-31historical
-
2024-07-31historical
-
2024-05-01$265,000 Active
-
2024-01-18$265,000 Active
-
2024-01-11historical
-
2023-12-26price $270,000
-
2023-08-31price $280,000
-
2023-07-14$300,000 Active
-
2014-08-18soldstatus $22,000
-
2014-08-14soldstatus $22,000 Sold
-
2014-07-11status Pending
-
2014-07-03$22,000 Active
ⓘ Source: listings_history table (triggers on properties + properties_extension) + one-shot
backfill from property_details.listing_events for pre-trigger history.
Tax reassessment forecast FL · Resets to sale price
- Current annual tax
- $3,961 · $330/mo
- Projected year-2 tax
- $3,961 · $330/mo
- Expected delta
- $0/yr ($0/mo · 0.0%)
ⓘ Screening estimate from a state-policy table — verify with the county assessor before closing.
Climate risk First Street
- Flood 8/10 Severe FEMA zone X (shaded) · 98% chance over 30 yrs
- Wildfire 3/10 Moderate
- Heat 10/10 Extreme 7 d/yr ≥108°F today · 28 d/yr by 30 yrs out
- Wind 10/10 Extreme 99% chance of damaging wind over 30 yrs
- Air quality 2/10 Low 2 unhealthy d/yr today · 2 by 30 yrs out
Nearby sold comps map
Loading sold comps map…
Walkable amenities ~0.75 mi
Loading nearby amenities…
Taxation est. · year 1
- Rental income
- $23,281
- − Mortgage interest
- −$8,934
- − Property taxes
- −$3,961
- − Insurance
- −$1,595
- − Repairs & maintenance
- −$1,862
- − Management
- −$1,862
- − Depreciation
- −$4,640
- Taxable income
- $425
- Est. tax owed @ 24.0%
- −$102
- After-tax cash flow
- $2,696/yr
For passive investors: Depreciation is non-cash, so a rental often shows a tax loss while cash-flowing — sheltering income. Rental losses are passive: they offset passive income freely, and up to $25,000/yr can offset ordinary (W-2) income if you actively participate and your MAGI is under $100k (phasing out to $0 by $150k); unused losses carry forward. On sale, claimed depreciation is recaptured at up to 25%, and gains may owe capital-gains tax (a 1031 exchange can defer both). Figures are a year-1 estimate at your 24.0% rate — not tax advice; consult a CPA.
Schools (NCES district)
- District
- Charlotte
- NCES district ID
- 1200240
- Math proficiency
- 54% ▼ -6.00%
- Reading proficiency
- 54% ▼ -1.00%
- Median HH income
- $44,864
- Composite
- 45.62/100
- National rank
- #2586
- State rank
- #22 of 73 in FL
Livability — Cleveland
- Score
- 67/100
- State rank
- #574
- US rank
- #10905
Category grades
Schools grade is shown separately in the Schools card above.
Census & demographics
- Census place
- Cleveland, FL
- County
- Charlotte County · 196,994 people
- Metro
- Punta Gorda, FL
- Population (ZIP)
- 13,006
- Household income
- $72,443
- Rent vs Own
- Severe rent burden
- 43.0
Population outlook (Charlotte County) Hauer SSP2
- Today (2025)
- 198,646 people
- By 2030
- 210,507 · +6.0%
- By 2040
- 230,857 · +16.2%
- By 2050
- 247,148 · +24.4%
- By 2075
- 281,777 · +41.8%
- By 2100
- 293,609 · +47.8%
Race, ethnicity, and origin ACS 2023
- Neighborhood character
- Predominantly White (81%)
- Race & ethnicity
- White 81% Two or more races 8% Hispanic / Latino 7% Black 7%
- Hispanic origin (detail)
- Puerto Rican 2% Cuban 3%
- Common ancestry
- Lithuanian 3% Iranian 3% Slovak 3%
- Foreign-born
- 6% · Canada, Jamaica
- Languages at home
- 93% English-only · Spanish 5% German/W. Germanic 1% Arabic 1%
Political lean MEDSL · Charlotte
- 2024 margin
- Solid R (+34.0) · D 32.7% · R 66.7%
- 2008→2024 swing
- -26.7pp toward R · 2008: -7.2pp · 2024: -34.0pp
- All cycles
- 2024: R+34.0 2020: R+26.6 2016: R+27.8 2012: R+14.3 2008: R+7.2
Not yet ingested
- Civics
- —
Market trends
- HPI YoY
- ▼ -5.25%
- Current HPI
- 448.5895
- Rent YoY
- ▲ 4.13%
- Metro
- Punta Gorda, FL
- State GDP YoY
- ▲ 3.28%
- F500 in state
- 36
Industry mix (Fortune 500 HQ in FL)
| Industry | F500 HQs | Revenue |
|---|---|---|
| Industrial Technology | 2 | $29B |
|
||
| Insurance | 2 | $17B |
|
||
| Retail | 1 | $60B |
|
||
| Technology Distribution | 1 | $58B |
|
||
| Homebuilding | 1 | $35B |
|
||
| Technology Manufacturing | 1 | $35B |
|
||
Price history
+625.0% since first listed23 events — show timeline
- 2026-04-23 Price Changed $159,500 Stellar MLS as Distributed by MLS Grid
- 2026-04-23 Relisted — Stellar MLS as Distributed by MLS Grid
- 2026-04-06 Pending — Stellar MLS as Distributed by MLS Grid
- 2026-03-23 Price Changed $160,000 Stellar MLS as Distributed by MLS Grid
- 2026-03-21 Relisted — Stellar MLS as Distributed by MLS Grid
- 2026-03-07 Pending — Stellar MLS as Distributed by MLS Grid
- 2026-03-02 Price Changed $215,000 Stellar MLS as Distributed by MLS Grid
- 2026-01-22 Price Changed $220,000 Stellar MLS as Distributed by MLS Grid
- 2026-01-20 Relisted — Stellar MLS as Distributed by MLS Grid
- 2026-01-08 Pending — Stellar MLS as Distributed by MLS Grid
- 2025-12-12 Listed $259,900 Stellar MLS as Distributed by MLS Grid
- 2024-07-31 Listing Removed — NAPLESMLS
- 2024-07-31 Listing Removed — Stellar MLS as Distributed by MLS Grid
- 2024-05-01 Listed $265,000 Stellar MLS as Distributed by MLS Grid
- 2024-01-18 Listed $265,000 NAPLESMLS
- 2024-01-11 Listing Removed — FORTMLS
- 2023-12-26 Price Changed $270,000 FORTMLS
- 2023-08-31 Price Changed $280,000 FORTMLS
- 2023-07-14 Listed $300,000 FORTMLS
- 2014-08-18 Sold (Public Records) $22,000 Public Records
- 2014-08-14 Sold (MLS) $22,000 Stellar MLS as Distributed by MLS Grid
- 2014-07-11 Pending — Stellar MLS as Distributed by MLS Grid
- 2014-07-03 Listed $22,000 Stellar MLS as Distributed by MLS Grid
Property tax history
+12.5%/yrLatest (2025): $3,961 · -3.6% YoY. Source: county tax records.
Cash-flow waterfall
monthlySold comps — $/sqft
last 12 mo · ≤1 miLoading sold comps…