 🏷️ Likely Rental
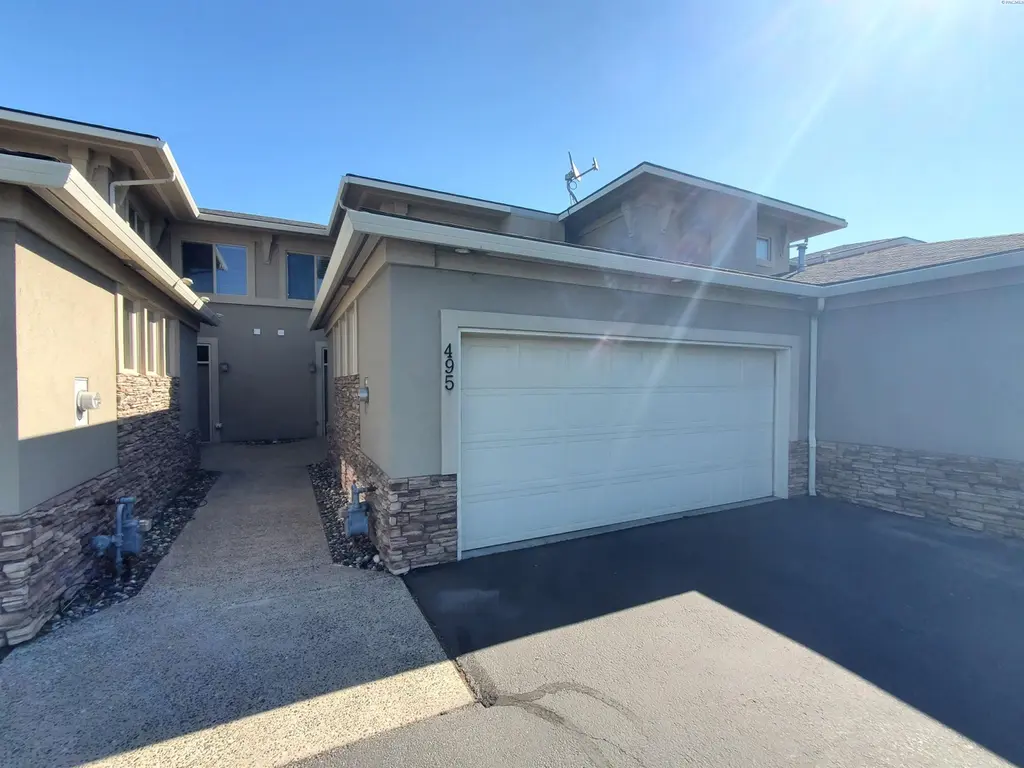
495 Columbia Point Dr · Richland, WA
Flood risk 7/10 · Major
- FEMA flood zone
- X
- Chance of flooding over 30 yrs
- 0.75%
- Est. flood insurance / yr
- $507 – $1,088
Fire risk 1/10 · Minimal
- Est. fire insurance / yr
- $604 – $1,122
Heat risk 5/10 · Moderate
- Hot days now (above 99°F)
- 7 days/yr
- Hot days in 30 yrs
- 15 days/yr
Wind risk 1/10 · Minimal
- Chance of severe wind over 30 yrs
- —
Air-quality risk 7/10 · Major
- Unhealthy air days now
- 11 days/yr
- Unhealthy air days in 30 yrs
- 12 days/yr
Risk factors via First Street. Map © Google.
Why this score? — see what drove the D+ grade
The composite is a weighted blend of 9 inputs, each scored 0–100. Each bar is that input's sub-score; the figure is the points it added to the 100-point composite (weight × sub-score).
- Cash flow +15.0/30.0
- ARV discount +7.5/15.0
- Schools +5.3/10.0
- 1% rule +5.0/10.0
- DSCR +5.0/10.0
- Livability +4.0/5.0
- Rent growth +2.9/5.0
- Condition / age +2.5/5.0
- Appreciation +0.0/10.0
$2,400
🖨 Deal sheet 📄 Offer letter ✓ Due diligence
Listing remarks
FOR RENT: MLS# 293262 Available now, $1000 rent credit for June move in. Wonderful low maintenance living. 2 car garage, spacious laundry room, lovely kitchen w/ stainless appliances opening to dining & great rm & separate den is also on the main level. Primary Suite w/ fireplace, walk-in closet & jetted tub. Tenant pays utilities, HOA fee paid by landlord. Washer/Dryer hook up. Located on Columbia Point near the walking paths, boat launch, restaurants, park, golf & trails and close proximity to shopping and freeways. No Pets, No smoking; 12 mo lease. All adults 18 and over to complete a full screening application. Move in fees include but may not be limited to firs
Key facts
- Walk-in closet
- Stainless appliances
- Separate den
Tags
Property features AI
Finance
- HOA & community: Curbs, sidewalks, and street lights
Exterior
- Parking: Attached 2-car garage with garage door opener; 2 total parking spaces (2 covered)
- Utilities: Public water; Sewer connected; Timed underground sprinklers for entire property
- Home design: Condominium; Two-story; New construction; Has view
- Construction: Stucco exterior; Composition roof; Crawl space / no basement; Built recently (new construction)
- Exterior features: Patio; Views; Paved road access
Interior
- Kitchen: Dishwasher; Garbage disposal; Microwave; Range / Oven
- Flooring: Carpet
- Bathrooms: 2 full bathrooms; 1 half bathroom
- Heating & cooling: Forced air heating (natural gas); Central air conditioning
- Interior features: Breakfast bar; Walk-in closets; Storage space; Central vacuum; Double pane windows; Gas fireplace (1)
Neighborhood map
What this means for you Summary
Snapshot
- This is a 3-bed/2.5-bath condo listed at $2k.
Deal economics
- At list price, monthly cash flow is $2k ($19k/yr) — positive.
- The deal already cash-flows at list — no discount required.
- Meets the 1% rule at list price ($2k rent vs $2k).
- Recommended offer: $2k (1.5% below list) — sets the bar for market timing.
- Cap rate 845.1% vs local median 2.8% in Richland — top-decile yield for the area; either an underpriced asset or a hidden risk that comps aren't pricing in. Stress-test before assuming the spread holds.
Location & tenants
- Location reads 79/100 on livability (#112 in WA, #2,258 nationally) — a middle-class / working-renter tenant base. Strengths: commute A+, housing A+, health & safety A+; Watch: cost of living C-, amenities F.
- Richland School District (urban): math 52% / reading 64% proficiency, ranked #61 of 291 in WA (top 21%) — acceptable for families but not a draw, mixed tenant base, ~2y average lease.
- Market conditions: Rents rising (+1.6%/yr); 544 active listings in the ZIP; 4 comparable units currently listed for rent nearby; rentals at typical pace (median 21d on market — plan ~3-4 weeks tenant-placement turnaround); solid renter incomes; 1,532 units permitted in Benton County in 2024 (389 in 5+ unit buildings).
Forward outlook
- Local home prices are declining (-3.0%/yr); year-one equity from $17 of loan paydown is wiped out by about $72 of value loss. Plan a longer hold.
- Benton County population projected at +32% by 2050 — long-run rental-demand tailwind backs the buy-and-hold thesis.
- At projected returns (-3.0% appreciation + 1.6% rent growth), your $672 cash investment doubles in ~1 year — after that, you're playing with house money.
Negotiation context
- It's been on market 22 days — a 2% lower offer ($2k) is reasonable based on typical stale-listing flexibility.
- 5 sale attempts since 19y ago with the ask held roughly flat each time — persistent listings suggest the price (not the market) is what's stuck; bring a comps-based counter.
Risks & watch-outs
- Watch-outs: flood insurance adds $66/mo.
- Climate carrying-cost: major flood risk; extreme-heat days projected 7→15/yr by 2055 (HVAC capex compounding) — expect insurance premiums to compound above CPI over the hold.
Questions for the listing agent
- What's the actual annual flood-insurance premium (NFIP or private), and is the property in a SFHA with mandatory coverage?
- What does the HOA fee cover, when was the last increase, and are there any pending special assessments or reserve-fund shortfalls?
- Any open or pending special assessments — roof, HVAC, plumbing, elevator, façade? What's the per-unit balance and payoff schedule, and is the seller paying it off at close or rolling it to the buyer?
- Is there a deadline driving the sale (1031 exchange, divorce, estate, relocation)? That informs how much negotiation room exists.
- Schools are A-rated — typically a magnet for longer-tenancy family renters. What's the average tenant stay here, and is there a school-zone premium baked into asking?
- The area grade is low — what's the realistic commute time and amenity access for the typical tenant pool here? Any planned neighborhood developments (good or bad) we should know about?
- What's the average days-on-market for RENTAL listings here right now (not sales)? A rising rental-DOM trend means longer vacancies and softer asking-rent achievability than the comps imply.
- What's the recent tenant-quality profile in this submarket — average credit score on applications, eviction rate, late-payment / NSF rate, and stable-employment percentage? A property-management company in the area should have these aggregated.
- How much new apartment / multifamily construction is in the pipeline within 1–3 miles? Heavy new supply (>2% of stock underway) typically softens rents 12–24 months out; light construction supports rent growth.
Investment metrics
- 1% rule
- 101.96% ✓
- Cap rate
- 845.09%
- Cash-on-cash
- 2995.71%
- DSCR
- 134.29
- GRM
- 0.1
CMA / ARV
No comps found within radius.
Projected returns pro-forma
-3.0% appreciation · 1.6% rent growth · sell at horizon
- IRR
- —
- Equity multiple
- 148.40×
- Total profit
- $99,050
- Equity at exit
- $358
- IRR
- —
- Equity multiple
- 307.15×
- Total profit
- $205,733
- Equity at exit
- $208
Cash invested: $672 (down + closing). Projections, not guarantees.
Landlord ↔ Tenant lean methodology
- Overall (STATE)
- 28 Tenant-Leaning
- State Washington
- 28 Tenant-Leaning · D+8
- County
- — inherits STATE
- City
- — inherits STATE
ZIP-level market 99352
- Rents YoY
- 1.6%
- Active inventory
- 544
- Price-to-rent
- 0.1×
Monthly cashflow live
- Estimated rent
- $2,447 medium interval (Pro) →
- Mortgage (P&I)
- −$13
- Tax est. 1.5%
- −$3 /mo · $36/yr
- Insurance
- −$1
- Flood insurance flood zone
- −$66 /mo · $798/yr
- HOA est. from 1 same-building comp
- −$239
- Vacancy / Maint / Mgmt
- −$514
- Net cashflow
- $1,611
Break-even live
UW: 25.0% down · 7.5% · 30yr · 1.5% tax · 5.0% vac · 8.0% maint · 8.0% mgmt
Financing live
Cash to close
- Down payment
- $600
- Closing costs
- $72
- Reserves months
- —
- Total cash needed
- —
Loan-product check · same deal, 3 products live
Conventional
25% down · 7.5% · 30yr
- Down + closing
- —
- Monthly P&I
- —
- Monthly cashflow
- —
- DSCR
- —
- Eligible?
- —
Personal DTI + credit; lowest rate.
DSCR
20% down · 8.5% · 30yr
- Down + closing
- —
- Monthly P&I
- —
- Monthly cashflow
- —
- DSCR
- —
- Eligible?
- —
No personal income docs; deal must DSCR.
Hard money
10% down · 12.0% · 12mo
- Down + closing
- —
- Monthly P&I
- —
- Monthly cashflow
- —
- DSCR
- —
- Eligible?
- —
Short-term bridge; refi at stabilization.
Rent comps 4 comps
| Address | Beds | Baths | Sqft | Rent | $/sqft | DOM | Units | Dist |
|---|---|---|---|---|---|---|---|---|
| 459 Columbia Point Dr Richland, WA | 3.0 | 2.5 | 2500 | $2,595 | $1.04 | 21d | 1 | 0.07mi |
| 202 Falley St Richland, WA | 4.0 | 2.0 | 1854 | $2,650 | $1.43 | 21d | 1 | 1.19mi |
| 215 Casey Ave Richland, WA | 2.0 | 1.0 | 1400 | $1,800 | $1.29 | 43d | 1 | 1.24mi |
| 10305 Chapel Hill Blvd Pasco, WA | 1.0–3.0 | 1.0–2.0 | 1045 | $1,810 | $1.73 | 13d | 8 | 1.43mi |
HOA detail condo
- Monthly dues
- $0 · $0/yr
- Assessments
- None detected in remarks — confirm with the listing agent.
Listing history 27 events
-
2026-06-18days on market $2,400 Active 22 DOM
-
2026-06-17days on market $2,400 Active 21 DOM
-
2026-06-16days on market $2,400 Active 20 DOM
-
2026-06-15days on market $2,400 Active 19 DOM
-
2026-06-14days on market $2,400 Active 17 DOM
-
2026-06-13days on market $2,400 Active 16 DOM
-
2026-06-10pricedays on market $2,400 Active 14 DOM
-
2026-06-09days on market $2,495 Active 13 DOM
-
2026-06-08days on market $2,495 Active 12 DOM
-
2026-06-07days on market $2,495 Active 11 DOM
-
2026-06-05days on market $2,495 Active 8 DOM
-
2026-06-03days on market $2,495 Active 7 DOM
-
2026-06-02days on market $2,495 Active 6 DOM
-
2026-06-01days on market $2,495 Active 5 DOM
-
2026-05-31days on market $2,495 Active 4 DOM
-
2026-05-30days on market $2,495 Active 3 DOM
-
2026-05-27$2,495 Active
-
2025-07-23price $2,500
-
2025-07-10price $2,595
-
2022-05-15$550,700 Active
-
2016-07-01soldstatus $260,000
-
2016-07-01soldstatus $260,000
-
2016-05-25$265,000
-
2015-01-15soldstatus $1,600
-
2014-11-13$1,600
-
2007-12-03soldstatus $262,950
-
2007-10-31$262,950
ⓘ Source: listings_history table (triggers on properties + properties_extension) + one-shot
backfill from property_details.listing_events for pre-trigger history.
Climate risk First Street
- Flood 7/10 Severe FEMA zone X · 75% chance over 30 yrs
- Wildfire 1/10 Low
- Heat 5/10 Major 7 d/yr ≥99°F today · 15 d/yr by 30 yrs out
- Wind 1/10 Low
- Air quality 7/10 Severe 11 unhealthy d/yr today · 12 by 30 yrs out
Nearby sold comps map
Loading sold comps map…
Walkable amenities ~0.75 mi
Loading nearby amenities…
Taxation est. · year 1
- Rental income
- $29,365
- − Mortgage interest
- −$134
- − Property taxes
- −$36
- − Insurance
- −$810
- − Repairs & maintenance
- −$2,349
- − Management
- −$2,349
- − HOA
- −$2,868
- − Depreciation
- −$70
- Taxable income
- $20,749
- Est. tax owed @ 24.0%
- −$4,980
- After-tax cash flow
- $14,354/yr
For passive investors: Depreciation is non-cash, so a rental often shows a tax loss while cash-flowing — sheltering income. Rental losses are passive: they offset passive income freely, and up to $25,000/yr can offset ordinary (W-2) income if you actively participate and your MAGI is under $100k (phasing out to $0 by $150k); unused losses carry forward. On sale, claimed depreciation is recaptured at up to 25%, and gains may owe capital-gains tax (a 1031 exchange can defer both). Figures are a year-1 estimate at your 24.0% rate — not tax advice; consult a CPA.
Schools (NCES district)
- District
- Richland School District
- NCES district ID
- 5307320
- Math proficiency
- 52% ▬ 0.00%
- Reading proficiency
- 64% ▼ -1.00%
- Median HH income
- $70,475
- Composite
- 53.04/100
- National rank
- #3244
- State rank
- #61 of 291 in WA
Livability — Richland
- Score
- 79/100
- State rank
- #112
- US rank
- #2258
Category grades
Schools grade is shown separately in the Schools card above.
Census & demographics
- Census place
- Richland, WA
- County
- Benton County · 186,895 people
- City population
- 62,989
- Metro
- Kennewick-Richland, WA
- Population (ZIP)
- 37,430
- Household income
- $100,108
- Rent vs Own
- Severe rent burden
- 983.0
Population outlook (Benton County) Hauer SSP2
- Today (2025)
- 219,421 people
- By 2030
- 233,813 · +6.6%
- By 2040
- 262,134 · +19.5%
- By 2050
- 290,100 · +32.2%
- By 2075
- 363,525 · +65.7%
- By 2100
- 418,667 · +90.8%
Race, ethnicity, and origin ACS 2023
- Neighborhood character
- Predominantly White (73%)
- Race & ethnicity
- White 73% Hispanic / Latino 14% Two or more races 10% Asian 7% Black 2%
- Hispanic origin (detail)
- Mexican 11%
- Common ancestry
- Italian 4% Portuguese 4% Slovak 3%
- Foreign-born
- 9% · Canada, South Korea, China
- Languages at home
- 88% English-only · Spanish 4% Other Indo-European 3% Korean 1%
Political lean MEDSL · Benton
- 2024 margin
- Strong R (+21.9) · D 37.7% · R 59.6% · Other 2.7%
- 2008→2024 swing
- +4.2pp toward D · 2008: -26.1pp · 2024: -21.9pp
- All cycles
- 2024: R+21.9 2020: R+21.0 2016: R+26.6 2012: R+27.0 2008: R+26.1
Not yet ingested
- Civics
- —
Market trends
- HPI YoY
- ▼ -323.81%
- Current HPI
- 217.3435
- Rent YoY
- ▲ 1.60%
- Metro
- Kennewick-Richland, WA
- State GDP YoY
- ▲ 4.65%
- F500 in state
- 22
Industry mix (Fortune 500 HQ in WA)
| Industry | F500 HQs | Revenue |
|---|---|---|
| Retail | 2 | $269B |
|
||
| Technology / Retail | 1 | $638B |
|
||
| Technology | 1 | $245B |
|
||
| Telecommunications | 1 | $38B |
|
||
| Food / Beverage | 1 | $36B |
|
||
| Automotive / Trucks | 1 | $34B |
|
||
Price history
-99.1% since first listed11 events — show timeline
- 2026-05-27 Listed $2,495 PACMLS
- 2025-07-23 Price Changed $2,500 PACMLS
- 2025-07-10 Price Changed $2,595 PACMLS
- 2022-05-15 Listed $550,700 PACMLS
- 2016-07-01 Sold (Public Records) $260,000 Public Records
- 2016-07-01 Sold (MLS) $260,000 PACMLS
- 2016-05-25 Listed $265,000 PACMLS
- 2015-01-15 Sold (MLS) $1,600 PACMLS
- 2014-11-13 Listed $1,600 PACMLS
- 2007-12-03 Sold (MLS) $262,950 PACMLS
- 2007-10-31 Listed $262,950 PACMLS
Property tax history
+1.5%/yrLatest (2026): $3,637 · -0.8% YoY. Source: county tax records.
Cash-flow waterfall
monthlySold comps — $/sqft
last 12 mo · ≤1 miLoading sold comps…