 🏷️ Likely Rental
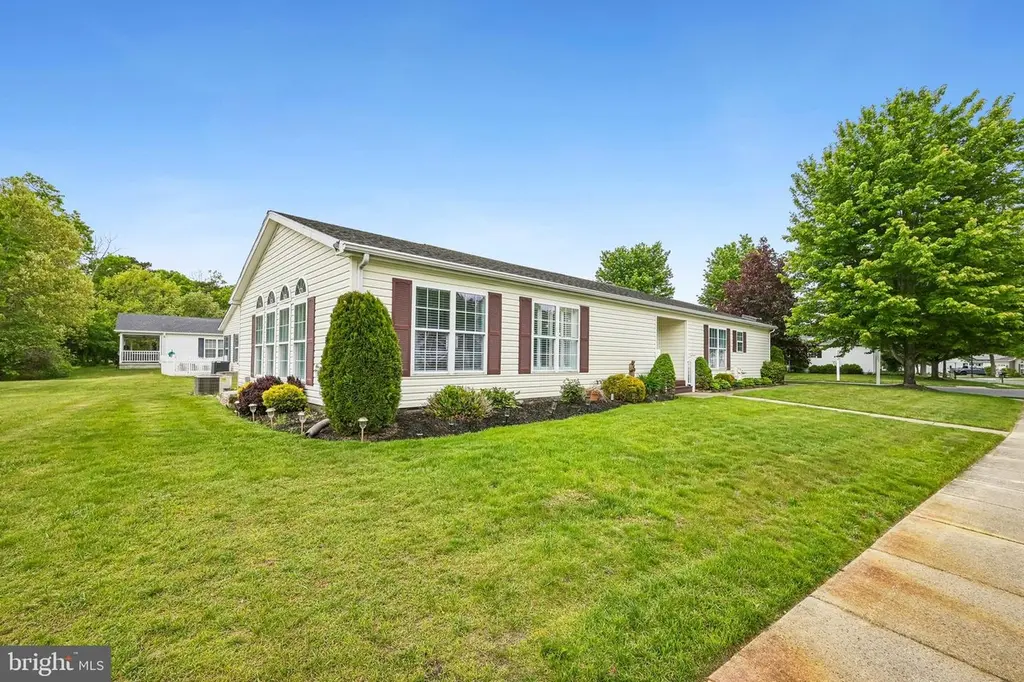
209 Burning Tree Ct · McKee City, NJ
Flood risk No data
- FEMA flood zone
- —
- Chance of flooding over 30 yrs
- —
- Est. flood insurance / yr
- —
Fire risk No data
- Est. fire insurance / yr
- —
Heat risk No data
- Hot days now (above threshold)
- —
- Hot days in 30 yrs
- —
Wind risk No data
- Chance of severe wind over 30 yrs
- —
Air-quality risk No data
- Unhealthy air days now
- —
- Unhealthy air days in 30 yrs
- —
Risk factors via First Street. Map © Google.
Why this score? — see what drove the B grade
The composite is a weighted blend of 9 inputs, each scored 0–100. Each bar is that input's sub-score; the figure is the points it added to the 100-point composite (weight × sub-score).
- Cash flow +22.8/30.0
- ARV discount +15.0/15.0
- Appreciation +10.0/10.0
- DSCR +7.3/10.0
- 1% rule +6.2/10.0
- Rent growth +2.5/5.0
- Livability +2.5/5.0
- Condition / age +2.5/5.0
- Schools +2.1/10.0
$249,900
🖨 Deal sheet 📄 Offer letter ✓ Due diligence
Listing remarks MLS
Beautiful and Spacious St. Andrews Model in The Fairways 55+ Community with Indoor/Outdoor Pool, Golf Course and ClubHouse. Oversized Garage. Ceiling Fans Throughout. Also Available For Rent in September. Furnished!
Key facts
- Anderson windows
- Newer roof
- St andrews model
Tags
Property features AI
Finance
- Other: Finished area approximately 2,100 (above grade)
- Financial info: Monthly land lease payment of $1,053; Land lease years remaining: 0
- HOA & community: Monthly HOA fee of $40; Community amenities: Clubhouse, Fitness Center, Billiard Room, Game Room
Exterior
- Parking: Attached side-entry garage (1-car)
- Utilities: Public water; Public sewer; Electric cooling; Natural gas for heating and hot water
- Home design: Manufactured home; Land lease ownership; Senior community with 55+ age requirement
- Construction: Vinyl siding
- Exterior features: Community indoor heated pool; Above-grade other structures
Interior
- Bedrooms: Three bedrooms on the main level
- Bathrooms: Two full bathrooms (both on the main level)
- Heating & cooling: Forced air heating; Central air conditioning; Natural gas heating and hot water
- Interior features: Estimated living area; No basement
Neighborhood map
What this means for you Summary
Snapshot
- This is a 3-bed/2.0-bath single-family listed at $250k.
Deal economics
- At list price, monthly cash flow is $436 ($5k/yr) — positive.
- The deal already cash-flows at list — no discount required.
- Meets the 1% rule at list price ($3k rent vs $250k).
- Recommended offer: $242k (3.0% below list) — sets the bar for market timing.
- Cap rate 8.4% vs local median 5.0% in McKee City — top-decile yield for the area; either an underpriced asset or a hidden risk that comps aren't pricing in. Stress-test before assuming the spread holds.
Location & tenants
- Location reads: area grade B — affects rentability + tenant quality, not the cash-flow math above.
- Hamilton Township School District (suburban): math 9% / reading 37% proficiency, ranked #401 of 472 in NJ (top 85%) — low school quality limits family demand, transient renter base, plan for 1-2y turnover.
- Market conditions: 240 active listings in the ZIP; solid renter incomes; 672 units permitted in Atlantic County in 2024 (258 in 5+ unit buildings).
- This rent runs 43% of the median local income ($77k/yr) — at the standard rent-burdened threshold; future hikes will face affordability resistance.
Forward outlook
- In year one you build about $27k of equity ($2k loan paydown + $25k appreciation (10.0% local appreciation)).
- Atlantic County population projected at -12% by 2050 — secular population decline; favor cash flow + early exit over multi-decade hold.
- At projected returns (10.0% appreciation + 3.0% rent growth), your $70k cash investment doubles in ~3 years — after that, you're playing with house money.
- By year 2, paydown + projected appreciation supports a ~$43k cash-out refi (75% LTV) — recoverable capital for the next deal without selling this one.
Negotiation context
- It's been on market 34 days — a 3% lower offer ($242k) is reasonable based on typical stale-listing flexibility.
- 2 sale attempts since 15y ago with the ask held roughly flat each time — persistent listings suggest the price (not the market) is what's stuck; bring a comps-based counter.
Questions for the listing agent
- It's been on market 34 days. Have you received any prior offers? Is the seller open to a 3% concession, seller financing, or rate buy-down credit?
- What does the HOA fee cover, when was the last increase, and are there any pending special assessments or reserve-fund shortfalls?
- Is there a deadline driving the sale (1031 exchange, divorce, estate, relocation)? That informs how much negotiation room exists.
- What's the average days-on-market for RENTAL listings here right now (not sales)? A rising rental-DOM trend means longer vacancies and softer asking-rent achievability than the comps imply.
- What's the recent tenant-quality profile in this submarket — average credit score on applications, eviction rate, late-payment / NSF rate, and stable-employment percentage? A property-management company in the area should have these aggregated.
- How much new for-sale + rental construction is in the pipeline within 1–3 miles? Heavy new supply typically softens prices + rents 12–24 months out; constrained supply supports both.
Investment metrics
- 1% rule
- 1.12% ✓
- Cap rate
- 8.39%
- Cash-on-cash
- 7.48%
- DSCR
- 1.33
- GRM
- 7.5
CMA / ARV
- ARV (on-the-fly)
- $474,600
- Comps found
- 12
Show comp detail 12 sales within ~0.75 mi
| Address | Dist | Beds/Ba | Sqft | Sold | Price | $/sf | Match |
|---|---|---|---|---|---|---|---|
| 189 Pebble Beach Dr | 0.07mi | 3/2.0 | 1,800 (-14%) | 15mo | $210,000 | $117 | 60 |
| 48 Monet Dr | 0.33mi | 4/2.5 (+1) | 2,209 (+5%) | 11mo | $599,000 | $271 | 60 |
| 70 Galleria Dr | 0.36mi | 4/2.5 (+1) | 1,900 (-10%) | 1mo | $510,000 | $268 | 59 |
| 10 Rue Chagall | 0.72mi | 3/2.5 | 2,080 (-1%) | 8mo | $441,000 | $212 | 56 |
| 511 Shires Way | 0.65mi | 4/3.5 (+1) | 2,172 (+3%) | 0mo | $510,000 | $235 | 53 |
| 66 Knollwood Dr | 0.43mi | 3/2.0 | 1,800 (-14%) | 6mo | $238,000 | $132 | 51 |
| 32 Renaissance Dr | 0.63mi | 4/2.5 (+1) | 2,384 (+14%) | 1mo | $519,000 | $218 | 40 |
| 119 Pennington Ave | 0.58mi | 4/2.5 (+1) | 1,906 (-9%) | 14mo | $499,990 | $262 | 38 |
| 102 Galleria Dr | 0.54mi | 4/2.5 (+1) | 2,264 (+8%) | 20mo | $506,000 | $223 | 38 |
| 8 Rembrandt Way | 0.68mi | 4/2.5 (+1) | 2,384 (+14%) | 1mo | $500,000 | $210 | 38 |
| 23 Renaissance Dr | 0.63mi | 3/2.5 | 1,860 (-11%) | 15mo | $479,000 | $258 | 36 |
| 116 Pennington Ave | 0.61mi | 4/2.5 (+1) | 2,340 (+11%) | 14mo | $529,990 | $226 | 34 |
Match score weights: distance 35% · size 25% · config 20% · recency 20%. Top-matched comps best support the ARV.
Projected returns pro-forma
10.0% appreciation · 3.0% rent growth · sell at horizon
- IRR
- 29.7%
- Equity multiple
- 3.34×
- Total profit
- $163,953
- Equity at exit
- $225,130
- IRR
- 25.8%
- Equity multiple
- 7.59×
- Total profit
- $461,099
- Equity at exit
- $485,501
Cash invested: $69,972 (down + closing). Projections, not guarantees.
Landlord ↔ Tenant lean methodology
- Overall (STATE)
- 21 Tenant-Leaning
- State New Jersey
- 21 Tenant-Leaning · D+6
- County
- — inherits STATE
- City
- — inherits STATE
ZIP-level market 08330
- Home prices YoY
- 3.9%
- Active inventory
- 240
- Price-to-rent
- 7.5×
Monthly cashflow live
- Estimated rent
- $2,789 medium interval (Pro) →
- Mortgage (P&I)
- −$1,311
- Tax est. 1.5%
- −$312 /mo · $3,748/yr
- Insurance
- −$104
- HOA
- −$40
- Vacancy / Maint / Mgmt
- −$586
- Net cashflow
- $436
Break-even live
UW: 25.0% down · 7.5% · 30yr · 1.5% tax · 5.0% vac · 8.0% maint · 8.0% mgmt
Financing live
Cash to close
- Down payment
- $62,475
- Closing costs
- $7,497
- Reserves months
- —
- Total cash needed
- —
Loan-product check · same deal, 3 products live
Conventional
25% down · 7.5% · 30yr
- Down + closing
- —
- Monthly P&I
- —
- Monthly cashflow
- —
- DSCR
- —
- Eligible?
- —
Personal DTI + credit; lowest rate.
DSCR
20% down · 8.5% · 30yr
- Down + closing
- —
- Monthly P&I
- —
- Monthly cashflow
- —
- DSCR
- —
- Eligible?
- —
No personal income docs; deal must DSCR.
Hard money
10% down · 12.0% · 12mo
- Down + closing
- —
- Monthly P&I
- —
- Monthly cashflow
- —
- DSCR
- —
- Eligible?
- —
Short-term bridge; refi at stabilization.
HOA detail
- Monthly dues
- $40 · $480/yr
- Likely covers
- pool
Listing history 21 events
-
2026-06-19days on market $249,900 Active 34 DOM
-
2026-06-18days on market $249,900 Active 33 DOM
-
2026-06-17days on market $249,900 Active 32 DOM
-
2026-06-16days on market $249,900 Active 31 DOM
-
2026-06-15days on market $249,900 Active 30 DOM
-
2026-06-14days on market $249,900 Active 28 DOM
-
2026-06-13days on market $249,900 Active 27 DOM
-
2026-06-10days on market $249,900 Active 25 DOM
-
2026-06-09days on market $249,900 Active 24 DOM
-
2026-06-08days on market $249,900 Active 23 DOM
-
2026-06-07days on market $249,900 Active 22 DOM
-
2026-06-03days on market $249,900 Active 18 DOM
-
2026-06-02days on market $249,900 Active 17 DOM
-
2026-06-01days on market $249,900 Active 16 DOM
-
2026-05-31days on market $249,900 Active 15 DOM
-
2026-05-30days on market $249,900 Active 14 DOM
-
2026-05-16$249,900 Active
-
2025-09-20historical
-
2025-09-15historical
-
2011-11-26historical 215-char remark
Show marketing remark (215 chars)
Beautiful and Spacious St. Andrews Model in The Fairways 55+ Community with Indoor/Outdoor Pool, Golf Course and ClubHouse. Oversized Garage. Ceiling Fans Throughout. Also Available For Rent in September. Furnished!
-
2011-05-25$145,000 215-char remark
Show marketing remark (215 chars)
Beautiful and Spacious St. Andrews Model in The Fairways 55+ Community with Indoor/Outdoor Pool, Golf Course and ClubHouse. Oversized Garage. Ceiling Fans Throughout. Also Available For Rent in September. Furnished!
ⓘ Source: listings_history table (triggers on properties + properties_extension) + one-shot
backfill from property_details.listing_events for pre-trigger history.
Nearby sold comps map
Loading sold comps map…
Walkable amenities ~0.75 mi
Loading nearby amenities…
Taxation est. · year 1
- Rental income
- $33,467
- − Mortgage interest
- −$13,998
- − Property taxes
- −$3,748
- − Insurance
- −$1,250
- − Repairs & maintenance
- −$2,677
- − Management
- −$2,677
- − HOA
- −$480
- − Depreciation
- −$7,270
- Taxable income
- $1,366
- Est. tax owed @ 24.0%
- −$328
- After-tax cash flow
- $4,907/yr
For passive investors: Depreciation is non-cash, so a rental often shows a tax loss while cash-flowing — sheltering income. Rental losses are passive: they offset passive income freely, and up to $25,000/yr can offset ordinary (W-2) income if you actively participate and your MAGI is under $100k (phasing out to $0 by $150k); unused losses carry forward. On sale, claimed depreciation is recaptured at up to 25%, and gains may owe capital-gains tax (a 1031 exchange can defer both). Figures are a year-1 estimate at your 24.0% rate — not tax advice; consult a CPA.
Schools (NCES district)
- District
- Hamilton Township School District
- NCES district ID
- 3406510
- Math proficiency
- 9% ▼ -20.00%
- Reading proficiency
- 37% ▼ -9.00%
- Median HH income
- $60,997
- Composite
- 21.34/100
- National rank
- #8372
- State rank
- #401 of 472 in NJ
Livability — McKee City
No livability data for this city. (Only ~50 U.S. cities are tracked.)
Census & demographics
- Census place
- McKee City, NJ
- County
- Atlantic County · 143,611 people
- Metro
- Atlantic City-Hammonton, NJ
- Population (ZIP)
- 29,972
- Household income
- $77,167
- Rent vs Own
- Severe rent burden
- 1003.0
Population outlook (Atlantic County) Hauer SSP2
- Today (2025)
- 268,948 people
- By 2030
- 264,497 · -1.7%
- By 2040
- 252,261 · -6.2%
- By 2050
- 237,846 · -11.6%
- By 2075
- 210,650 · -21.7%
- By 2100
- 180,234 · -33.0%
Race, ethnicity, and origin ACS 2023
- Neighborhood character
- Diverse neighborhood (Simpson 0.62)
- Race & ethnicity
- White 58% Hispanic / Latino 16% Black 14% Two or more races 13% Asian 4%
- Hispanic origin (detail)
- Puerto Rican 7% Dominican 4%
- Common ancestry
- Romanian 3% Italian 2% Lithuanian 1%
- Foreign-born
- 9% · Canada, Vietnam, Guatemala
- Languages at home
- 84% English-only · Spanish 10% Tagalog/Filipino 1% Other Indo-European 1%
Political lean MEDSL · Atlantic
- 2024 margin
- Toss-up / Even · D 47.7% · R 50.7% · Other 1.6%
- 2008→2024 swing
- -18.1pp toward R · 2008: 15.1pp · 2024: -3.0pp
- All cycles
- 2024: R+3.0 2020: D+6.7 2016: D+6.2 2012: D+17.2 2008: D+15.1
Not yet ingested
- Civics
- —
Market trends
- HPI YoY
- ▲ 11.58%
- Current HPI
- 308.5148
- Rent YoY
- —
- Metro
- Atlantic City-Hammonton, NJ
- State GDP YoY
- ▲ 2.05%
- F500 in state
- 34
Industry mix (Fortune 500 HQ in NJ)
| Industry | F500 HQs | Revenue |
|---|---|---|
| Consumer Goods | 3 | $31B |
|
||
| Pharmaceuticals | 2 | $153B |
|
||
| Technology | 2 | $21B |
|
||
| Insurance | 2 | $20B |
|
||
| Healthcare | 2 | $19B |
|
||
| Financial Services | 1 | $70B |
|
||
Price history
+72.3% since first listed5 events — show timeline
- 2026-05-16 Listed $249,900 BRIGHT MLS
- 2025-09-20 Listing Removed — BRIGHT MLS
- 2025-09-15 Coming Soon — BRIGHT MLS
- 2011-11-26 Listing Removed — SJSRMLS
- 2011-05-25 Listed $145,000 SJSRMLS
Cash-flow waterfall
monthlySold comps — $/sqft
last 12 mo · ≤1 miLoading sold comps…