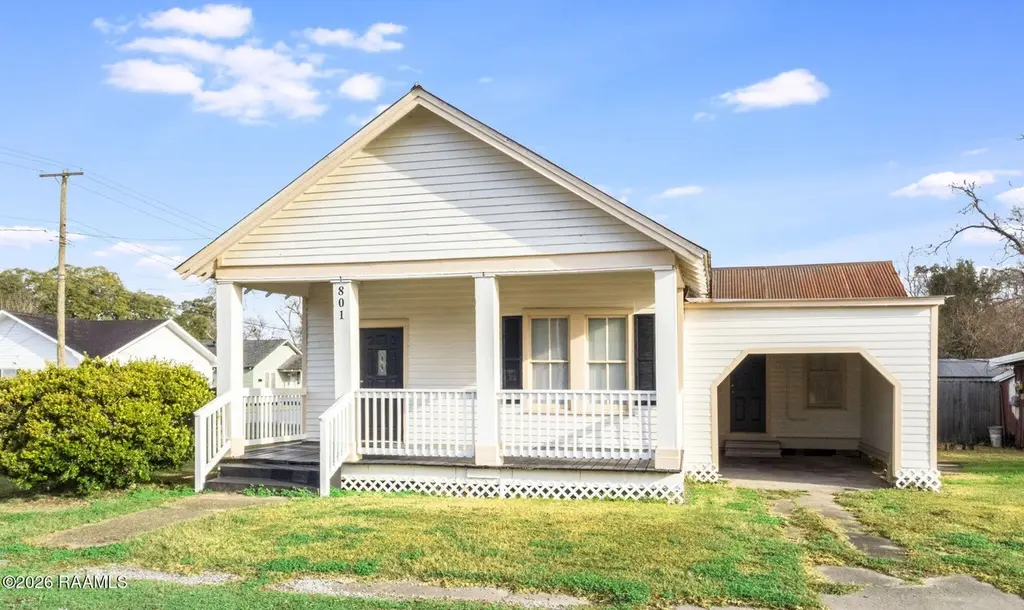
801 Godchaux St · Abbeville, LA
Flood risk 6/10 · Moderate
- FEMA flood zone
- X (shaded)
- Chance of flooding over 30 yrs
- 0.55%
- Est. flood insurance / yr
- $507 – $1,088
Fire risk 3/10 · Minor
- Est. fire insurance / yr
- $1,269 – $2,357
Heat risk 10/10 · Severe
- Hot days now (above 108°F)
- 7 days/yr
- Hot days in 30 yrs
- 21 days/yr
Wind risk 9/10 · Severe
- Chance of severe wind over 30 yrs
- 99.0%
Air-quality risk 1/10 · Minimal
- Unhealthy air days now
- 0 days/yr
- Unhealthy air days in 30 yrs
- 0 days/yr
Risk factors via First Street. Map © Google.
Why this score? — see what drove the C- grade
The composite is a weighted blend of 9 inputs, each scored 0–100. Each bar is that input's sub-score; the figure is the points it added to the 100-point composite (weight × sub-score).
- Cash flow +17.1/30.0
- ARV discount +15.0/15.0
- DSCR +5.3/10.0
- Schools +3.9/10.0
- 1% rule +3.4/10.0
- Livability +3.4/5.0
- Rent growth +2.5/5.0
- Condition / age +2.5/5.0
- Appreciation +0.0/10.0
$83,000
🖨 Deal sheet (PDF) 📄 Offer letter ✓ Due diligence
Key facts
- 0.25 acre lot
- Parking
- Listed 118 days
Neighborhood map
What this means for you Summary
Snapshot
- This is a 3-bed/1.0-bath single-family listed at $83k.
Deal economics
- At list price, monthly cash flow is $57 ($685/yr) — positive.
- The deal already cash-flows at list — no discount required.
- To meet the 1% rule (rent ≥ 1% of price), the offer needs to be $70k (16.3% below list).
- Recommended offer: $70k (16.3% below list) — sets the bar for 1% rule.
Location & tenants
- Location reads 68/100 on livability (#94 in LA) — a middle-class / working-renter tenant base. Strengths: cost of living A+, housing A+, health & safety A+; Watch: crime F, amenities F, commute F.
- Vermilion Parish (town): math 40% / reading 53% proficiency, ranked #15 of 98 in LA (top 15%) — families likely to look elsewhere, expect single-tenant / working-renter base with shorter leases.
- Market conditions: 180 active listings in the ZIP; 1 comparable units currently listed for rent nearby; 228 units permitted in Vermilion Parish in 2024 (0 in 5+ unit buildings).
Forward outlook
- Local home prices are declining (-3.0%/yr); year-one equity from $574 of loan paydown is wiped out by about $2k of value loss. Plan a longer hold.
- Vermilion County population projected at +10% by 2050 — modest demand growth; plan on rents tracking national, not racing it.
Negotiation context
- It's been on market 118 days — a 9% lower offer ($76k) is reasonable based on typical stale-listing flexibility.
Risks & watch-outs
- Climate carrying-cost: major flood risk; severe wind risk, 99% chance of damaging wind over 30y; extreme-heat days projected 7→21/yr by 2055 (HVAC capex compounding) — expect insurance premiums to compound above CPI over the hold.
Questions for the listing agent
- It's been on market 118 days. Have you received any prior offers? Is the seller open to a 16% concession, seller financing, or rate buy-down credit?
- Why hasn't it sold? Are there any deal-killer items the seller is aware of (foundation, flood, title, zoning, code violations)?
- Is there a deadline driving the sale (1031 exchange, divorce, estate, relocation)? That informs how much negotiation room exists.
- Schools are B-rated — typically a magnet for longer-tenancy family renters. What's the average tenant stay here, and is there a school-zone premium baked into asking?
- Crime grade is F in this area — have there been break-ins, vandalism, or insurance claims at this property in the last 3 years? What carrier currently insures it and at what premium?
- What's the average days-on-market for RENTAL listings here right now (not sales)? A rising rental-DOM trend means longer vacancies and softer asking-rent achievability than the comps imply.
- What's the recent tenant-quality profile in this submarket — average credit score on applications, eviction rate, late-payment / NSF rate, and stable-employment percentage? A property-management company in the area should have these aggregated.
- How much new for-sale + rental construction is in the pipeline within 1–3 miles? Heavy new supply typically softens prices + rents 12–24 months out; constrained supply supports both.
Investment metrics
- 1% rule
- 0.84% ✗
- Cap rate
- 7.12%
- Cash-on-cash
- 2.95%
- DSCR
- 1.13
- GRM
- 10.0
CMA / ARV
- ARV (median comp)
- $117,932
- List price
- $83,000
- Delta
- -29.62%
- Verdict
- UNDERPRICED
- Comps
- 20 within 1.0 mi
Show comp detail 12 sales within ~0.75 mi
| Address | Dist | Beds/Ba | Sqft | Sold | Price | $/sf | Match |
|---|---|---|---|---|---|---|---|
| 106 Holmes Dr | 0.46mi | 2/2.0 (-1) | 1,342 (+3%) | 3mo | $55,500 | $41 | 61 |
| 1719 Maude Ave | 0.59mi | 3/1.0 | 1,250 (-4%) | 6mo | $5,000 | $4 | 61 |
| 316 Alley St | 0.60mi | 2/1.0 (-1) | 1,329 (+2%) | 4mo | $86,900 | $65 | 60 |
| 704 S St Charles St | 0.48mi | 3/1.5 | 1,398 (+8%) | 6mo | $126,900 | $91 | 58 |
| 105 Donald Frederick Blvd | 0.34mi | 3/2.0 | 1,478 (+14%) | 8mo | $142,500 | $96 | 51 |
| 413 E Martin Luther King, Jr. Dr | 0.44mi | 3/1.0 | 1,161 (-11%) | 13mo | $30,000 | $26 | 50 |
| 108 Maude Ave | 0.42mi | 2/2.0 (-1) | 1,200 (-8%) | 14mo | $41,595 | $35 | 47 |
| 700 S State Street St | 0.53mi | 3/1.0 | 1,115 (-14%) | 12mo | $76,000 | $68 | 42 |
| 800 S Washington St | 0.71mi | 3/2.0 | 1,475 (+14%) | 5mo | $97,000 | $66 | 36 |
| 513 N East St | 0.63mi | 3/2.0 | 1,479 (+14%) | 10mo | $144,990 | $98 | 35 |
| 604 Dean St | 0.72mi | 2/1.0 (-1) | 1,170 (-10%) | 15mo | $88,900 | $76 | 32 |
| 312 Putnam Ave | 0.66mi | 3/2.0 | 1,119 (-14%) | 18mo | $32,000 | $29 | 27 |
Match score weights: distance 35% · size 25% · config 20% · recency 20%. Top-matched comps best support the ARV.
Projected returns pro-forma
-3.0% appreciation · 3.0% rent growth · sell at horizon
- IRR
- -11.7%
- Equity multiple
- 0.58×
- Total profit
- $-9,853
- Equity at exit
- $12,376
- IRR
- -2.6%
- Equity multiple
- 0.83×
- Total profit
- $-4,060
- Equity at exit
- $7,176
Cash invested: $23,240 (down + closing). Projections, not guarantees.
Landlord ↔ Tenant lean methodology
- Overall (STATE)
- 90 Strongly Landlord-Friendly
- State Louisiana
- 90 Strongly Landlord-Friendly · R+12
- County
- — inherits STATE
- City
- — inherits STATE
ZIP-level market 70510
- Active inventory
- 180
- Price-to-rent
- 10.0×
Monthly cashflow live
- Estimated rent
- $695 medium interval (Pro) →
- Mortgage (P&I)
- −$435
- Tax from tax record
- −$22 /mo · $265/yr
- Insurance
- −$35
- HOA
- −$0
- Vacancy / Maint / Mgmt
- −$146
- Net cashflow
- $57
Break-even live
Sensitivity live
| Price | -10% $104 | -5% $81 | +0% $57 | +5% $34 | +10% $10 |
|---|---|---|---|---|---|
| Rent | -10% $2 | -5% $30 | +0% $57 | +5% $85 | +10% $112 |
| Rate | -1.0pp $99 | -0.5pp $78 | base $57 | +0.5pp $36 | +1.0pp $14 |
UW: 25.0% down · 7.5% · 30yr · 1.5% tax · 5.0% vac · 8.0% maint · 8.0% mgmt
Financing live
Cash to close
- Down payment
- $20,750
- Closing costs
- $2,490
- Reserves months
- —
- Total cash needed
- —
Loan-product check · same deal, 3 products live
Conventional
25% down · 7.5% · 30yr
- Down + closing
- —
- Monthly P&I
- —
- Monthly cashflow
- —
- DSCR
- —
- Eligible?
- —
Personal DTI + credit; lowest rate.
DSCR
20% down · 8.5% · 30yr
- Down + closing
- —
- Monthly P&I
- —
- Monthly cashflow
- —
- DSCR
- —
- Eligible?
- —
No personal income docs; deal must DSCR.
Hard money
10% down · 12.0% · 12mo
- Down + closing
- —
- Monthly P&I
- —
- Monthly cashflow
- —
- DSCR
- —
- Eligible?
- —
Short-term bridge; refi at stabilization.
Rent comps 1 comps
| Address | Beds | Baths | Sqft | Rent | $/sqft | DOM | Units | Dist |
|---|---|---|---|---|---|---|---|---|
| 407 Nugier St Abbeville, LA | 4.0 | 2.0 | 1374 | $695 | $0.51 | 44d | 1 | 0.82mi |
Listing history 18 events
-
2026-06-18days on market $83,000 Active 118 DOM
-
2026-06-17days on market $83,000 Active 117 DOM
-
2026-06-16days on market $83,000 Active 116 DOM
-
2026-06-15days on market $83,000 Active 115 DOM
-
2026-06-14days on market $83,000 Active 113 DOM
-
2026-06-13days on market $83,000 Active 112 DOM
-
2026-06-10days on market $83,000 Active 110 DOM
-
2026-06-09days on market $83,000 Active 109 DOM
-
2026-06-08days on market $83,000 Active 108 DOM
-
2026-06-07days on market $83,000 Active 107 DOM
-
2026-06-03days on market $83,000 Active 103 DOM
-
2026-06-02days on market $83,000 Active 102 DOM
-
2026-06-01days on market $83,000 Active 101 DOM
-
2026-05-31days on market $83,000 Active 100 DOM
-
2026-05-30days on market $83,000 Active 99 DOM
-
2026-04-28price $83,000
-
2026-03-09price $84,000
-
2026-02-20$85,000 Active
ⓘ Source: listings_history table (triggers on properties + properties_extension) + one-shot
backfill from property_details.listing_events for pre-trigger history.
Tax reassessment forecast LA · Resets to sale price
- Current annual tax
- $265 · $22/mo
- Projected year-2 tax
- $456 · $38/mo
- Expected delta
- +$191/yr (+$16/mo · 72.0%)
ⓘ Screening estimate from a state-policy table — verify with the county assessor before closing.
Climate risk First Street
- Flood 6/10 Major FEMA zone X (shaded) · 55% chance over 30 yrs
- Wildfire 3/10 Moderate
- Heat 10/10 Extreme 7 d/yr ≥108°F today · 21 d/yr by 30 yrs out
- Wind 9/10 Extreme 99% chance of damaging wind over 30 yrs
- Air quality 1/10 Low 0 unhealthy d/yr today · 0 by 30 yrs out
Nearby sold comps map
Loading sold comps map…
Walkable amenities ~0.75 mi
Loading nearby amenities…
Taxation est. · year 1
- Rental income
- $8,340
- − Mortgage interest
- −$4,649
- − Property taxes
- −$265
- − Insurance
- −$415
- − Repairs & maintenance
- −$667
- − Management
- −$667
- − Depreciation
- −$2,415
- Taxable loss
- −$739
- Est. tax savings @ 24.0%
- +$177
- After-tax cash flow
- $862/yr
For passive investors: Depreciation is non-cash, so a rental often shows a tax loss while cash-flowing — sheltering income. Rental losses are passive: they offset passive income freely, and up to $25,000/yr can offset ordinary (W-2) income if you actively participate and your MAGI is under $100k (phasing out to $0 by $150k); unused losses carry forward. On sale, claimed depreciation is recaptured at up to 25%, and gains may owe capital-gains tax (a 1031 exchange can defer both). Figures are a year-1 estimate at your 24.0% rate — not tax advice; consult a CPA.
Schools (NCES district)
- District
- Vermilion Parish
- NCES district ID
- 2201800
- Math proficiency
- 40% ▼ -38.00%
- Reading proficiency
- 53% ▼ -32.00%
- Median HH income
- $45,115
- Composite
- 39.37/100
- National rank
- #3974
- State rank
- #15 of 98 in LA
Livability — Abbeville
- Score
- 68/100
- State rank
- #94
- US rank
- #9800
Category grades
Schools grade is shown separately in the Schools card above.
Census & demographics
- Census place
- Abbeville, LA
- Population (ZIP)
- 23,909
Population outlook (Vermilion County) Hauer SSP2
- Today (2025)
- 64,095 people
- By 2030
- 65,915 · +2.8%
- By 2040
- 68,985 · +7.6%
- By 2050
- 70,804 · +10.5%
- By 2075
- 73,897 · +15.3%
- By 2100
- 71,793 · +12.0%
Race, ethnicity, and origin ACS 2023
- Neighborhood character
- Majority White (65%)
- Race & ethnicity
- White 65% Black 24% Two or more races 4% Hispanic / Latino 4% Asian 4%
- Common ancestry
- Lithuanian 15% Italian 1%
- Foreign-born
- 5% · Vietnam, Canada
- Languages at home
- 87% English-only · French/Haitian/Cajun 6% Vietnamese 3% Spanish 2%
Political lean MEDSL · Vermilion
- 2024 margin
- Solid R (+63.8) · D 17.6% · R 81.4% · Other 1.1%
- 2008→2024 swing
- -16.3pp toward R · 2008: -47.5pp · 2024: -63.8pp
- All cycles
- 2024: R+63.8 2020: R+61.9 2016: R+59.6 2012: R+52.8 2008: R+47.5
Not yet ingested
- Civics
- —
Market trends
- HPI YoY
- ▼ -70.44%
- Current HPI
- 97.6131
- Rent YoY
- —
- Metro
- —
- State GDP YoY
- ▲ 3.29%
- F500 in state
- 10
Industry mix (Fortune 500 HQ in LA)
| Industry | F500 HQs | Revenue |
|---|---|---|
| Telecommunications | 2 | $23B |
|
||
| Utilities | 1 | $12B |
|
||
| Wholesale / Distribution | 1 | $5B |
|
||
| Advertising | 1 | $2B |
|
||
Price history
-2.4% since first listed3 events — show timeline
- 2026-04-28 Price Changed $83,000 AcadianaMLS
- 2026-03-09 Price Changed $84,000 AcadianaMLS
- 2026-02-20 Listed $85,000 AcadianaMLS
Property tax history
+3.1%/yrLatest (2025): $265 · -0.3% YoY. Source: county tax records.
Cash-flow waterfall
monthlySold comps — $/sqft
last 12 mo · ≤1 miLoading sold comps…