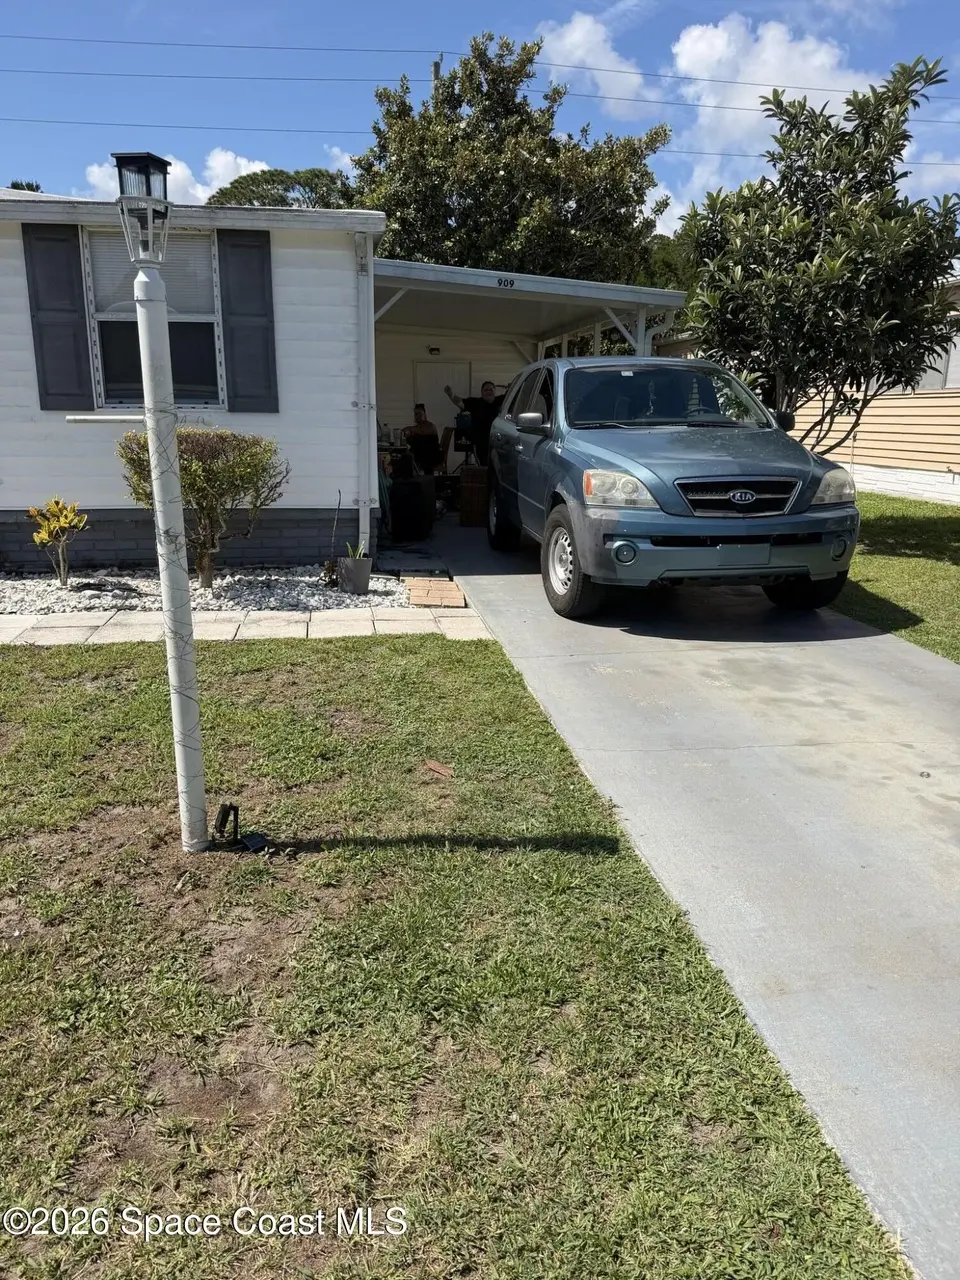
909 Vireo Dr · Micco, FL
Flood risk 1/10 · Minimal
- FEMA flood zone
- X (unshaded)
- Chance of flooding over 30 yrs
- 0.0%
- Est. flood insurance / yr
- $507 – $1,088
Fire risk 4/10 · Minor
- Est. fire insurance / yr
- $947 – $1,759
Heat risk 10/10 · Severe
- Hot days now (above 106°F)
- 7 days/yr
- Hot days in 30 yrs
- 24 days/yr
Wind risk 10/10 · Severe
- Chance of severe wind over 30 yrs
- 99.0%
Air-quality risk 1/10 · Minimal
- Unhealthy air days now
- 0 days/yr
- Unhealthy air days in 30 yrs
- 0 days/yr
Risk factors via First Street. Map © Google.
Why this score? — see what drove the B grade
The composite is a weighted blend of 9 inputs, each scored 0–100. Each bar is that input's sub-score; the figure is the points it added to the 100-point composite (weight × sub-score).
- Cash flow +30.0/30.0
- 1% rule +10.0/10.0
- DSCR +10.0/10.0
- ARV discount +7.5/15.0
- Schools +4.7/10.0
- Livability +3.2/5.0
- Rent growth +2.5/5.0
- Condition / age +2.5/5.0
- Appreciation +0.0/10.0
$79,900
🖨 Deal sheet 📄 Offer letter ✓ Due diligence
Listing remarks
Investor Opportunity -- Barefoot Bay, Brevard County, FL 2BR/2BA manufactured home, 828 SF, on an OWNED 5,227 SF lot -- no lot rent (just $62/mo HOA). Built 1977, metal roof, central HVAC, carport, screened patio. Established Barefoot Bay community near the Sebastian/Micco line, minutes from the Indian River Lagoon and a short drive to Vero/Melbourne beaches. Light-rehab project priced for investors. Home is dated and needs a full cosmetic + systems reno. Recent inspection available: roof at end of life, Federal Pacific (Stab-Lok) panel, polybutylene plumbing, HVAC at end of life, water heater corrosion, flooring/interior, and siding/skirting. Utilities were off at inspection -- budget mec
Key facts
- Central hvac
- Screened patio
- Metal roof
Tags
Property features AI
Exterior
- Parking: Additional parking; Guest parking; 1-car carport
- Utilities: Public sewer; Cable available; Electricity available; Sewer connected; Water connected
- Home design: Manufactured home; Faces north; Single-level
- Construction: Vinyl siding
- Exterior features: Zero lot line
Interior
- Kitchen: Convection oven; Dishwasher; Electric cooktop; Electric oven; Gas cooktop; Gas range; Microwave; Refrigerator
- Bedrooms: 2 bedrooms
- Bathrooms: 2 full bathrooms
- Heating & cooling: Central heating; Central air conditioning; Has heating and cooling
- Interior features: Partially furnished; Convection oven; Dishwasher; Dryer; Electric cooktop; Electric oven; Electric water heater; Gas cooktop; Gas range; Microwave; Refrigerator; Washer
- Laundry & utility: Washer; Dryer; Electric water heater
Neighborhood map
What this means for you Summary
Snapshot
- This is a 2-bed/2.0-bath manufactured listed at $80k.
Deal economics
- At list price, monthly cash flow is $575 ($7k/yr) — positive.
- The deal already cash-flows at list — no discount required.
- Meets the 1% rule at list price ($2k rent vs $80k).
Location & tenants
- Location reads 65/100 on livability (#633 in FL) — a middle-class / working-renter tenant base. Strengths: cost of living A+, housing A+; Watch: employment D, amenities F, commute F.
- Brevard (suburban): math 53% / reading 57% proficiency, ranked #19 of 73 in FL (top 26%) — acceptable for families but not a draw, mixed tenant base, ~2y average lease.
- Zoned schools: Sunrise Elementary School (math 52% / reading 57%, grade C, #892 of 2,144 statewide, top 44%, 759 students, 58% FRL); Southwest Middle School (math 40% / reading 39%, grade F, #373 of 571 statewide, top 66%, 920 students, 58% FRL); Bayside High School (math 27% / reading 40%, grade F, #400 of 667 statewide, top 61%, 1,854 students, 51% FRL).
- Zoned-school proficiency averages 42% at this address vs 55% district-wide (-12 pts) — the specific schools serving this property underperform the Brevard average; the district grade overstates school quality for this exact location.
- Market conditions: 185 active listings in the ZIP; 8 comparable units currently listed for rent nearby; rentals at typical pace (median 24d on market — plan ~3-4 weeks tenant-placement turnaround); 4,602 units permitted in Brevard County in 2024 (702 in 5+ unit buildings).
Forward outlook
- Local home prices are declining (-3.0%/yr); year-one equity from $552 of loan paydown is wiped out by about $2k of value loss. Plan a longer hold.
- Brevard County population projected at +15% by 2050 — modest demand growth; plan on rents tracking national, not racing it.
- At projected returns (-3.0% appreciation + 3.0% rent growth), your $22k cash investment doubles in ~4 years — after that, you're playing with house money.
Negotiation context
- Only 10 days on market — expect competitive offers; lowballing is unlikely to land.
- Current owner paid $35k; list at $80k implies a 128% gain — meaningful room to come down on a strong offer.
Risks & watch-outs
- Watch-outs: property tax is 2.8% of price.
- Climate carrying-cost: severe wind risk, 99% chance of damaging wind over 30y; extreme-heat days projected 7→24/yr by 2055 (HVAC capex compounding) — expect insurance premiums to compound above CPI over the hold.
Questions for the listing agent
- Built in 1977 — when were the roof, HVAC, electrical panel, plumbing, and water heater last replaced?
- Property tax is high relative to price — has the assessment been appealed recently, and will the sale trigger a re-assessment?
- Is there a deadline driving the sale (1031 exchange, divorce, estate, relocation)? That informs how much negotiation room exists.
- Schools are F-rated, which usually means shorter tenancies and higher turnover. Who's the typical renter profile here, and what's been the actual vacancy rate?
- What's the average days-on-market for RENTAL listings here right now (not sales)? A rising rental-DOM trend means longer vacancies and softer asking-rent achievability than the comps imply.
- What's the recent tenant-quality profile in this submarket — average credit score on applications, eviction rate, late-payment / NSF rate, and stable-employment percentage? A property-management company in the area should have these aggregated.
- How much new for-sale + rental construction is in the pipeline within 1–3 miles? Heavy new supply typically softens prices + rents 12–24 months out; constrained supply supports both.
Investment metrics
- 1% rule
- 1.92% ✓
- Cap rate
- 14.93%
- Cash-on-cash
- 30.84%
- DSCR
- 2.37
- GRM
- 4.3
CMA / ARV
No comps found within radius.
Projected returns pro-forma
-3.0% appreciation · 3.0% rent growth · sell at horizon
- IRR
- 25.6%
- Equity multiple
- 2.06×
- Total profit
- $23,748
- Equity at exit
- $11,913
- IRR
- 33.4%
- Equity multiple
- 4.05×
- Total profit
- $68,142
- Equity at exit
- $6,908
Cash invested: $22,372 (down + closing). Projections, not guarantees.
Landlord ↔ Tenant lean methodology
- Overall (STATE)
- 87 Strongly Landlord-Friendly
- State Florida
- 87 Strongly Landlord-Friendly · R+3
- County
- — inherits STATE
- City
- — inherits STATE
ZIP-level market 32976
- Home prices YoY
- -18.6%
- Active inventory
- 185
- Price-to-rent
- 4.3×
Monthly cashflow live
- Estimated rent
- $1,536 high interval (Pro) →
- Mortgage (P&I)
- −$419
- Tax from tax record
- −$186 /mo · $2,232/yr
- Insurance
- −$33
- HOA
- −$0
- Vacancy / Maint / Mgmt
- −$323
- Net cashflow
- $575
Break-even live
UW: 25.0% down · 7.5% · 30yr · 1.5% tax · 5.0% vac · 8.0% maint · 8.0% mgmt
Financing live
Cash to close
- Down payment
- $19,975
- Closing costs
- $2,397
- Reserves months
- —
- Total cash needed
- —
Loan-product check · same deal, 3 products live
Conventional
25% down · 7.5% · 30yr
- Down + closing
- —
- Monthly P&I
- —
- Monthly cashflow
- —
- DSCR
- —
- Eligible?
- —
Personal DTI + credit; lowest rate.
DSCR
20% down · 8.5% · 30yr
- Down + closing
- —
- Monthly P&I
- —
- Monthly cashflow
- —
- DSCR
- —
- Eligible?
- —
No personal income docs; deal must DSCR.
Hard money
10% down · 12.0% · 12mo
- Down + closing
- —
- Monthly P&I
- —
- Monthly cashflow
- —
- DSCR
- —
- Eligible?
- —
Short-term bridge; refi at stabilization.
Rent comps 8 comps
| Address | Beds | Baths | Sqft | Rent | $/sqft | DOM | Units | Dist |
|---|---|---|---|---|---|---|---|---|
| 629 W Marlin Cir Unit NA Sebastian, FL | 2.0 | 2.0 | 1104 | $1,400 | $1.27 | 14d | 1 | 0.21mi |
| 914 Pecan Cir Sebastian, FL | 2.0 | 1.0 | 1000 | $1,600 | $1.60 | 23d | 1 | 0.41mi |
| 410 Osprey Dr Sebastian, FL | 2.0 | 1.5 | 672 | $1,350 | $2.01 | 23d | 1 | 0.67mi |
| 7629 Chasta Rd Sebastian, FL | 2.0 | 2.0 | 958 | $1,600 | $1.67 | 23d | 1 | 0.74mi |
| 7597 Cedar Bark Rd Sebastian, FL | 2.0 | 2.0 | 902 | $1,700 | $1.88 | 23d | 1 | 0.78mi |
| 1207 Marigold Dr Sebastian, FL | 2.0 | 2.0 | 1104 | $1,500 | $1.36 | 23d | 1 | 0.79mi |
| 706 Hyacinth Cir Sebastian, FL | 2.0 | 2.0 | 1062 | $1,750 | $1.65 | 23d | 1 | 0.86mi |
| 8520 US Highway 1 #10 Sebastian, FL | 2.0 | 2.0 | 1091 | $1,800 | $1.65 | 23d | 1 | 1.26mi |
Listing history 9 events
-
2026-06-18days on market $79,900 Active 10 DOM
-
2026-06-17price $79,900 Active 9 DOM
-
2026-06-17days on market $84,900 Active 9 DOM
-
2026-06-16days on market $84,900 Active 8 DOM
-
2026-06-15days on market $84,900 Active 7 DOM
-
2026-06-14days on market $84,900 Active 5 DOM
-
2026-06-10days on market $84,900 Active 2 DOM
-
2026-06-09remarks 699-char remark
-
2026-06-09$84,900 Active 1 DOM
ⓘ Source: listings_history table (triggers on properties + properties_extension) + one-shot
backfill from property_details.listing_events for pre-trigger history.
Tax reassessment forecast FL · Resets to sale price
- Current annual tax
- $2,232 · $186/mo
- Projected year-2 tax
- $2,232 · $186/mo
- Expected delta
- $0/yr ($0/mo · 0.0%)
ⓘ Screening estimate from a state-policy table — verify with the county assessor before closing.
Climate risk First Street
- Flood 1/10 Low FEMA zone X (unshaded) · 0% chance over 30 yrs
- Wildfire 4/10 Moderate
- Heat 10/10 Extreme 7 d/yr ≥106°F today · 24 d/yr by 30 yrs out
- Wind 10/10 Extreme 99% chance of damaging wind over 30 yrs
- Air quality 1/10 Low 0 unhealthy d/yr today · 0 by 30 yrs out
Nearby sold comps map
Loading sold comps map…
Walkable amenities ~0.75 mi
Loading nearby amenities…
Taxation est. · year 1
- Rental income
- $18,429
- − Mortgage interest
- −$4,476
- − Property taxes
- −$2,232
- − Insurance
- −$400
- − Repairs & maintenance
- −$1,474
- − Management
- −$1,474
- − Depreciation
- −$2,324
- Taxable income
- $6,049
- Est. tax owed @ 24.0%
- −$1,452
- After-tax cash flow
- $5,448/yr
For passive investors: Depreciation is non-cash, so a rental often shows a tax loss while cash-flowing — sheltering income. Rental losses are passive: they offset passive income freely, and up to $25,000/yr can offset ordinary (W-2) income if you actively participate and your MAGI is under $100k (phasing out to $0 by $150k); unused losses carry forward. On sale, claimed depreciation is recaptured at up to 25%, and gains may owe capital-gains tax (a 1031 exchange can defer both). Figures are a year-1 estimate at your 24.0% rate — not tax advice; consult a CPA.
Schools (NCES district)
- District
- Brevard
- NCES district ID
- 1200150
- Math proficiency
- 53% ▼ -9.00%
- Reading proficiency
- 57% ▼ -4.00%
- Median HH income
- $49,426
- Composite
- 46.86/100
- National rank
- #2370
- State rank
- #19 of 73 in FL
Livability — Micco
- Score
- 65/100
- State rank
- #633
- US rank
- #12408
Category grades
Schools grade is shown separately in the Schools card above.
Census & demographics
- Census place
- Micco, FL
- Population (ZIP)
- 9,237
Population outlook (Brevard County) Hauer SSP2
- Today (2025)
- 623,254 people
- By 2030
- 648,420 · +4.0%
- By 2040
- 690,009 · +10.7%
- By 2050
- 715,669 · +14.8%
- By 2075
- 775,744 · +24.5%
- By 2100
- 776,687 · +24.6%
Race, ethnicity, and origin ACS 2023
- Neighborhood character
- Predominantly White (93%)
- Race & ethnicity
- White 93% Hispanic / Latino 4% Two or more races 1% Asian 1%
- Common ancestry
- Lithuanian 5% Romanian 4% Iranian 2%
- Foreign-born
- 4% · Canada, Jamaica
- Languages at home
- 95% English-only · Spanish 3%
Political lean MEDSL · Brevard
- 2024 margin
- Strong R (+20.8) · D 39.1% · R 59.9% · Other 1.0%
- 2008→2024 swing
- -10.4pp toward R · 2008: -10.4pp · 2024: -20.8pp
- All cycles
- 2024: R+20.8 2020: R+16.4 2016: R+19.8 2012: R+12.7 2008: R+10.4
Not yet ingested
- Civics
- —
Market trends
- HPI YoY
- ▼ -73.57%
- Current HPI
- 321.5196
- Rent YoY
- —
- Metro
- —
- State GDP YoY
- ▲ 3.28%
- F500 in state
- 36
Industry mix (Fortune 500 HQ in FL)
| Industry | F500 HQs | Revenue |
|---|---|---|
| Industrial Technology | 2 | $29B |
|
||
| Insurance | 2 | $17B |
|
||
| Retail | 1 | $60B |
|
||
| Technology Distribution | 1 | $58B |
|
||
| Homebuilding | 1 | $35B |
|
||
| Technology Manufacturing | 1 | $35B |
|
||
Price history
+196.9% since first listed4 events — show timeline
- 2026-06-08 Listed $84,900 SCMLS
- 1997-10-03 Sold (Public Records) $35,000 Public Records
- 1994-01-20 Sold (Public Records) $38,000 Public Records
- 1977-02-01 Sold (Public Records) $28,600 Public Records
Property tax history
+12.7%/yrLatest (2025): $2,232 · -0.9% YoY. Source: county tax records.
Cash-flow waterfall
monthlySold comps — $/sqft
last 12 mo · ≤1 miLoading sold comps…