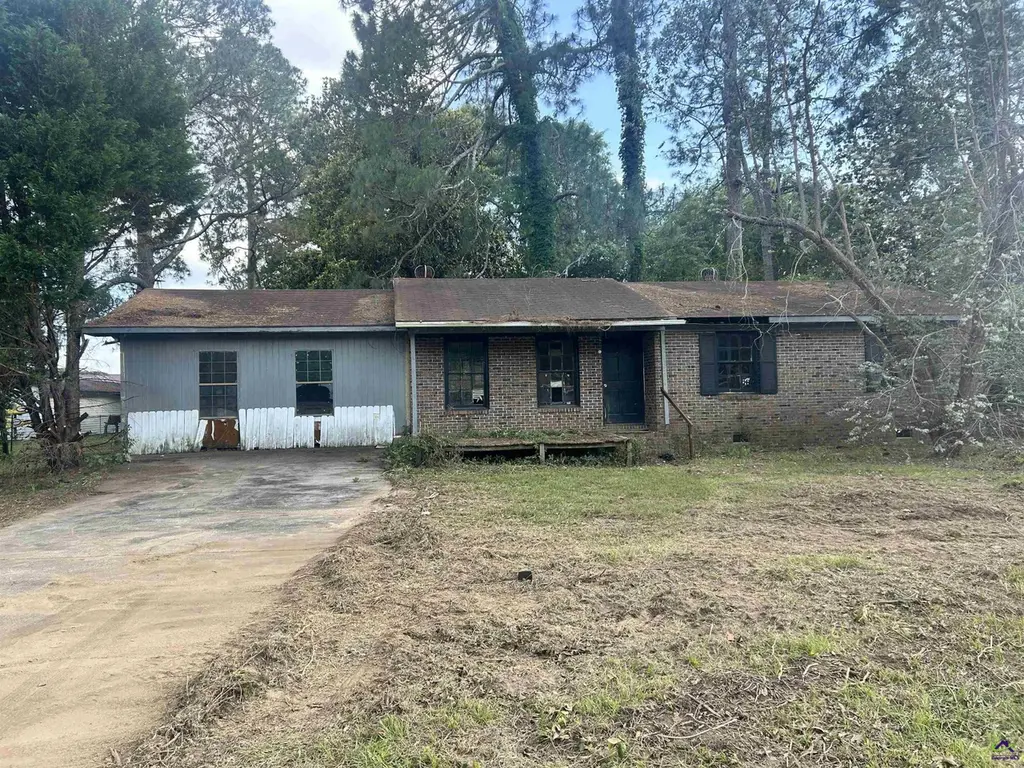
102 Brown Dr · Centerville, GA
Flood risk 1/10 · Minimal
- FEMA flood zone
- X (unshaded)
- Chance of flooding over 30 yrs
- 0.0%
- Est. flood insurance / yr
- $507 – $1,088
Fire risk 4/10 · Minor
- Est. fire insurance / yr
- $963 – $1,789
Heat risk 7/10 · Major
- Hot days now (above 107°F)
- 7 days/yr
- Hot days in 30 yrs
- 18 days/yr
Wind risk 6/10 · Moderate
- Chance of severe wind over 30 yrs
- 72.0%
Air-quality risk 3/10 · Minor
- Unhealthy air days now
- 2 days/yr
- Unhealthy air days in 30 yrs
- 3 days/yr
Risk factors via First Street. Map © Google.
Why this score? — see what drove the B grade
The composite is a weighted blend of 9 inputs, each scored 0–100. Each bar is that input's sub-score; the figure is the points it added to the 100-point composite (weight × sub-score).
- Cash flow +30.0/30.0
- 1% rule +10.0/10.0
- DSCR +10.0/10.0
- ARV discount +7.5/15.0
- Schools +3.9/10.0
- Livability +3.7/5.0
- Rent growth +3.2/5.0
- Condition / age +2.5/5.0
- Appreciation +0.0/10.0
$99,900
🖨 Deal sheet 📄 Offer letter ✓ Due diligence
Listing remarks MLS
Calling all investors and visionaries -- here's your next fix-and-flip opportunity! Check out this four-bedroom, one-bath home ready for a complete transformation to today's modern standards. Featuring a great floor plan, spacious backyard, and tons of potential, this property is the perfect canvas for your next renovation project. Conveniently located in the heart of Warner Robins, you'll love being close to shopping, dining, and everyday conveniences. Bring your ideas and turn this diamond in the rough into something special!
Key facts
- Spacious backyard
- Close to dining
- Great floor plan
Tags
Property features AI
Finance
- Other: Lot about 0.51 acres
- HOA & community: No homeowners association; No community features
Exterior
- Parking: Open parking; Parking pad
- Utilities: Public water available; Septic tank for sewer; Electricity available; Cable available; High-speed internet available; Phone service available; Sewer available
- Home design: Single-family residence; House structure; Resale property
- Construction: Built in 1974; Brick and wood siding exterior; Composition roof
- Exterior features: City lot
Interior
- Kitchen: No appliances included
- Bedrooms: Four bedrooms (all on the main level)
- Flooring: Other flooring
- Bathrooms: One full bathroom; One half bathroom
- Heating & cooling: No heating; No cooling
- Interior features: Other interior features; One-level living
- Laundry & utility: Common area laundry
Neighborhood map
What this means for you Summary
Snapshot
- This is a 3-bed/2.0-bath single-family listed at $100k.
Deal economics
- At list price, monthly cash flow is $688 ($8k/yr) — positive.
- The deal already cash-flows at list — no discount required.
- Meets the 1% rule at list price ($2k rent vs $100k).
- Cap rate 14.6% vs local median 5.8% in Centerville — top-decile yield for the area; either an underpriced asset or a hidden risk that comps aren't pricing in. Stress-test before assuming the spread holds.
Location & tenants
- Location reads 73/100 on livability (#56 in GA) — a middle-class / working-renter tenant base. Strengths: cost of living A+, housing A+, health & safety A-; Watch: amenities F, commute F.
- Houston County (urban): math 43% / reading 46% proficiency, ranked #23 of 174 in GA (top 13%) — families likely to look elsewhere, expect single-tenant / working-renter base with shorter leases.
- Zoned schools: Centerville Elementary School (math 50% / reading 49%, grade D, #264 of 1,228 statewide, top 23%, 630 students, 84% FRL); Thomson Middle School (math 29% / reading 34%, grade F, #234 of 470 statewide, top 50%, 736 students, 84% FRL); Northside High School (math 5% / reading 21%, grade F, #331 of 424 statewide, top 78%, 1,959 students, 84% FRL) — zoned schools average 84% FRL vs 46% district-wide (38 pts higher); higher-poverty schools than district average — tighter screening recommended.
- Zoned-school proficiency averages 31% at this address vs 44% district-wide (-13 pts) — the specific schools serving this property underperform the Houston County average; the district grade overstates school quality for this exact location.
- Market conditions: Rents rising (+2.8%/yr); 161 active listings in the ZIP; 16 comparable units currently listed for rent nearby; rentals at typical pace (median 21d on market — plan ~3-4 weeks tenant-placement turnaround); 44% of comp listings sitting > 30 days — soft ceiling on asking rent; 1,545 units permitted in Houston County in 2024 (336 in 5+ unit buildings).
- This rent runs 44% of the median local income ($46k/yr) — at the standard rent-burdened threshold; future hikes will face affordability resistance.
Forward outlook
- Local home prices are declining (-3.0%/yr); year-one equity from $691 of loan paydown is wiped out by about $3k of value loss. Plan a longer hold.
- Houston County population projected at +22% by 2050 — long-run rental-demand tailwind backs the buy-and-hold thesis.
- At projected returns (-3.0% appreciation + 2.8% rent growth), your $28k cash investment doubles in ~5 years — after that, you're playing with house money.
Negotiation context
- Only 7 days on market — expect competitive offers; lowballing is unlikely to land.
- 3 sale attempts with the ask held roughly flat each time — persistent listings suggest the price (not the market) is what's stuck; bring a comps-based counter.
- Current owner paid $42k; list at $100k implies a 138% gain — meaningful room to come down on a strong offer.
Risks & watch-outs
- Climate carrying-cost: major wind risk, 72% chance of damaging wind over 30y; extreme-heat days projected 7→18/yr by 2055 (HVAC capex compounding) — expect insurance premiums to compound above CPI over the hold.
Questions for the listing agent
- Built in 1974 — when were the roof, HVAC, electrical panel, plumbing, and water heater last replaced?
- Is there a deadline driving the sale (1031 exchange, divorce, estate, relocation)? That informs how much negotiation room exists.
- What's the average days-on-market for RENTAL listings here right now (not sales)? A rising rental-DOM trend means longer vacancies and softer asking-rent achievability than the comps imply.
- What's the recent tenant-quality profile in this submarket — average credit score on applications, eviction rate, late-payment / NSF rate, and stable-employment percentage? A property-management company in the area should have these aggregated.
- How much new for-sale + rental construction is in the pipeline within 1–3 miles? Heavy new supply typically softens prices + rents 12–24 months out; constrained supply supports both.
Investment metrics
- 1% rule
- 1.68% ✓
- Cap rate
- 14.55%
- Cash-on-cash
- 29.50%
- DSCR
- 2.31
- GRM
- 5.0
CMA / ARV
- ARV (on-the-fly)
- $260,919
- Comps found
- 12
Show comp detail 12 sales within ~0.75 mi
| Address | Dist | Beds/Ba | Sqft | Sold | Price | $/sf | Match |
|---|---|---|---|---|---|---|---|
| 227 Crestwood Cir | 0.08mi | 3/2.0 | 1,652 (+1%) | 1mo | $170,000 | $103 | 94 |
| 210 Webb St | 0.53mi | 3/2.0 | 1,600 (-2%) | 2mo | $235,000 | $147 | 70 |
| 303 Woodhaven Rd | 0.57mi | 3/2.0 | 1,584 (-4%) | 0mo | $218,000 | $138 | 67 |
| 107 Chris Dr | 0.55mi | 3/2.0 | 1,736 (+6%) | 1mo | $90,000 | $52 | 64 |
| 110 Monteigo Ct | 0.52mi | 3/2.0 | 1,754 (+7%) | 4mo | $215,000 | $123 | 60 |
| 114 Collins Estate Ave | 0.42mi | 3/2.0 | 1,817 (+11%) | 4mo | $309,900 | $171 | 60 |
| 200 Collins Estate Ave | 0.39mi | 4/2.0 (+1) | 1,812 (+10%) | 2mo | $289,900 | $160 | 57 |
| 114 Collins Estate Ave | 0.42mi | 4/2.0 (+1) | 1,817 (+11%) | 4mo | $309,900 | $171 | 54 |
| 205 Scarborough Rd | 0.69mi | 3/2.0 | 1,761 (+7%) | 2mo | $225,000 | $128 | 54 |
| 402 Collins Estate Ave | 0.36mi | 4/2.0 (+1) | 1,850 (+13%) | 4mo | $295,000 | $159 | 54 |
| 218 Valencia Cir | 0.47mi | 3/2.0 | 1,400 (-15%) | 3mo | $235,000 | $168 | 51 |
| 115 Wray St | 0.73mi | 3/2.0 | 1,427 (-13%) | 4mo | $235,000 | $165 | 41 |
Match score weights: distance 35% · size 25% · config 20% · recency 20%. Top-matched comps best support the ARV.
Projected returns pro-forma
-3.0% appreciation · 2.78% rent growth · sell at horizon
- IRR
- 23.7%
- Equity multiple
- 1.97×
- Total profit
- $27,233
- Equity at exit
- $14,895
- IRR
- 31.5%
- Equity multiple
- 3.81×
- Total profit
- $78,569
- Equity at exit
- $8,638
Cash invested: $27,972 (down + closing). Projections, not guarantees.
Landlord ↔ Tenant lean methodology
- Overall (STATE)
- 90 Strongly Landlord-Friendly
- State Georgia
- 90 Strongly Landlord-Friendly · R+3
- County
- — inherits STATE
- City
- — inherits STATE
ZIP-level market 31093
- Rents YoY
- 2.8%
- Active inventory
- 161
- Price-to-rent
- 5.0×
Monthly cashflow live
- Estimated rent
- $1,676 high interval (Pro) →
- Mortgage (P&I)
- −$524
- Tax from tax record
- −$71 /mo · $849/yr
- Insurance
- −$42
- HOA
- −$0
- Vacancy / Maint / Mgmt
- −$352
- Net cashflow
- $688
Break-even live
UW: 25.0% down · 7.5% · 30yr · 1.5% tax · 5.0% vac · 8.0% maint · 8.0% mgmt
Financing live
Cash to close
- Down payment
- $24,975
- Closing costs
- $2,997
- Reserves months
- —
- Total cash needed
- —
Loan-product check · same deal, 3 products live
Conventional
25% down · 7.5% · 30yr
- Down + closing
- —
- Monthly P&I
- —
- Monthly cashflow
- —
- DSCR
- —
- Eligible?
- —
Personal DTI + credit; lowest rate.
DSCR
20% down · 8.5% · 30yr
- Down + closing
- —
- Monthly P&I
- —
- Monthly cashflow
- —
- DSCR
- —
- Eligible?
- —
No personal income docs; deal must DSCR.
Hard money
10% down · 12.0% · 12mo
- Down + closing
- —
- Monthly P&I
- —
- Monthly cashflow
- —
- DSCR
- —
- Eligible?
- —
Short-term bridge; refi at stabilization.
Rent comps 16 comps
| Address | Beds | Baths | Sqft | Rent | $/sqft | DOM | Units | Dist |
|---|---|---|---|---|---|---|---|---|
| 103 Abney Ct Centerville, GA | 3.0 | 2.0 | 1500 | $1,800 | $1.20 | 21d | 1 | 0.49mi |
| 213 Webb St Warner Robins, GA | 3.0 | 2.0 | 1152 | $1,600 | $1.39 | 21d | 1 | 0.57mi |
| 208 Wray St Warner Robins, GA | 3.0 | 2.0 | 1509 | $1,700 | $1.13 | 13d | 1 | 0.75mi |
| 106 Scarborough Rd Centerville, GA | 3.0 | 2.0 | 1471 | $1,400 | $0.95 | 21d | 1 | 0.80mi |
| 111 Rainbow Ave Warner Robins, GA | 3.0 | 2.0 | 1422 | $1,695 | $1.19 | 21d | 1 | 0.86mi |
| 111 Rainbow Ave Warner Robins, GA | 3.0 | 2.0 | 1422 | $1,695 | $1.19 | 44d | 1 | 0.86mi |
| 700 Fieldstone Rd Warner Robins, GA | 3.0 | 2.0 | 1339 | $1,625 | $1.21 | 44d | 1 | 0.87mi |
| 210 Surrey Dr Warner Robins, GA | 3.0 | 2.0 | 1620 | $1,600 | $0.99 | 21d | 1 | 0.96mi |
| 111 Hawthorne Rd Warner Robins, GA | 3.0 | 2.0 | 1551 | $1,500 | $0.97 | 44d | 1 | 0.98mi |
| 108 Stonefield Ct Warner Robins, GA | 3.0 | 2.0 | 1483 | $1,475 | $0.99 | 44d | 1 | 0.99mi |
| 431 Sentry Oak Dr Centerville, GA | 3.0 | 2.0 | 1312 | $1,695 | $1.29 | 44d | 1 | 1.07mi |
| 501 Pinecrest Dr Warner Robins, GA | 4.0 | 2.0 | 1818 | $2,100 | $1.16 | 44d | 1 | 1.08mi |
| 104 Woodcarver Trl Warner Robins, GA | 3.0 | 2.0 | 1300 | $1,600 | $1.23 | 13d | 1 | 1.16mi |
| 105 Arnold St Centerville, GA | 2.0 | 1.5 | 1122 | $1,295 | $1.15 | 13d | 1 | 1.25mi |
| 203 Lumpkin Dr Warner Robins, GA | 3.0 | 3.0 | 1700 | $2,200 | $1.29 | 44d | 1 | 1.30mi |
| 117 Wingate Cir Warner Robins, GA | 2.0 | 1.5 | 1155 | $1,425 | $1.23 | 21d | 1 | 1.49mi |
Listing history 4 events
-
2026-05-20$99,900 Active 533-char remark
Show marketing remark (556 chars)
Calling all investors and visionaries — here’s your next fix-and-flip opportunity! Check out this four-bedroom, one-bath home ready for a complete transformation to today’s modern standards. Featuring a great floor plan, spacious backyard, and tons of potential, this property is the perfect canvas for your next renovation project. Conveniently located in the heart of Warner Robins, you’ll love being close to shopping, dining, and everyday conveniences. Bring your ideas and turn this diamond in the rough into something special!
-
2026-05-20$99,900 Active 556-char remark
Show marketing remark (556 chars)
Calling all investors and visionaries — here’s your next fix-and-flip opportunity! Check out this four-bedroom, one-bath home ready for a complete transformation to today’s modern standards. Featuring a great floor plan, spacious backyard, and tons of potential, this property is the perfect canvas for your next renovation project. Conveniently located in the heart of Warner Robins, you’ll love being close to shopping, dining, and everyday conveniences. Bring your ideas and turn this diamond in the rough into something special!
-
2026-05-19$99,900 New
-
1983-03-05soldstatus $42,000
ⓘ Source: listings_history table (triggers on properties + properties_extension) + one-shot
backfill from property_details.listing_events for pre-trigger history.
Tax reassessment forecast GA · Resets to sale price
- Current annual tax
- $849 · $71/mo
- Projected year-2 tax
- $919 · $77/mo
- Expected delta
- +$70/yr (+$6/mo · 8.2%)
ⓘ Screening estimate from a state-policy table — verify with the county assessor before closing.
Climate risk First Street
- Flood 1/10 Low FEMA zone X (unshaded) · 0% chance over 30 yrs
- Wildfire 4/10 Moderate
- Heat 7/10 Severe 7 d/yr ≥107°F today · 18 d/yr by 30 yrs out
- Wind 6/10 Major 72% chance of damaging wind over 30 yrs
- Air quality 3/10 Moderate 2 unhealthy d/yr today · 3 by 30 yrs out
Nearby sold comps map
Loading sold comps map…
Walkable amenities ~0.75 mi
Loading nearby amenities…
Taxation est. · year 1
- Rental income
- $20,111
- − Mortgage interest
- −$5,596
- − Property taxes
- −$849
- − Insurance
- −$500
- − Repairs & maintenance
- −$1,609
- − Management
- −$1,609
- − Depreciation
- −$2,906
- Taxable income
- $7,042
- Est. tax owed @ 24.0%
- −$1,690
- After-tax cash flow
- $6,562/yr
For passive investors: Depreciation is non-cash, so a rental often shows a tax loss while cash-flowing — sheltering income. Rental losses are passive: they offset passive income freely, and up to $25,000/yr can offset ordinary (W-2) income if you actively participate and your MAGI is under $100k (phasing out to $0 by $150k); unused losses carry forward. On sale, claimed depreciation is recaptured at up to 25%, and gains may owe capital-gains tax (a 1031 exchange can defer both). Figures are a year-1 estimate at your 24.0% rate — not tax advice; consult a CPA.
Schools (NCES district)
- District
- Houston County
- NCES district ID
- 1302880
- Math proficiency
- 43% ▼ -7.00%
- Reading proficiency
- 46% ▼ -2.00%
- Median HH income
- $54,823
- Composite
- 38.68/100
- National rank
- #4144
- State rank
- #23 of 174 in GA
Livability — Centerville
- Score
- 73/100
- State rank
- #56
- US rank
- #5374
Category grades
Schools grade is shown separately in the Schools card above.
Census & demographics
- County
- Houston County · 157,321 people
- City population
- 6,312
- Metro
- Warner Robins, GA
- Population (ZIP)
- 26,872
- Household income
- $45,991
- Rent vs Own
- Severe rent burden
- 1516.0
Population outlook (Houston County) Hauer SSP2
- Today (2025)
- 169,502 people
- By 2030
- 178,486 · +5.3%
- By 2040
- 194,642 · +14.8%
- By 2050
- 207,119 · +22.2%
- By 2075
- 231,480 · +36.6%
- By 2100
- 235,034 · +38.7%
Race, ethnicity, and origin ACS 2023
- Neighborhood character
- Diverse neighborhood (Simpson 0.64)
- Race & ethnicity
- Black 47% White 35% Hispanic / Latino 10% Two or more races 7% Asian 1%
- Hispanic origin (detail)
- Mexican 5%
- Common ancestry
- Iranian 1% Serbian 1% Italian 1%
- Foreign-born
- 6% · Canada, Vietnam, South Korea
- Languages at home
- 91% English-only · Spanish 8%
Political lean MEDSL · Houston
- 2024 margin
- R (+11.3) · D 44.0% · R 55.3%
- 2008→2024 swing
- +8.9pp toward D · 2008: -20.2pp · 2024: -11.3pp
- All cycles
- 2024: R+11.3 2020: R+12.4 2016: R+21.6 2012: R+20.7 2008: R+20.2
Not yet ingested
- Civics
- —
Market trends
- HPI YoY
- ▼ -130.35%
- Current HPI
- 222.1627
- Rent YoY
- ▲ 2.78%
- Metro
- Warner Robins, GA
- State GDP YoY
- ▲ 2.66%
- F500 in state
- 28
Industry mix (Fortune 500 HQ in GA)
| Industry | F500 HQs | Revenue |
|---|---|---|
| Paper / Packaging | 2 | $29B |
|
||
| Retail | 1 | $160B |
|
||
| Transportation / Logistics | 1 | $91B |
|
||
| Airlines | 1 | $62B |
|
||
| Consumer Goods | 1 | $47B |
|
||
| Utilities | 1 | $25B |
|
||
Price history
+137.9% since first listed4 events — show timeline
- 2026-05-20 Listed $99,900 CGMLS
- 2026-05-20 Listed $99,900 MGMLS
- 2026-05-19 Listed $99,900 GAMLS
- 1983-03-05 Sold (Public Records) $42,000 Public Records
Property tax history
+1.1%/yrLatest (2025): $849 · -17.8% YoY. Source: county tax records.
Cash-flow waterfall
monthlySold comps — $/sqft
last 12 mo · ≤1 miLoading sold comps…