415 E Erie Dr · Fort Pierce North, FL
Flood risk 1/10 · Minimal
- FEMA flood zone
- X (unshaded)
- Chance of flooding over 30 yrs
- 0.0%
- Est. flood insurance / yr
- $507 – $1,088
Fire risk 1/10 · Minimal
- Est. fire insurance / yr
- $947 – $1,759
Heat risk 10/10 · Severe
- Hot days now (above 106°F)
- 7 days/yr
- Hot days in 30 yrs
- 26 days/yr
Wind risk 10/10 · Severe
- Chance of severe wind over 30 yrs
- 99.0%
Air-quality risk 2/10 · Minimal
- Unhealthy air days now
- 2 days/yr
- Unhealthy air days in 30 yrs
- 2 days/yr
Risk factors via First Street. Map © Google.
Why this score? — see what drove the C- grade
The composite is a weighted blend of 9 inputs, each scored 0–100. Each bar is that input's sub-score; the figure is the points it added to the 100-point composite (weight × sub-score).
- Cash flow +15.0/30.0
- Appreciation +8.0/10.0
- ARV discount +7.5/15.0
- 1% rule +5.0/10.0
- DSCR +5.0/10.0
- Schools +3.7/10.0
- Livability +3.5/5.0
- Rent growth +2.5/5.0
- Condition / age +2.5/5.0
$25,000
🖨 Deal sheet 📄 Offer letter ✓ Due diligence
Listing remarks
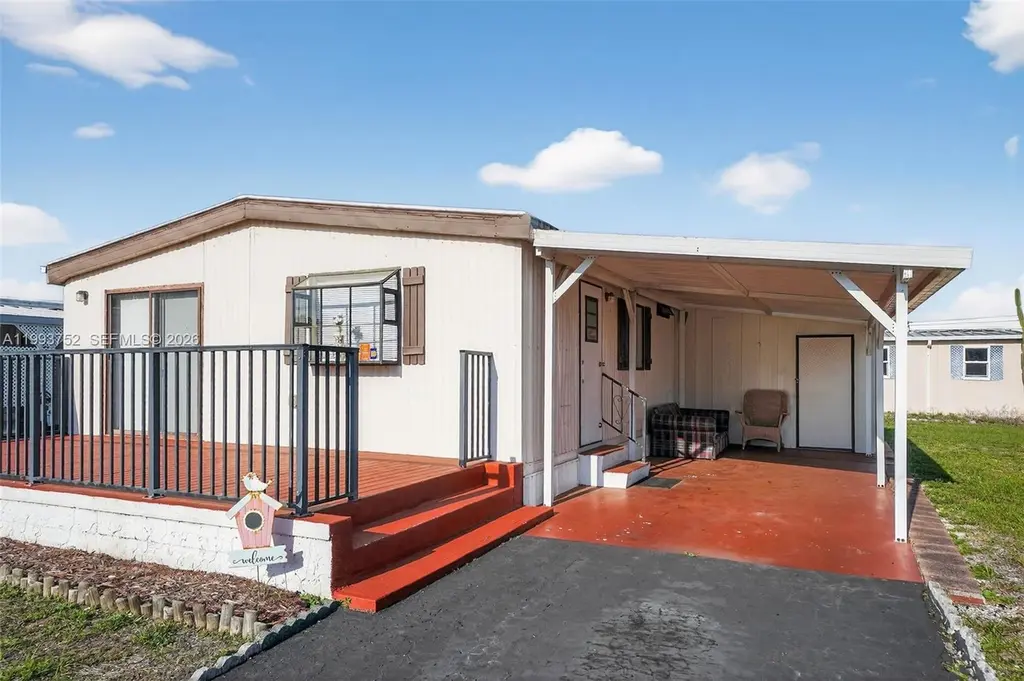
Charming 2 bedroom 1.5 bathroom manufactured home in Fort Pierce. Features laminate flooring throughout, central A/C, and an attached carport. Property also includes a storage shed and washer and dryer. Conveniently located near major roads, shopping, and local amenities. Great opportunity for affordable living or investment. The lot rent for the community is $795/month. Prospective buyers must apply for community approval through Tall Pines at: https://inspirecommunities.com/
Key facts
- Laminate flooring
- Attached carport
- Washer and dryer
Tags
Property features AI
Finance
- HOA & community: Senior community
Exterior
- Parking: Covered parking; Carport (1 space)
- Utilities: Public water; Public sewer and septic tank options
- Home design: Manufactured property; Single-story; Faces east
- Construction: Manufactured construction
- Exterior features: Rectangular lot; No notable exterior features listed
Interior
- Kitchen: Electric range; Refrigerator
- Flooring: Laminate
- Bathrooms: 1 full bathroom; 1 half bathroom
- Heating & cooling: Electric heating; Central air conditioning
- Interior features: Bedroom on main level; First floor entry
- Laundry & utility: Washer; Dryer
Neighborhood map
What this means for you Summary
Snapshot
- This is a 2-bed/1.5-bath manufactured listed at $25k.
Deal economics
- At list price, monthly cash flow is $1k ($15k/yr) — positive.
- The deal already cash-flows at list — no discount required.
- Meets the 1% rule at list price ($2k rent vs $25k).
- Recommended offer: $24k (6.0% below list) — sets the bar for market timing.
- Cap rate 66.6% vs local median 5.1% in Fort Pierce North — top-decile yield for the area; either an underpriced asset or a hidden risk that comps aren't pricing in. Stress-test before assuming the spread holds.
Location & tenants
- Location reads 69/100 on livability (#480 in FL) — a middle-class / working-renter tenant base. Strengths: commute A+, cost of living A+, housing A+; Watch: schools F, amenities F, employment F.
- St. Lucie (urban): math 40% / reading 48% proficiency, ranked #51 of 73 in FL (top 70%) — families likely to look elsewhere, expect single-tenant / working-renter base with shorter leases.
- Market conditions: 133 active listings in the ZIP; 16 comparable units currently listed for rent nearby; rentals at typical pace (median 24d on market — plan ~3-4 weeks tenant-placement turnaround); 4,868 units permitted in St. Lucie County in 2024 (268 in 5+ unit buildings).
Forward outlook
- In year one you build about $2k of equity ($173 loan paydown + $1k appreciation (5.9% local appreciation)).
- St. Lucie County population projected at +20% by 2050 — long-run rental-demand tailwind backs the buy-and-hold thesis.
- At projected returns (5.9% appreciation + 3.0% rent growth), your $7k cash investment doubles in ~1 year — after that, you're playing with house money.
Negotiation context
- It's been on market 65 days — a 6% lower offer ($24k) is reasonable based on typical stale-listing flexibility.
Risks & watch-outs
- Climate carrying-cost: severe wind risk, 99% chance of damaging wind over 30y; extreme-heat days projected 7→26/yr by 2055 (HVAC capex compounding) — expect insurance premiums to compound above CPI over the hold.
Questions for the listing agent
- It's been on market 65 days. Have you received any prior offers? Is the seller open to a 6% concession, seller financing, or rate buy-down credit?
- Built in 1978 — when were the roof, HVAC, electrical panel, plumbing, and water heater last replaced?
- Why hasn't it sold? Are there any deal-killer items the seller is aware of (foundation, flood, title, zoning, code violations)?
- Is there a deadline driving the sale (1031 exchange, divorce, estate, relocation)? That informs how much negotiation room exists.
- Schools are F-rated, which usually means shorter tenancies and higher turnover. Who's the typical renter profile here, and what's been the actual vacancy rate?
- What's the average days-on-market for RENTAL listings here right now (not sales)? A rising rental-DOM trend means longer vacancies and softer asking-rent achievability than the comps imply.
- What's the recent tenant-quality profile in this submarket — average credit score on applications, eviction rate, late-payment / NSF rate, and stable-employment percentage? A property-management company in the area should have these aggregated.
- How much new for-sale + rental construction is in the pipeline within 1–3 miles? Heavy new supply typically softens prices + rents 12–24 months out; constrained supply supports both.
Investment metrics
- 1% rule
- 7.23% ✓
- Cap rate
- 66.58%
- Cash-on-cash
- 215.30%
- DSCR
- 10.58
- GRM
- 1.2
CMA / ARV
No comps found within radius.
Projected returns pro-forma
5.92% appreciation · 3.0% rent growth · sell at horizon
- IRR
- —
- Equity multiple
- 13.45×
- Total profit
- $87,119
- Equity at exit
- $15,591
- IRR
- —
- Equity multiple
- 28.67×
- Total profit
- $193,708
- Equity at exit
- $28,166
Cash invested: $7,000 (down + closing). Projections, not guarantees.
Landlord ↔ Tenant lean methodology
- Overall (STATE)
- 87 Strongly Landlord-Friendly
- State Florida
- 87 Strongly Landlord-Friendly · R+3
- County
- — inherits STATE
- City
- — inherits STATE
ZIP-level market 34946
- Home prices YoY
- 1.7%
- Active inventory
- 133
- Price-to-rent
- 1.2×
Monthly cashflow live
- Estimated rent
- $1,808 high interval (Pro) →
- Mortgage (P&I)
- −$131
- Tax est. 1.5%
- −$31 /mo · $375/yr
- Insurance
- −$10
- HOA
- −$0
- Vacancy / Maint / Mgmt
- −$380
- Net cashflow
- $1,256
Break-even live
UW: 25.0% down · 7.5% · 30yr · 1.5% tax · 5.0% vac · 8.0% maint · 8.0% mgmt
Financing live
Cash to close
- Down payment
- $6,250
- Closing costs
- $750
- Reserves months
- —
- Total cash needed
- —
Loan-product check · same deal, 3 products live
Conventional
25% down · 7.5% · 30yr
- Down + closing
- —
- Monthly P&I
- —
- Monthly cashflow
- —
- DSCR
- —
- Eligible?
- —
Personal DTI + credit; lowest rate.
DSCR
20% down · 8.5% · 30yr
- Down + closing
- —
- Monthly P&I
- —
- Monthly cashflow
- —
- DSCR
- —
- Eligible?
- —
No personal income docs; deal must DSCR.
Hard money
10% down · 12.0% · 12mo
- Down + closing
- —
- Monthly P&I
- —
- Monthly cashflow
- —
- DSCR
- —
- Eligible?
- —
Short-term bridge; refi at stabilization.
Rent comps 16 comps
| Address | Beds | Baths | Sqft | Rent | $/sqft | DOM | Units | Dist |
|---|---|---|---|---|---|---|---|---|
| 1910 Juanita Ave Fort Pierce, FL | 3.0 | 2.0 | 1100 | $2,000 | $1.82 | 14d | 1 | 0.37mi |
| 2760 Seneca Ave Fort Pierce, FL | 2.0 | 1.0 | 837 | $1,500 | $1.79 | 23d | 1 | 0.43mi |
| 2809 Jefferson Pkwy Unit A Fort Pierce, FL | 3.0 | 1.0 | 1350 | $2,100 | $1.56 | 14d | 1 | 0.74mi |
| 1710 N 21st St Fort Pierce, FL | 3.0 | 1.0 | 968 | $2,100 | $2.17 | 14d | 1 | 0.89mi |
| 1601 N 17th St Fort Pierce, FL | 2.0 | 1.0 | 996 | $1,650 | $1.66 | 23d | 1 | 0.98mi |
| 1610 N 25th St Unit 1 Fort Pierce, FL | 2.0 | 1.0 | 740 | $1,600 | $2.16 | 14d | 1 | 1.04mi |
| 1610 N 25th St Unit 10 Fort Pierce, FL | 2.0 | 1.0 | 740 | $1,600 | $2.16 | 23d | 1 | 1.04mi |
| 1610 N 25th St Unit 13 Fort Pierce, FL | 2.0 | 1.0 | 740 | $1,550 | $2.09 | 23d | 1 | 1.04mi |
| 3101 Avenue T Fort Pierce, FL | 2.0 | 2.0 | 1064 | $1,980 | $1.86 | 23d | 1 | 1.10mi |
| 1408 N 23rd St Fort Pierce, FL | 3.0 | 1.0 | 1110 | $1,900 | $1.71 | 14d | 1 | 1.12mi |
| 1308 N 21st St Apt A Fort Pierce, FL | 2.0 | 1.0 | 1200 | $1,499 | $1.25 | 23d | 1 | 1.15mi |
| 3002 Avenue Q Fort Pierce, FL | 2.0 | 1.0 | 864 | $1,900 | $2.20 | 23d | 1 | 1.16mi |
| 1220 Avenue L Unit A Fort Pierce, FL | 3.0 | 1.0 | 850 | $1,700 | $2.00 | 23d | 1 | 1.22mi |
| 1225 Avenue K Fort Pierce, FL | 3.0 | 1.0 | 837 | $1,700 | $2.03 | 23d | 1 | 1.32mi |
| 907 N 20th St Apt B Fort Pierce, FL | 3.0 | 1.0 | 980 | $1,800 | $1.84 | 23d | 1 | 1.40mi |
| 2804 Avenue J Fort Pierce, FL | 3.0 | 1.0 | 816 | $2,000 | $2.45 | 14d | 1 | 1.44mi |
Listing history 13 events
-
2026-06-07days on market $25,000 Active 65 DOM
-
2026-06-05days on market $25,000 Active 62 DOM
-
2026-06-03remarks 482-char remark
-
2026-06-03days on market $25,000 Active 61 DOM
-
2026-06-02days on market $25,000 Active 60 DOM
-
2026-06-01days on market $25,000 Active 59 DOM
-
2026-05-31days on market $25,000 Active 58 DOM
-
2026-05-30days on market $25,000 Active 57 DOM
-
2026-05-22price $25,000
-
2026-05-09price $26,000
-
2026-04-30price $27,000
-
2026-04-22price $29,000
-
2026-04-03$30,000 Active
ⓘ Source: listings_history table (triggers on properties + properties_extension) + one-shot
backfill from property_details.listing_events for pre-trigger history.
Climate risk First Street
- Flood 1/10 Low FEMA zone X (unshaded) · 0% chance over 30 yrs
- Wildfire 1/10 Low
- Heat 10/10 Extreme 7 d/yr ≥106°F today · 26 d/yr by 30 yrs out
- Wind 10/10 Extreme 99% chance of damaging wind over 30 yrs
- Air quality 2/10 Low 2 unhealthy d/yr today · 2 by 30 yrs out
Nearby sold comps map
Loading sold comps map…
Walkable amenities ~0.75 mi
Loading nearby amenities…
Taxation est. · year 1
- Rental income
- $21,702
- − Mortgage interest
- −$1,400
- − Property taxes
- −$375
- − Insurance
- −$125
- − Repairs & maintenance
- −$1,736
- − Management
- −$1,736
- − Depreciation
- −$727
- Taxable income
- $15,602
- Est. tax owed @ 24.0%
- −$3,744
- After-tax cash flow
- $11,327/yr
For passive investors: Depreciation is non-cash, so a rental often shows a tax loss while cash-flowing — sheltering income. Rental losses are passive: they offset passive income freely, and up to $25,000/yr can offset ordinary (W-2) income if you actively participate and your MAGI is under $100k (phasing out to $0 by $150k); unused losses carry forward. On sale, claimed depreciation is recaptured at up to 25%, and gains may owe capital-gains tax (a 1031 exchange can defer both). Figures are a year-1 estimate at your 24.0% rate — not tax advice; consult a CPA.
Schools (NCES district)
- District
- St. Lucie
- NCES district ID
- 1201770
- Math proficiency
- 40% ▼ -11.00%
- Reading proficiency
- 48% ▼ -4.00%
- Median HH income
- $44,737
- Composite
- 37.28/100
- National rank
- #4449
- State rank
- #51 of 73 in FL
Livability — Fort Pierce North
- Score
- 69/100
- State rank
- #480
- US rank
- #8764
Category grades
Schools grade is shown separately in the Schools card above.
Census & demographics
- Census place
- Fort Pierce North, FL
- Population (ZIP)
- 6,588
Population outlook (St. Lucie County) Hauer SSP2
- Today (2025)
- 338,016 people
- By 2030
- 355,687 · +5.2%
- By 2040
- 385,521 · +14.1%
- By 2050
- 406,106 · +20.1%
- By 2075
- 441,054 · +30.5%
- By 2100
- 436,885 · +29.2%
Race, ethnicity, and origin ACS 2023
- Neighborhood character
- Diverse neighborhood (Simpson 0.68)
- Race & ethnicity
- Black 36% Hispanic / Latino 34% White 26% Two or more races 18% Native American 4% Asian 1%
- Hispanic origin (detail)
- Mexican 16% Puerto Rican 2% Cuban 2% Salvadoran 1%
- Common ancestry
- Lithuanian 1% Slovak 1% Portuguese 1%
- Foreign-born
- 25% · Canada, Dominican Republic
- Languages at home
- 70% English-only · Spanish 28% Other Indo-European 1%
Political lean MEDSL · St. Lucie
- 2024 margin
- Lean R (+9.1) · D 45.1% · R 54.2%
- 2008→2024 swing
- -21.2pp toward R · 2008: 12.1pp · 2024: -9.1pp
- All cycles
- 2024: R+9.1 2020: R+1.6 2016: R+2.5 2012: D+7.9 2008: D+12.1
Not yet ingested
- Civics
- —
Market trends
- HPI YoY
- ▲ 5.92%
- Current HPI
- 351.3324
- Rent YoY
- —
- Metro
- —
- State GDP YoY
- ▲ 3.28%
- F500 in state
- 36
Industry mix (Fortune 500 HQ in FL)
| Industry | F500 HQs | Revenue |
|---|---|---|
| Industrial Technology | 2 | $29B |
|
||
| Insurance | 2 | $17B |
|
||
| Retail | 1 | $60B |
|
||
| Technology Distribution | 1 | $58B |
|
||
| Homebuilding | 1 | $35B |
|
||
| Technology Manufacturing | 1 | $35B |
|
||
Price history
-16.7% since first listed5 events — show timeline
- 2026-05-22 Price Changed $25,000 MARMLS
- 2026-05-09 Price Changed $26,000 MARMLS
- 2026-04-30 Price Changed $27,000 MARMLS
- 2026-04-22 Price Changed $29,000 MARMLS
- 2026-04-03 Listed $30,000 MARMLS
Cash-flow waterfall
monthlySold comps — $/sqft
last 12 mo · ≤1 miLoading sold comps…