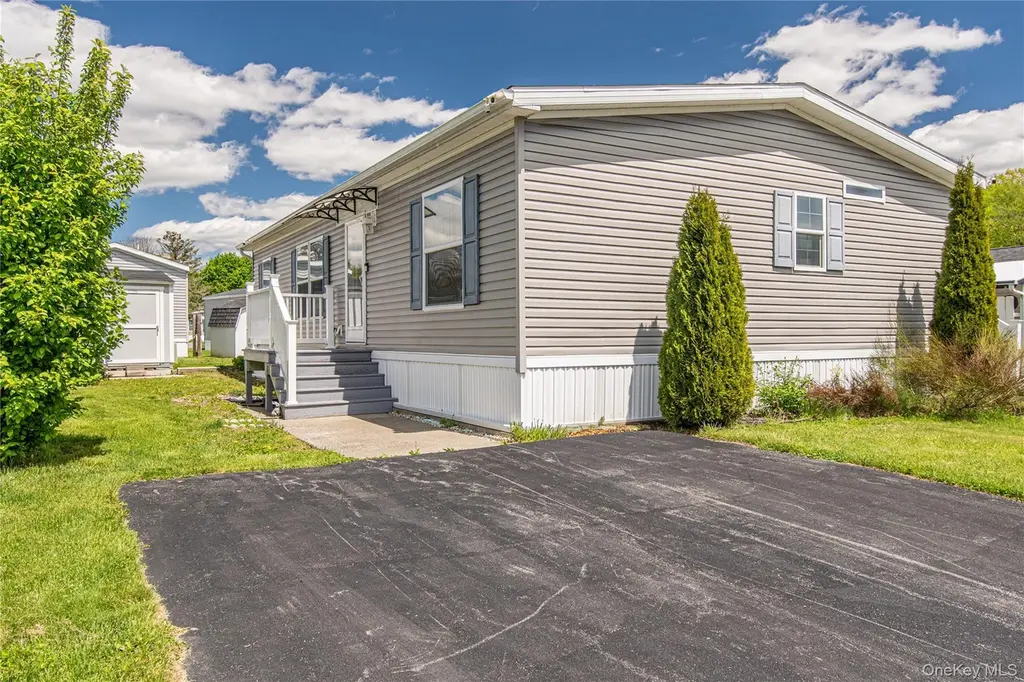
110 Gina Dr · Dover Plains, NY
Flood risk 1/10 · Minimal
- FEMA flood zone
- X (unshaded)
- Chance of flooding over 30 yrs
- 0.0%
- Est. flood insurance / yr
- $507 – $1,088
Fire risk 3/10 · Minor
- Est. fire insurance / yr
- $691 – $1,283
Heat risk 4/10 · Minor
- Hot days now (above 96°F)
- 7 days/yr
- Hot days in 30 yrs
- 17 days/yr
Wind risk 4/10 · Minor
- Chance of severe wind over 30 yrs
- 15.0%
Air-quality risk 2/10 · Minimal
- Unhealthy air days now
- 2 days/yr
- Unhealthy air days in 30 yrs
- 2 days/yr
Risk factors via First Street. Map © Google.
Why this score? — see what drove the A- grade
The composite is a weighted blend of 9 inputs, each scored 0–100. Each bar is that input's sub-score; the figure is the points it added to the 100-point composite (weight × sub-score).
- Cash flow +30.0/30.0
- 1% rule +10.0/10.0
- DSCR +10.0/10.0
- Appreciation +10.0/10.0
- ARV discount +7.5/15.0
- Schools +4.0/10.0
- Condition / age +3.8/5.0
- Livability +3.2/5.0
- Rent growth +2.5/5.0
$185,000
🖨 Deal sheet 📄 Offer letter ✓ Due diligence
Listing remarks
Beautifully maintained and absolutely gorgeous double manufactured home offering spacious open-concept living in the desirable Tally Ho 55+ community. This home features a large living room with a cozy electric fireplace and a gourmet kitchen loaded with extras, including refrigerator, dishwasher, microwave, propane stove, abundant cabinetry, and a breakfast island perfect for casual dining and entertaining. The dining area offers additional custom built-in cabinetry with faux granite countertops and its own electric fireplace, creating a warm and inviting atmosphere throughout the home. A separate laundry room with washer/dryer hookups includes a rear entrance leading to a small stairway,
Key facts
- Laundry room
- Gourmet kitchen
- Electric fireplace
Tags
Property features AI
Finance
- HOA & community: Has association; Association fee $823 monthly; Association fee includes water; Senior community
Exterior
- Parking: Driveway
- Utilities: Electricity connected (NYSEG); Shared sewer
- Home design: Manufactured house; Mobile home
- Construction: Vinyl siding construction
- Exterior features: Vinyl siding; Shed(s); Not waterfront
Interior
- Kitchen: Dishwasher; Gas range; Microwave; Refrigerator; Kitchen island; Eat-in kitchen
- Bedrooms: Includes a first floor bedroom
- Bathrooms: 2 full bathrooms
- Heating & cooling: Propane heating; Central air conditioning; 3 fireplaces (living room, bedroom, electric)
- Interior features: First floor bedroom; First floor full bathroom; Built-in features; Ceiling fans; Eat-in kitchen; High ceilings; High speed internet; His and hers closets; Kitchen island; Open floorplan; Primary bathroom; Washer/dryer hookup
- Laundry & utility: Washer; Dryer; Washer/dryer hookup
Neighborhood map
What this means for you Summary
Snapshot
- This is a 2-bed/2.0-bath manufactured listed at $185k. Condition is rated good.
Deal economics
- At list price, monthly cash flow is $781 ($9k/yr) — positive.
- The deal already cash-flows at list — no discount required.
- Meets the 1% rule at list price ($4k rent vs $185k).
- Recommended offer: $179k (3.0% below list) — sets the bar for market timing.
Location & tenants
- Location reads 63/100 on livability (#818 in NY) — a middle-class / working-renter tenant base. Strengths: crime A, cost of living B; Watch: commute C-, housing D+, amenities F.
- Dover Union Free School District (rural): math 44% / reading 48% proficiency, ranked #433 of 590 in NY (top 73%) — families likely to look elsewhere, expect single-tenant / working-renter base with shorter leases.
- Zoned schools: Dover Elementary School (math 33% / reading 44%, grade F, #1,509 of 2,108 statewide, top 72%, 296 students, 71% FRL); Dover Middle School (math 32% / reading 47%, grade F, #418 of 729 statewide, top 59%, 301 students, 68% FRL); Dover High School (math 92% / reading 74%, grade A, #435 of 1,100 statewide, top 40%, 467 students, 59% FRL) — zoned schools average 66% FRL vs 38% district-wide (29 pts higher); higher-poverty schools than district average — tighter screening recommended.
- Market conditions: 36 active listings in the ZIP; 620 units permitted in Dutchess County in 2024 (242 in 5+ unit buildings).
Forward outlook
- In year one you build about $20k of equity ($1k loan paydown + $18k appreciation (10.0% local appreciation)).
- Dutchess County population projected at -11% by 2050 — secular population decline; favor cash flow + early exit over multi-decade hold.
- At projected returns (10.0% appreciation + 3.0% rent growth), your $52k cash investment doubles in ~2 years — after that, you're playing with house money.
- By year 2, paydown + projected appreciation supports a ~$32k cash-out refi (75% LTV) — recoverable capital for the next deal without selling this one.
Negotiation context
- It's been on market 40 days — a 3% lower offer ($179k) is reasonable based on typical stale-listing flexibility.
- 3 sale attempts since 9y ago; this cycle's ask has dropped $10k (5%) from the opening price — seller is motivated, your offer sets the floor, not the list.
Risks & watch-outs
- Watch-outs: HOA is 23% of rent.
Questions for the listing agent
- It's been on market 40 days. Have you received any prior offers? Is the seller open to a 3% concession, seller financing, or rate buy-down credit?
- What does the HOA fee cover, when was the last increase, and are there any pending special assessments or reserve-fund shortfalls?
- Is there a deadline driving the sale (1031 exchange, divorce, estate, relocation)? That informs how much negotiation room exists.
- What's the average days-on-market for RENTAL listings here right now (not sales)? A rising rental-DOM trend means longer vacancies and softer asking-rent achievability than the comps imply.
- What's the recent tenant-quality profile in this submarket — average credit score on applications, eviction rate, late-payment / NSF rate, and stable-employment percentage? A property-management company in the area should have these aggregated.
- How much new for-sale + rental construction is in the pipeline within 1–3 miles? Heavy new supply typically softens prices + rents 12–24 months out; constrained supply supports both.
Investment metrics
- 1% rule
- 1.97% ✓
- Cap rate
- 11.36%
- Cash-on-cash
- 18.10%
- DSCR
- 1.81
- GRM
- 4.2
CMA / ARV
- ARV (median comp)
- $69,833
- List price
- $185,000
- Delta
- 164.92%
- Verdict
- OVERPRICED
- Comps
- 2 within 1.0 mi
Projected returns pro-forma
10.0% appreciation · 3.0% rent growth · sell at horizon
- IRR
- 37.8%
- Equity multiple
- 3.92×
- Total profit
- $151,068
- Equity at exit
- $166,663
- IRR
- 32.7%
- Equity multiple
- 8.85×
- Total profit
- $406,861
- Equity at exit
- $359,414
Cash invested: $51,800 (down + closing). Projections, not guarantees.
Landlord ↔ Tenant lean methodology
- Overall (STATE)
- 15 Strongly Tenant-Friendly
- State New York
- 15 Strongly Tenant-Friendly · D+10
- County
- — inherits STATE
- City
- — inherits STATE
ZIP-level market 12522
- Home prices YoY
- 17.7%
- Active inventory
- 36
- Price-to-rent
- 4.2×
Monthly cashflow live
- Estimated rent
- $3,649 medium interval (Pro) →
- Mortgage (P&I)
- −$970
- Tax est. 1.5%
- −$231 /mo · $2,775/yr
- Insurance
- −$77
- HOA
- −$823
- Vacancy / Maint / Mgmt
- −$766
- Net cashflow
- $781
Break-even live
UW: 25.0% down · 7.5% · 30yr · 1.5% tax · 5.0% vac · 8.0% maint · 8.0% mgmt
Financing live
Cash to close
- Down payment
- $46,250
- Closing costs
- $5,550
- Reserves months
- —
- Total cash needed
- —
Loan-product check · same deal, 3 products live
Conventional
25% down · 7.5% · 30yr
- Down + closing
- —
- Monthly P&I
- —
- Monthly cashflow
- —
- DSCR
- —
- Eligible?
- —
Personal DTI + credit; lowest rate.
DSCR
20% down · 8.5% · 30yr
- Down + closing
- —
- Monthly P&I
- —
- Monthly cashflow
- —
- DSCR
- —
- Eligible?
- —
No personal income docs; deal must DSCR.
Hard money
10% down · 12.0% · 12mo
- Down + closing
- —
- Monthly P&I
- —
- Monthly cashflow
- —
- DSCR
- —
- Eligible?
- —
Short-term bridge; refi at stabilization.
HOA detail
- Monthly dues
- $823 · $9,876/yr
- Likely covers
- electric
Listing history 19 events
-
2026-06-18days on market $185,000 Active 40 DOM
-
2026-06-17days on market $185,000 Active 39 DOM
-
2026-06-16days on market $185,000 Active 38 DOM
-
2026-06-15days on market $185,000 Active 37 DOM
-
2026-06-13days on market $185,000 Active 35 DOM
-
2026-06-12days on market $185,000 Active 34 DOM
-
2026-06-09days on market $185,000 Active 31 DOM
-
2026-06-08days on market $185,000 Active 30 DOM
-
2026-06-07days on market $185,000 Active 29 DOM
-
2026-06-07pricedays on market $185,000 Active 28 DOM
-
2026-06-04days on market $195,000 Active 25 DOM
-
2026-06-02days on market $195,000 Active 24 DOM
-
2026-06-01days on market $195,000 Active 23 DOM
-
2026-05-31days on market $195,000 Active 22 DOM
-
2026-05-09$195,000 Active 1547-char remark
-
2023-01-25historical
-
2022-07-25$168,000
-
2017-10-14historical
-
2017-07-24$94,800
ⓘ Source: listings_history table (triggers on properties + properties_extension) + one-shot
backfill from property_details.listing_events for pre-trigger history.
Climate risk First Street
- Flood 1/10 Low FEMA zone X (unshaded) · 0% chance over 30 yrs
- Wildfire 3/10 Moderate
- Heat 4/10 Moderate 7 d/yr ≥96°F today · 17 d/yr by 30 yrs out
- Wind 4/10 Moderate 15% chance of damaging wind over 30 yrs
- Air quality 2/10 Low 2 unhealthy d/yr today · 2 by 30 yrs out
Nearby sold comps map
Loading sold comps map…
Walkable amenities ~0.75 mi
Loading nearby amenities…
Taxation est. · year 1
- Rental income
- $43,787
- − Mortgage interest
- −$10,363
- − Property taxes
- −$2,775
- − Insurance
- −$925
- − Repairs & maintenance
- −$3,503
- − Management
- −$3,503
- − HOA
- −$9,876
- − Depreciation
- −$5,382
- Taxable income
- $7,460
- Est. tax owed @ 24.0%
- −$1,790
- After-tax cash flow
- $7,583/yr
For passive investors: Depreciation is non-cash, so a rental often shows a tax loss while cash-flowing — sheltering income. Rental losses are passive: they offset passive income freely, and up to $25,000/yr can offset ordinary (W-2) income if you actively participate and your MAGI is under $100k (phasing out to $0 by $150k); unused losses carry forward. On sale, claimed depreciation is recaptured at up to 25%, and gains may owe capital-gains tax (a 1031 exchange can defer both). Figures are a year-1 estimate at your 24.0% rate — not tax advice; consult a CPA.
Condition & rehab AI · 12 photos
This well-maintained mobile home in Tally Ho 55+ community is move-in ready with good curb appeal and interior condition.
Value-add opportunities
- Resale Paint exterior trim — Enhances curb appeal and home value.
- Resale Clean gutters — Improves home's appearance and functionality.
- Rental Replace carpet in bedrooms — Fresh carpet improves tenant satisfaction and reduces maintenance costs.
Renovation cost estimate screening
Value-add ROI direction
- Resale Paint exterior trim — Enhances curb appeal and home value. ↑
- Resale Clean gutters — Improves home's appearance and functionality. ↑
- Rental Replace carpet in bedrooms — Fresh carpet improves tenant satisfaction and reduces maintenance costs. ↑
ⓘ Cost ranges are severity-bucket heuristics (US national rule-of-thumb). Get contractor quotes + a written scope before underwriting a rehab budget.
Schools (NCES district)
- District
- Dover Union Free School District
- NCES district ID
- 3609210
- Math proficiency
- 44% ▼ -8.00%
- Reading proficiency
- 48% ▲ 3.00%
- Median HH income
- $58,267
- Composite
- 40.25/100
- National rank
- #3768
- State rank
- #433 of 590 in NY
Livability — Dover Plains
- Score
- 63/100
- State rank
- #818
- US rank
- #15806
Category grades
Schools grade is shown separately in the Schools card above.
Census & demographics
- Population (ZIP)
- 5,074
Population outlook (Dutchess County) Hauer SSP2
- Today (2025)
- 291,768 people
- By 2030
- 287,131 · -1.6%
- By 2040
- 274,881 · -5.8%
- By 2050
- 259,971 · -10.9%
- By 2075
- 235,366 · -19.3%
- By 2100
- 208,786 · -28.4%
Race, ethnicity, and origin ACS 2023
- Neighborhood character
- Predominantly White (76%)
- Race & ethnicity
- White 76% Hispanic / Latino 14% Two or more races 10% Asian 2% Black 1%
- Hispanic origin (detail)
- Puerto Rican 5% Cuban 2%
- Common ancestry
- Lithuanian 3% Scandinavian 2% Slovak 2%
- Foreign-born
- 12% · Canada, China
- Languages at home
- 85% English-only · Spanish 6% Other Indo-European 4% Chinese 2%
Political lean MEDSL · Dutchess
- 2024 margin
- Lean D (+5.4) · D 52.7% · R 47.3%
- 2008→2024 swing
- -3.2pp toward R · 2008: 8.6pp · 2024: 5.4pp
- All cycles
- 2024: D+5.4 2020: D+9.6 2016: R+1.1 2012: D+6.6 2008: D+8.6
Not yet ingested
- Civics
- —
Market trends
- HPI YoY
- ▲ 39.50%
- Current HPI
- 262.8121
- Rent YoY
- —
- Metro
- —
- State GDP YoY
- ▲ 2.60%
- F500 in state
- 92
Industry mix (Fortune 500 HQ in NY)
| Industry | F500 HQs | Revenue |
|---|---|---|
| Financial Services | 10 | $950B |
|
||
| Consumer Goods | 9 | $162B |
|
||
| Insurance | 4 | $225B |
|
||
| Telecommunications | 2 | $144B |
|
||
| Pharmaceuticals | 2 | $112B |
|
||
| Media / Entertainment | 2 | $69B |
|
||
Price history
+95.1% since first listed6 events — show timeline
- 2026-06-06 Price Changed $185,000 OneKey® MLS as Distributed by MLS Grid
- 2026-05-09 Listed $195,000 OneKey® MLS as Distributed by MLS Grid
- 2023-01-25 Listing Removed — OneKey® MLS as Distributed by MLS Grid
- 2022-07-25 Listed $168,000 OneKey® MLS as Distributed by MLS Grid
- 2017-10-14 Listing Removed — OneKey® MLS as Distributed by MLS Grid
- 2017-07-24 Listed $94,800 OneKey® MLS as Distributed by MLS Grid
Cash-flow waterfall
monthlySold comps — $/sqft
last 12 mo · ≤1 miLoading sold comps…