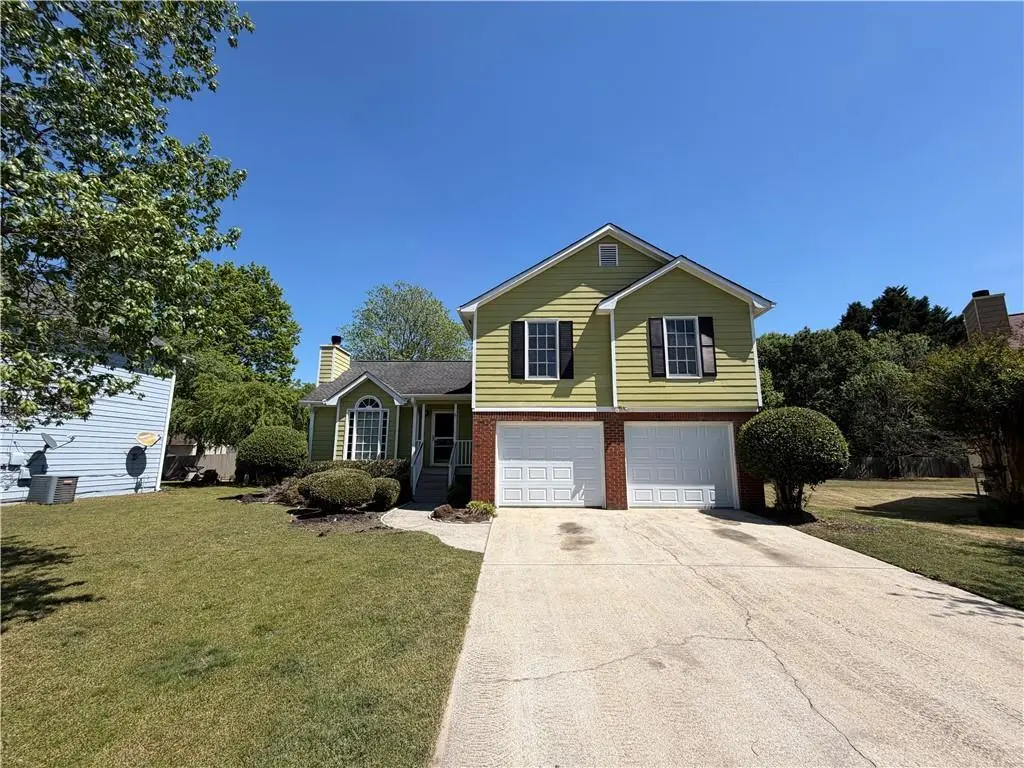
2995 Chesilhurst Ct · Powder Springs, GA
Flood risk 1/10 · Minimal
- FEMA flood zone
- X (unshaded)
- Chance of flooding over 30 yrs
- 0.0%
- Est. flood insurance / yr
- $473 – $860
Fire risk 3/10 · Minor
- Est. fire insurance / yr
- $963 – $1,789
Heat risk 5/10 · Moderate
- Hot days now (above 103°F)
- 7 days/yr
- Hot days in 30 yrs
- 18 days/yr
Wind risk 4/10 · Minor
- Chance of severe wind over 30 yrs
- 21.0%
Air-quality risk 4/10 · Minor
- Unhealthy air days now
- 5 days/yr
- Unhealthy air days in 30 yrs
- 6 days/yr
Risk factors via First Street. Map © Google.
Why this score? — see what drove the D- grade
The composite is a weighted blend of 9 inputs, each scored 0–100. Each bar is that input's sub-score; the figure is the points it added to the 100-point composite (weight × sub-score).
- ARV discount +11.7/15.0
- Cash flow +9.9/30.0
- Schools +3.8/10.0
- Livability +3.6/5.0
- 1% rule +2.9/10.0
- DSCR +2.8/10.0
- Rent growth +2.7/5.0
- Condition / age +2.5/5.0
- Appreciation +0.0/10.0
$299,900
🖨 Deal sheet 📄 Offer letter ✓ Due diligence
Listing remarks MLS
Charming split-level home tucked away on a peaceful cul-de-sac in the desirable Melrose Square community. Step inside to a vaulted great room with a cozy brick fireplace, a formal dining area, and a bright kitchen with ample cabinet space, perfect for everyday living and entertaining. The lower level offers a versatile bonus room with additional living space, while the back deck provides a great spot to relax or host gatherings overlooking the backyard. Upstairs features a spacious primary suite with a large bath, along with two generously sized secondary bedrooms. With solid bones and plenty of potential, this home is ideal for buyers looking to add their personal touch. Being sold as-is, it presents a fantastic opportunity to customize or invest in a rapidly growing area just minutes from shopping, dining, and everything Cobb County has to offer.
Key facts
- Bright kitchen
- Vaulted great room
- Brick fireplace
Tags
Neighborhood map
What this means for you Summary
Snapshot
- This is a 3-bed/2.0-bath single-family listed at $300k.
Deal economics
- At list price, monthly cash flow is $-188 ($-2k/yr) — negative.
- To cash-flow at today's rent, offer at most $267k (11.0% below list).
- To meet the 1% rule (rent ≥ 1% of price), the offer needs to be $236k (21.3% below list).
- Recommended offer: $236k (21.3% below list) — sets the bar for 1% rule.
- Cap rate 5.5% vs local median 3.7% in Powder Springs — top-decile yield for the area; either an underpriced asset or a hidden risk that comps aren't pricing in. Stress-test before assuming the spread holds.
Location & tenants
- Location reads 71/100 on livability (#79 in GA) — a middle-class / working-renter tenant base. Strengths: housing A+, cost of living A, employment B+; Watch: amenities F, commute F.
- Cobb County (suburban): math 39% / reading 45% proficiency, ranked #25 of 174 in GA (top 14%) — families likely to look elsewhere, expect single-tenant / working-renter base with shorter leases.
- Market conditions: Rents flat; 650 active listings in the ZIP; 8 comparable units currently listed for rent nearby; rentals at typical pace (median 24d on market — plan ~3-4 weeks tenant-placement turnaround); high-income renter base; 1,625 units permitted in Cobb County in 2024 (389 in 5+ unit buildings).
Forward outlook
- Local home prices are declining (-3.0%/yr); year-one equity from $2k of loan paydown is wiped out by about $9k of value loss. Plan a longer hold.
- Cobb County population projected at +33% by 2050 — long-run rental-demand tailwind backs the buy-and-hold thesis.
Negotiation context
- It's been on market 45 days — a 3% lower offer ($291k) is reasonable based on typical stale-listing flexibility.
- 9 sale attempts since 15y ago with the ask held roughly flat each time — persistent listings suggest the price (not the market) is what's stuck; bring a comps-based counter.
- Current owner paid $107k; list at $300k implies a 181% gain — meaningful room to come down on a strong offer.
Risks & watch-outs
- Climate carrying-cost: extreme-heat days projected 7→18/yr by 2055 (HVAC capex compounding) — expect insurance premiums to compound above CPI over the hold.
Questions for the listing agent
- What do current leases actually rent for vs. the listed asking? Can we see a recent rent roll and the last 12 months of T-12 income?
- It's been on market 45 days. Have you received any prior offers? Is the seller open to a 21% concession, seller financing, or rate buy-down credit?
- What does the HOA fee cover, when was the last increase, and are there any pending special assessments or reserve-fund shortfalls?
- Is there a deadline driving the sale (1031 exchange, divorce, estate, relocation)? That informs how much negotiation room exists.
- The area grade is low — what's the realistic commute time and amenity access for the typical tenant pool here? Any planned neighborhood developments (good or bad) we should know about?
- What's the average days-on-market for RENTAL listings here right now (not sales)? A rising rental-DOM trend means longer vacancies and softer asking-rent achievability than the comps imply.
- What's the recent tenant-quality profile in this submarket — average credit score on applications, eviction rate, late-payment / NSF rate, and stable-employment percentage? A property-management company in the area should have these aggregated.
- How much new for-sale + rental construction is in the pipeline within 1–3 miles? Heavy new supply typically softens prices + rents 12–24 months out; constrained supply supports both.
Investment metrics
- 1% rule
- 0.79% ✗
- Cap rate
- 5.54%
- Cash-on-cash
- -2.68%
- DSCR
- 0.88
- GRM
- 10.6
CMA / ARV
- ARV (median comp)
- $331,096
- List price
- $299,900
- Delta
- -9.42%
- Verdict
- FAIR
- Comps
- 20 within 1.0 mi
Show comp detail 12 sales within ~0.75 mi
| Address | Dist | Beds/Ba | Sqft | Sold | Price | $/sf | Match |
|---|---|---|---|---|---|---|---|
| 5069 Glendora Dr | 0.06mi | 3/2.0 | 1,998 (+1%) | 6mo | $340,000 | $170 | 92 |
| 5212 Glendora Ct | 0.17mi | 4/2.0 (+1) | 1,792 (-10%) | 6mo | $300,000 | $167 | 66 |
| 3168 Hopeland Ct | 0.36mi | 4/2.5 (+1) | 2,140 (+8%) | 3mo | $377,000 | $176 | 61 |
| 2981 Elberta Ter | 0.30mi | 3/3.0 | 1,730 (-13%) | 2mo | $350,000 | $202 | 59 |
| 5050 Hopeland Dr | 0.40mi | 4/2.5 (+1) | 1,826 (-8%) | 6mo | $345,000 | $189 | 56 |
| 3311 Hillside Dr | 0.74mi | 4/2.0 (+1) | 2,040 (+3%) | 0mo | $340,000 | $167 | 56 |
| 2619 Restoration Dr | 0.47mi | 3/2.0 | 2,267 (+14%) | 0mo | $495,000 | $218 | 54 |
| 3109 Nectar Dr | 0.30mi | 4/3.0 (+1) | 2,215 (+12%) | 5mo | $385,000 | $174 | 54 |
| 4801 Deer Chase | 0.52mi | 3/2.5 | 1,734 (-13%) | 4mo | $335,000 | $193 | 50 |
| 4808 Winding Ln | 0.61mi | 3/2.5 | 1,740 (-12%) | 1mo | $352,500 | $203 | 48 |
| 3383 Lochness Ln | 0.73mi | 3/2.0 | 1,746 (-12%) | 8mo | $300,000 | $172 | 39 |
| 4537 Rushing Wind Ct | 0.66mi | 3/2.5 | 1,711 (-14%) | 7mo | $323,100 | $189 | 38 |
Match score weights: distance 35% · size 25% · config 20% · recency 20%. Top-matched comps best support the ARV.
Projected returns pro-forma
-3.0% appreciation · 0.74% rent growth · sell at horizon
- IRR
- -23.3%
- Equity multiple
- 0.22×
- Total profit
- $-65,766
- Equity at exit
- $44,716
- IRR
- -25.2%
- Equity multiple
- -0.11×
- Total profit
- $-93,132
- Equity at exit
- $25,930
Cash invested: $83,972 (down + closing). Projections, not guarantees.
Landlord ↔ Tenant lean methodology
- Overall (STATE)
- 90 Strongly Landlord-Friendly
- State Georgia
- 90 Strongly Landlord-Friendly · R+3
- County
- — inherits STATE
- City
- — inherits STATE
ZIP-level market 30127
- Rents YoY
- 0.7%
- Active inventory
- 650
- Price-to-rent
- 10.6×
Monthly cashflow live
- Estimated rent
- $2,359 high interval (Pro) →
- Mortgage (P&I)
- −$1,573
- Tax from tax record
- −$346 /mo · $4,158/yr
- Insurance
- −$125
- HOA
- −$7
- Vacancy / Maint / Mgmt
- −$495
- Net cashflow
- $-188
Break-even live
UW: 25.0% down · 7.5% · 30yr · 1.5% tax · 5.0% vac · 8.0% maint · 8.0% mgmt
Financing live
Cash to close
- Down payment
- $74,975
- Closing costs
- $8,997
- Reserves months
- —
- Total cash needed
- —
Loan-product check · same deal, 3 products live
Conventional
25% down · 7.5% · 30yr
- Down + closing
- —
- Monthly P&I
- —
- Monthly cashflow
- —
- DSCR
- —
- Eligible?
- —
Personal DTI + credit; lowest rate.
DSCR
20% down · 8.5% · 30yr
- Down + closing
- —
- Monthly P&I
- —
- Monthly cashflow
- —
- DSCR
- —
- Eligible?
- —
No personal income docs; deal must DSCR.
Hard money
10% down · 12.0% · 12mo
- Down + closing
- —
- Monthly P&I
- —
- Monthly cashflow
- —
- DSCR
- —
- Eligible?
- —
Short-term bridge; refi at stabilization.
Rent comps 8 comps
| Address | Beds | Baths | Sqft | Rent | $/sqft | DOM | Units | Dist |
|---|---|---|---|---|---|---|---|---|
| 4860 Country Cove Way Powder Springs, GA | 3.0 | 2.0 | 1370 | $1,999 | $1.46 | 2d | 1 | 0.22mi |
| 3111 Nectar Dr Powder Springs, GA | 3.0 | 2.0 | 1585 | $2,500 | $1.58 | 43d | 1 | 0.32mi |
| 5306 Yoshino Ter Powder Springs, GA | 4.0 | 2.5 | 2356 | $2,800 | $1.19 | 24d | 1 | 0.46mi |
| 5259 Springtide Ln Powder Springs, GA | 3.0 | 3.0 | 1700 | $1,895 | $1.11 | 22d | 1 | 0.60mi |
| 1199 Paddocks Way Powder Springs, GA | 3.0 | 2.5 | 1505 | $1,661 | $1.10 | 5d | 1 | 0.65mi |
| 1422 Gentry Ct Powder Springs, GA | 3.0 | 2.0 | 1624 | $2,299 | $1.42 | 43d | 1 | 0.95mi |
| 1440 Paddocks Ct Powder Springs, GA | 4.0 | 3.0 | 1920 | $2,400 | $1.25 | 24d | 1 | 1.04mi |
| 4306 Jones Ct Powder Springs, GA | 3.0 | 2.0 | 1776 | $1,980 | $1.11 | 24d | 1 | 1.22mi |
HOA detail
- Monthly dues
- $7 · $84/yr
Listing history 42 events
-
2026-06-07statusdays on market $299,900 Pending 45 DOM
-
2026-06-04days on market $299,900 Active 44 DOM
-
2026-06-03days on market $299,900 Active 43 DOM
-
2026-06-02days on market $299,900 Active 42 DOM
-
2026-06-01days on market $299,900 Active 41 DOM
-
2026-05-31days on market $299,900 Active 40 DOM
-
2026-04-22$310,000 New 861-char remark
Show marketing remark (861 chars)
Charming split-level home tucked away on a peaceful cul-de-sac in the desirable Melrose Square community. Step inside to a vaulted great room with a cozy brick fireplace, a formal dining area, and a bright kitchen with ample cabinet space, perfect for everyday living and entertaining. The lower level offers a versatile bonus room with additional living space, while the back deck provides a great spot to relax or host gatherings overlooking the backyard. Upstairs features a spacious primary suite with a large bath, along with two generously sized secondary bedrooms. With solid bones and plenty of potential, this home is ideal for buyers looking to add their personal touch. Being sold as-is, it presents a fantastic opportunity to customize or invest in a rapidly growing area just minutes from shopping, dining, and everything Cobb County has to offer.
-
2026-04-20$310,000 Active 861-char remark
Show marketing remark (861 chars)
Charming split-level home tucked away on a peaceful cul-de-sac in the desirable Melrose Square community. Step inside to a vaulted great room with a cozy brick fireplace, a formal dining area, and a bright kitchen with ample cabinet space, perfect for everyday living and entertaining. The lower level offers a versatile bonus room with additional living space, while the back deck provides a great spot to relax or host gatherings overlooking the backyard. Upstairs features a spacious primary suite with a large bath, along with two generously sized secondary bedrooms. With solid bones and plenty of potential, this home is ideal for buyers looking to add their personal touch. Being sold as-is, it presents a fantastic opportunity to customize or invest in a rapidly growing area just minutes from shopping, dining, and everything Cobb County has to offer.
-
2026-04-05historical $1,999
-
2026-03-19$1,999
-
2014-12-23price $106,900
-
2014-12-23soldstatus $106,900
-
2014-12-18price $106,900
-
2014-12-16historical
-
2014-12-08historical
-
2014-12-05soldstatus $106,900 Sold
-
2014-12-05price $125,000
-
2014-12-05soldstatus $106,900 Sold
-
2014-12-02status Pending
-
2014-11-24status Under Contract
-
2014-11-24historical Contingent - Due Diligence
-
2014-11-24price $125,000
-
2014-11-17status Back On Market
-
2014-11-17status Active
-
2014-11-08price $59,000
-
2014-11-04status Under Contract
-
2014-11-03status Pending Offer Approval
-
2014-10-31$125,000 New
-
2014-10-31$125,000 Active
-
2013-08-27soldstatus $65,000
-
2012-02-21historical
-
2012-02-16soldstatus $59,000 Sold
-
2012-02-16soldstatus $59,000 Sold
-
2012-01-23historical
-
2012-01-13status Under Contract
-
2012-01-11status Pending
-
2012-01-05price $59,900
-
2011-12-30$59,900 New
-
2011-12-28$59,900 Active
-
2010-09-14price $135,000 Reduced
-
1995-08-02soldstatus $94,500
-
1992-09-09soldstatus $84,900
ⓘ Source: listings_history table (triggers on properties + properties_extension) + one-shot
backfill from property_details.listing_events for pre-trigger history.
Tax reassessment forecast GA · Resets to sale price
- Current annual tax
- $4,158 · $346/mo
- Projected year-2 tax
- $4,158 · $346/mo
- Expected delta
- $0/yr ($0/mo · 0.0%)
ⓘ Screening estimate from a state-policy table — verify with the county assessor before closing.
Climate risk First Street
- Flood 1/10 Low FEMA zone X (unshaded) · 0% chance over 30 yrs
- Wildfire 3/10 Moderate
- Heat 5/10 Major 7 d/yr ≥103°F today · 18 d/yr by 30 yrs out
- Wind 4/10 Moderate 21% chance of damaging wind over 30 yrs
- Air quality 4/10 Moderate 5 unhealthy d/yr today · 6 by 30 yrs out
Nearby sold comps map
Loading sold comps map…
Walkable amenities ~0.75 mi
Loading nearby amenities…
Taxation est. · year 1
- Rental income
- $28,308
- − Mortgage interest
- −$16,799
- − Property taxes
- −$4,158
- − Insurance
- −$1,500
- − Repairs & maintenance
- −$2,265
- − Management
- −$2,265
- − HOA
- −$84
- − Depreciation
- −$8,724
- Taxable loss
- −$7,486
- Est. tax savings @ 24.0%
- +$1,797
- After-tax cash flow
- $-454/yr
For passive investors: Depreciation is non-cash, so a rental often shows a tax loss while cash-flowing — sheltering income. Rental losses are passive: they offset passive income freely, and up to $25,000/yr can offset ordinary (W-2) income if you actively participate and your MAGI is under $100k (phasing out to $0 by $150k); unused losses carry forward. On sale, claimed depreciation is recaptured at up to 25%, and gains may owe capital-gains tax (a 1031 exchange can defer both). Figures are a year-1 estimate at your 24.0% rate — not tax advice; consult a CPA.
Schools (NCES district)
- District
- Cobb County
- NCES district ID
- 1301290
- Math proficiency
- 39% ▼ -15.00%
- Reading proficiency
- 45% ▼ -10.00%
- Median HH income
- $68,845
- Composite
- 37.93/100
- National rank
- #4308
- State rank
- #25 of 174 in GA
Livability — Powder Springs
- Score
- 71/100
- State rank
- #79
- US rank
- #6846
Category grades
Schools grade is shown separately in the Schools card above.
Census & demographics
- County
- Cobb County · 777,758 people
- City population
- 71,626
- Metro
- Atlanta-Sandy Springs-Alpharetta, GA
- Population (ZIP)
- 71,626
- Household income
- $110,904
- Rent vs Own
- Severe rent burden
- 912.0
Population outlook (Cobb County) Hauer SSP2
- Today (2025)
- 868,385 people
- By 2030
- 929,614 · +7.1%
- By 2040
- 1,047,533 · +20.6%
- By 2050
- 1,155,537 · +33.1%
- By 2075
- 1,405,030 · +61.8%
- By 2100
- 1,555,058 · +79.1%
Race, ethnicity, and origin ACS 2023
- Neighborhood character
- Diverse neighborhood (Simpson 0.65)
- Race & ethnicity
- Black 45% White 37% Hispanic / Latino 11% Two or more races 7% Asian 1% Native American 1%
- Hispanic origin (detail)
- Mexican 4% Puerto Rican 2%
- Common ancestry
- Hispanic 2% Italian 1% Lithuanian 1%
- Foreign-born
- 12% · Canada, Vietnam
- Languages at home
- 85% English-only · Spanish 8% French/Haitian/Cajun 2% Other Indo-European 1%
Political lean MEDSL · Cobb
- 2024 margin
- D (+14.9) · D 56.9% · R 42.0% · Other 1.1%
- 2008→2024 swing
- +24.3pp toward D · 2008: -9.4pp · 2024: 14.9pp
- All cycles
- 2024: D+14.9 2020: D+14.3 2016: D+2.1 2012: R+12.6 2008: R+9.4
Not yet ingested
- Civics
- —
Market trends
- HPI YoY
- ▼ -161.28%
- Current HPI
- 222.6123
- Rent YoY
- ▲ 0.74%
- Metro
- Atlanta-Sandy Springs-Alpharetta, GA
- State GDP YoY
- ▲ 2.66%
- F500 in state
- 28
Industry mix (Fortune 500 HQ in GA)
| Industry | F500 HQs | Revenue |
|---|---|---|
| Paper / Packaging | 2 | $29B |
|
||
| Retail | 1 | $160B |
|
||
| Transportation / Logistics | 1 | $91B |
|
||
| Airlines | 1 | $62B |
|
||
| Consumer Goods | 1 | $47B |
|
||
| Utilities | 1 | $25B |
|
||
Price history
+265.1% since first listed36 events — show timeline
- 2026-04-22 Listed $310,000 GAMLS
- 2026-04-20 Listed $310,000 FMLS
- 2026-04-05 Rental Removed $1,999 Tricon
- 2026-03-19 Listed for Rent $1,999 Tricon
- 2014-12-23 Price Changed $106,900 GAMLS
- 2014-12-23 Sold (Public Records) $106,900 Public Records
- 2014-12-18 Price Changed $106,900 FMLS
- 2014-12-16 Listing Removed — FMLS
- 2014-12-08 Listing Removed — GAMLS
- 2014-12-05 Sold (MLS) $106,900 GAMLS
- 2014-12-05 Sold (MLS) $106,900 FMLS
- 2014-12-05 Price Changed $125,000 FMLS
- 2014-12-02 Pending — FMLS
- 2014-11-24 Pending — GAMLS
- 2014-11-24 Contingent — FMLS
- 2014-11-24 Price Changed $125,000 GAMLS
- 2014-11-17 Relisted — GAMLS
- 2014-11-17 Relisted — FMLS
- 2014-11-08 Price Changed $59,000 GAMLS
- 2014-11-04 Pending — GAMLS
- 2014-11-03 Pending — FMLS
- 2014-10-31 Listed $125,000 GAMLS
- 2014-10-31 Listed $125,000 FMLS
- 2013-08-27 Sold (Public Records) $65,000 Public Records
- 2012-02-21 Listing Removed — FMLS
- 2012-02-16 Sold (MLS) $59,000 GAMLS
- 2012-02-16 Sold (MLS) $59,000 FMLS
- 2012-01-23 Listing Removed — GAMLS
- 2012-01-13 Pending — GAMLS
- 2012-01-11 Pending — FMLS
- 2012-01-05 Price Changed $59,900 GAMLS
- 2011-12-30 Listed $59,900 GAMLS
- 2011-12-28 Listed $59,900 FMLS
- 2010-09-14 Price Changed $135,000 GAMLS
- 1995-08-02 Sold (Public Records) $94,500 Public Records
- 1992-09-09 Sold (Public Records) $84,900 Public Records
Property tax history
+8.6%/yrLatest (2025): $4,158 · -5.1% YoY. Source: county tax records.
Cash-flow waterfall
monthlySold comps — $/sqft
last 12 mo · ≤1 miLoading sold comps…