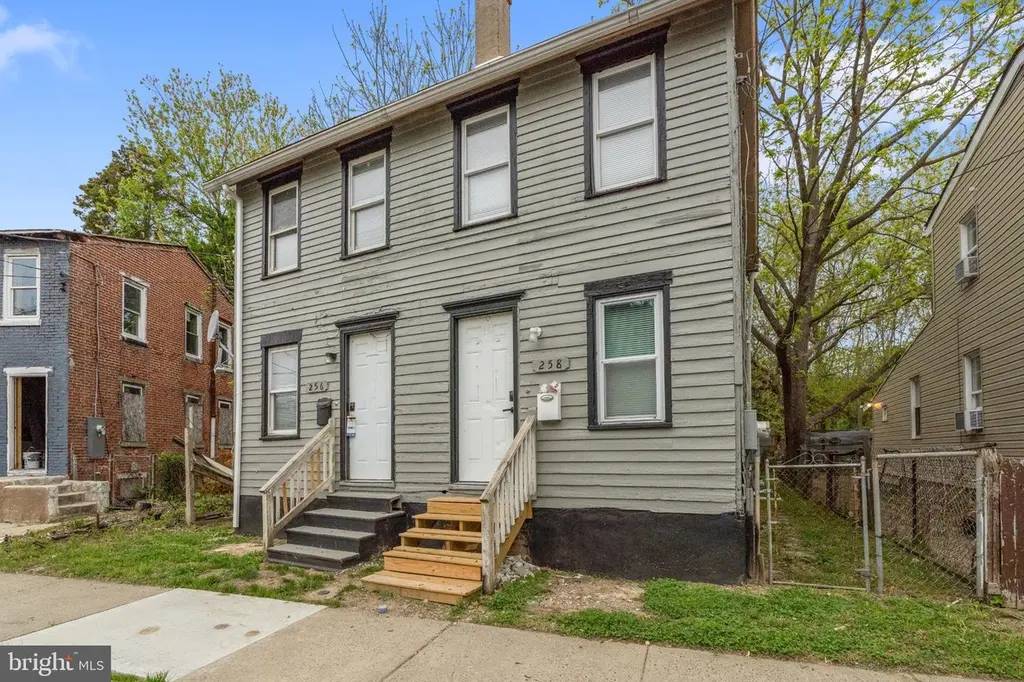
256-258-258 Sinnickson St · Salem, NJ
Flood risk 6/10 · Moderate
- FEMA flood zone
- X (unshaded)
- Chance of flooding over 30 yrs
- 0.56%
- Est. flood insurance / yr
- $507 – $1,088
Fire risk 1/10 · Minimal
- Est. fire insurance / yr
- $526 – $976
Heat risk 7/10 · Major
- Hot days now (above 103°F)
- 7 days/yr
- Hot days in 30 yrs
- 15 days/yr
Wind risk 6/10 · Moderate
- Chance of severe wind over 30 yrs
- 27.0%
Air-quality risk 3/10 · Minor
- Unhealthy air days now
- 2 days/yr
- Unhealthy air days in 30 yrs
- 4 days/yr
Risk factors via First Street. Map © Google.
Why this score? — see what drove the C+ grade
The composite is a weighted blend of 9 inputs, each scored 0–100. Each bar is that input's sub-score; the figure is the points it added to the 100-point composite (weight × sub-score).
- Cash flow +25.3/30.0
- ARV discount +9.2/15.0
- DSCR +8.4/10.0
- 1% rule +7.3/10.0
- Appreciation +4.8/10.0
- Livability +3.1/5.0
- Rent growth +2.5/5.0
- Condition / age +2.5/5.0
- Schools +1.2/10.0
$182,500
🖨 Deal sheet (PDF) 📄 Offer letter ✓ Due diligence
Listing remarks
Prime investment opportunity in the heart of Salem! This side-by-side duplex at 256–258 Sinnickson St offers two generously sized units, each with strong income potential and versatility for both investors and owner-occupants alike. Recently renovated throughout, both units showcase modern upgrades, updated finishes, and are completely move-in ready. Each side features a practical layout with its own private entrance, providing the perfect setup to generate rental income or occupy one unit while leasing the other. Conveniently situated near schools, shopping, public transportation, and major highways, the location supports steady rental demand and future appreciation. Whether you&rsqu
Key facts
- Move-in ready
- Side-by-side duplex
- Updated finishes
Tags
Property features AI
Finance
- Other: Finished above-grade area approximately 1,898
- Financial info: Fee simple ownership
Exterior
- Parking: On-street parking
- Utilities: Natural gas heating and hot water; Public water; Public sewer
- Home design: Semi-detached property; Estimated year built
- Construction: Wood siding; Other type foundation; Above-grade and below-grade structures
- Exterior features: Sidewalks
Interior
- Bedrooms: Three bedrooms on the main level; Three bedrooms on the first upper level
- Bathrooms: Two full bathrooms total (one full on main level, one full on first upper level)
- Heating & cooling: 90% forced air heating; Natural gas hot water
- Interior features: Full basement; Living area per assessor
Neighborhood map
What this means for you Summary
Snapshot
- This is a 6-bed/2.0-bath townhouse listed at $182k.
Deal economics
- At list price, monthly cash flow is $417 ($5k/yr) — positive.
- The deal already cash-flows at list — no discount required.
- Meets the 1% rule at list price ($2k rent vs $182k).
- Recommended offer: $177k (3.0% below list) — sets the bar for market timing.
Location & tenants
- Location reads 61/100 on livability (#462 in NJ) — a middle-class / working-renter tenant base. Strengths: cost of living A+, health & safety A+, crime B; Watch: amenities F, commute F, employment F.
- Salem City School District (town): math 6% / reading 24% proficiency, ranked #464 of 472 in NJ (top 98%) — low school quality limits family demand, transient renter base, plan for 1-2y turnover; 85% free/reduced lunch — lower-income household profile, screen leases tightly.
- Zoned schools: John Fenwick Academy (411 students, 77% FRL).
- Market conditions: 100 active listings in the ZIP; 95 units permitted in Salem County in 2024 (0 in 5+ unit buildings).
- At $2,250/mo this rent would consume 49% of the median local household income ($55k/yr) (locally 663% of renters already pay >50% of income on rent) — very limited rent-growth headroom before tenants either downsize or default.
Forward outlook
- In year one you build about $568 of equity ($1k loan paydown + $-694 appreciation (-0.4% local appreciation)).
- Salem County population projected at -23% by 2050 — secular population decline; favor cash flow + early exit over multi-decade hold.
- At projected returns (-0.4% appreciation + 3.0% rent growth), your $51k cash investment doubles in ~7 years — after that, you're playing with house money.
Negotiation context
- It's been on market 43 days — a 3% lower offer ($177k) is reasonable based on typical stale-listing flexibility.
- 7 sale attempts since 15y ago with the ask held roughly flat each time — persistent listings suggest the price (not the market) is what's stuck; bring a comps-based counter.
- Current owner paid $110k; list at $182k implies a 66% gain — meaningful room to come down on a strong offer.
Risks & watch-outs
- Watch-outs: built in 1920 — expect roof / HVAC / electrical / plumbing capex.
- Climate carrying-cost: major flood risk; major wind risk, 27% chance of damaging wind over 30y; extreme-heat days projected 7→15/yr by 2055 (HVAC capex compounding) — expect insurance premiums to compound above CPI over the hold.
Questions for the listing agent
- It's been on market 43 days. Have you received any prior offers? Is the seller open to a 3% concession, seller financing, or rate buy-down credit?
- Built in 1920 — when were the roof, HVAC, electrical panel, plumbing, and water heater last replaced?
- Is there a deadline driving the sale (1031 exchange, divorce, estate, relocation)? That informs how much negotiation room exists.
- Schools are D-rated, which usually means shorter tenancies and higher turnover. Who's the typical renter profile here, and what's been the actual vacancy rate?
- What's the average days-on-market for RENTAL listings here right now (not sales)? A rising rental-DOM trend means longer vacancies and softer asking-rent achievability than the comps imply.
- What's the recent tenant-quality profile in this submarket — average credit score on applications, eviction rate, late-payment / NSF rate, and stable-employment percentage? A property-management company in the area should have these aggregated.
- How much new for-sale + rental construction is in the pipeline within 1–3 miles? Heavy new supply typically softens prices + rents 12–24 months out; constrained supply supports both.
Investment metrics
- 1% rule
- 1.23% ✓
- Cap rate
- 9.03%
- Cash-on-cash
- 9.79%
- DSCR
- 1.44
- GRM
- 6.8
CMA / ARV
- ARV (on-the-fly)
- $189,800
- Comps found
- 4
Show comp detail 4 sales within ~0.75 mi
| Address | Dist | Beds/Ba | Sqft | Sold | Price | $/sf | Match |
|---|---|---|---|---|---|---|---|
| 64 Eighth St | 0.56mi | 5/1.5 (-1) | 1,894 (-0%) | 11mo | $190,000 | $100 | 58 |
| 15 Oak St | 0.45mi | 5/2.0 (-1) | 2,014 (+6%) | 23mo | $130,000 | $65 | 44 |
| 120 8th St | 0.42mi | 5/1.5 (-1) | 1,660 (-12%) | 11mo | $160,000 | $96 | 43 |
| 62 8th St | 0.56mi | 5/1.5 (-1) | 1,797 (-5%) | 20mo | $190,000 | $106 | 42 |
Match score weights: distance 35% · size 25% · config 20% · recency 20%. Top-matched comps best support the ARV.
Projected returns pro-forma
-0.38% appreciation · 3.0% rent growth · sell at horizon
- IRR
- 7.6%
- Equity multiple
- 1.35×
- Total profit
- $18,070
- Equity at exit
- $49,549
- IRR
- 13.1%
- Equity multiple
- 2.38×
- Total profit
- $70,657
- Equity at exit
- $56,878
Cash invested: $51,100 (down + closing). Projections, not guarantees.
Landlord ↔ Tenant lean methodology
- Overall (STATE)
- 21 Tenant-Leaning
- State New Jersey
- 21 Tenant-Leaning · D+6
- County
- — inherits STATE
- City
- — inherits STATE
ZIP-level market 08079
- Home prices YoY
- -0.1%
- Active inventory
- 100
- Price-to-rent
- 6.8×
Monthly cashflow live
- Estimated rent
- $2,250 medium interval (Pro) →
- Mortgage (P&I)
- −$957
- Tax from tax record
- −$328 /mo · $3,934/yr
- Insurance
- −$76
- HOA
- −$0
- Vacancy / Maint / Mgmt
- −$473
- Net cashflow
- $417
Break-even live
Sensitivity live
| Price | -10% $520 | -5% $469 | +0% $417 | +5% $365 | +10% $314 |
|---|---|---|---|---|---|
| Rent | -10% $239 | -5% $328 | +0% $417 | +5% $506 | +10% $595 |
| Rate | -1.0pp $509 | -0.5pp $463 | base $417 | +0.5pp $370 | +1.0pp $321 |
UW: 25.0% down · 7.5% · 30yr · 1.5% tax · 5.0% vac · 8.0% maint · 8.0% mgmt
Financing live
Cash to close
- Down payment
- $45,625
- Closing costs
- $5,475
- Reserves months
- —
- Total cash needed
- —
Loan-product check · same deal, 3 products live
Conventional
25% down · 7.5% · 30yr
- Down + closing
- —
- Monthly P&I
- —
- Monthly cashflow
- —
- DSCR
- —
- Eligible?
- —
Personal DTI + credit; lowest rate.
DSCR
20% down · 8.5% · 30yr
- Down + closing
- —
- Monthly P&I
- —
- Monthly cashflow
- —
- DSCR
- —
- Eligible?
- —
No personal income docs; deal must DSCR.
Hard money
10% down · 12.0% · 12mo
- Down + closing
- —
- Monthly P&I
- —
- Monthly cashflow
- —
- DSCR
- —
- Eligible?
- —
Short-term bridge; refi at stabilization.
Listing history 30 events
-
2026-06-18days on market $182,500 Active 43 DOM
-
2026-06-17days on market $182,500 Active 42 DOM
-
2026-06-16days on market $182,500 Active 41 DOM
-
2026-06-16price $182,500 Active 40 DOM
-
2026-06-15days on market $185,000 Active 40 DOM
-
2026-06-13days on market $185,000 Active 38 DOM
-
2026-06-13days on market $185,000 Active 37 DOM
-
2026-06-09days on market $185,000 Active 34 DOM
-
2026-06-08days on market $185,000 Active 33 DOM
-
2026-06-07days on market $185,000 Active 32 DOM
-
2026-06-04days on market $185,000 Active 29 DOM
-
2026-06-03days on market $185,000 Active 28 DOM
-
2026-06-02days on market $185,000 Active 27 DOM
-
2026-06-01days on market $185,000 Active 26 DOM
-
2026-05-31days on market $185,000 Active 25 DOM
-
2026-05-06$185,000 Active
-
2026-04-25historical
-
2026-04-24$190,000 Active
-
2016-10-15historical
-
2016-07-07$9,200
-
2016-06-01historical
-
2016-03-01$10,200
-
2015-12-21historical
-
2015-09-22$10,200
-
2013-12-31historical
-
2013-03-25$25,000
-
2012-06-13historical
-
2011-11-12$29,900
-
2008-01-18soldstatus $110,000
-
2004-11-17soldstatus $25,000
ⓘ Source: listings_history table (triggers on properties + properties_extension) + one-shot
backfill from property_details.listing_events for pre-trigger history.
Tax reassessment forecast NJ · Partial reset (capped growth)
- Current annual tax
- $3,934 · $328/mo
- Projected year-2 tax
- $4,239 · $353/mo
- Expected delta
- +$305/yr (+$25/mo · 7.8%)
ⓘ Screening estimate from a state-policy table — verify with the county assessor before closing.
Climate risk First Street
- Flood 6/10 Major FEMA zone X (unshaded) · 56% chance over 30 yrs
- Wildfire 1/10 Low
- Heat 7/10 Severe 7 d/yr ≥103°F today · 15 d/yr by 30 yrs out
- Wind 6/10 Major 27% chance of damaging wind over 30 yrs
- Air quality 3/10 Moderate 2 unhealthy d/yr today · 4 by 30 yrs out
Nearby sold comps map
Loading sold comps map…
Walkable amenities ~0.75 mi
Loading nearby amenities…
Taxation est. · year 1
- Rental income
- $27,005
- − Mortgage interest
- −$10,223
- − Property taxes
- −$3,934
- − Insurance
- −$912
- − Repairs & maintenance
- −$2,160
- − Management
- −$2,160
- − Depreciation
- −$5,309
- Taxable income
- $2,305
- Est. tax owed @ 24.0%
- −$553
- After-tax cash flow
- $4,449/yr
For passive investors: Depreciation is non-cash, so a rental often shows a tax loss while cash-flowing — sheltering income. Rental losses are passive: they offset passive income freely, and up to $25,000/yr can offset ordinary (W-2) income if you actively participate and your MAGI is under $100k (phasing out to $0 by $150k); unused losses carry forward. On sale, claimed depreciation is recaptured at up to 25%, and gains may owe capital-gains tax (a 1031 exchange can defer both). Figures are a year-1 estimate at your 24.0% rate — not tax advice; consult a CPA.
Schools (NCES district)
- District
- Salem City School District
- NCES district ID
- 3414550
- Math proficiency
- 6% ▼ -1.00%
- Reading proficiency
- 24% ▲ 2.00%
- Median HH income
- $27,118
- Composite
- 11.51/100
- National rank
- #9702
- State rank
- #464 of 472 in NJ
Livability — Salem
- Score
- 61/100
- State rank
- #462
- US rank
- #17533
Category grades
Schools grade is shown separately in the Schools card above.
Census & demographics
- Census place
- Salem, NJ
- County
- Salem County · 24,175 people
- City population
- 10,762
- Metro
- Philadelphia-Camden-Wilmington, PA-NJ-DE-MD
- Population (ZIP)
- 10,762
- Household income
- $54,641
- Rent vs Own
- Severe rent burden
- 663.0
Population outlook (Salem County) Hauer SSP2
- Today (2025)
- 59,905 people
- By 2030
- 57,351 · -4.3%
- By 2040
- 51,837 · -13.5%
- By 2050
- 46,356 · -22.6%
- By 2075
- 36,452 · -39.2%
- By 2100
- 28,907 · -51.7%
Race, ethnicity, and origin ACS 2023
- Neighborhood character
- Diverse neighborhood (Simpson 0.55)
- Race & ethnicity
- White 59% Black 31% Hispanic / Latino 6% Two or more races 5% Asian 1%
- Hispanic origin (detail)
- Puerto Rican 5%
- Common ancestry
- Romanian 3% Lithuanian 2% Italian 1%
- Foreign-born
- 2% · Canada
- Languages at home
- 94% English-only · Spanish 4% Tagalog/Filipino 1%
Political lean MEDSL · Salem
- 2024 margin
- R (+19.2) · D 39.6% · R 58.8% · Other 1.6%
- 2008→2024 swing
- -23.1pp toward R · 2008: 3.9pp · 2024: -19.2pp
- All cycles
- 2024: R+19.2 2020: R+12.8 2016: R+15.4 2012: D+0.8 2008: D+3.9
Not yet ingested
- Civics
- —
Market trends
- HPI YoY
- ▼ -0.38%
- Current HPI
- 258.0047
- Rent YoY
- —
- Metro
- Philadelphia-Camden-Wilmington, PA-NJ-DE-MD
- State GDP YoY
- ▲ 2.05%
- F500 in state
- 34
Industry mix (Fortune 500 HQ in NJ)
| Industry | F500 HQs | Revenue |
|---|---|---|
| Consumer Goods | 3 | $31B |
|
||
| Pharmaceuticals | 2 | $153B |
|
||
| Technology | 2 | $21B |
|
||
| Insurance | 2 | $20B |
|
||
| Healthcare | 2 | $19B |
|
||
| Financial Services | 1 | $70B |
|
||
Price history
+640.0% since first listed15 events — show timeline
- 2026-05-06 Listed $185,000 BRIGHT MLS
- 2026-04-25 Listing Removed — BRIGHT MLS
- 2026-04-24 Listed $190,000 BRIGHT MLS
- 2016-10-15 Listing Removed — BRIGHT MLS
- 2016-07-07 Listed $9,200 BRIGHT MLS
- 2016-06-01 Listing Removed — BRIGHT MLS
- 2016-03-01 Listed $10,200 BRIGHT MLS
- 2015-12-21 Listing Removed — BRIGHT MLS
- 2015-09-22 Listed $10,200 BRIGHT MLS
- 2013-12-31 Listing Removed — BRIGHT MLS
- 2013-03-25 Listed $25,000 BRIGHT MLS
- 2012-06-13 Listing Removed — BRIGHT MLS
- 2011-11-12 Listed $29,900 BRIGHT MLS
- 2008-01-18 Sold (Public Records) $110,000 Public Records
- 2004-11-17 Sold (Public Records) $25,000 Public Records
Property tax history
+1.6%/yrLatest (2025): $3,934 · +4.9% YoY. Source: county tax records.
Cash-flow waterfall
monthlySold comps — $/sqft
last 12 mo · ≤1 miLoading sold comps…