2316 Rollins St · Grand Blanc, MI
Flood risk 1/10 · Minimal
- FEMA flood zone
- X (unshaded)
- Chance of flooding over 30 yrs
- 0.0%
- Est. flood insurance / yr
- $507 – $1,088
Fire risk 1/10 · Minimal
- Est. fire insurance / yr
- $784 – $1,456
Heat risk 2/10 · Minimal
- Hot days now (above 96°F)
- 7 days/yr
- Hot days in 30 yrs
- 15 days/yr
Wind risk 2/10 · Minimal
- Chance of severe wind over 30 yrs
- —
Air-quality risk 2/10 · Minimal
- Unhealthy air days now
- 1 days/yr
- Unhealthy air days in 30 yrs
- 3 days/yr
Risk factors via First Street. Map © Google.
Why this score? — see what drove the D grade
The composite is a weighted blend of 9 inputs, each scored 0–100. Each bar is that input's sub-score; the figure is the points it added to the 100-point composite (weight × sub-score).
- Cash flow +11.8/30.0
- ARV discount +10.8/15.0
- Rent growth +4.2/5.0
- Livability +4.1/5.0
- Schools +3.8/10.0
- DSCR +3.5/10.0
- 1% rule +3.3/10.0
- Condition / age +2.5/5.0
- Appreciation +0.0/10.0
$160,000
🖨 Deal sheet 📄 Offer letter ✓ Due diligence
Listing remarks MLS
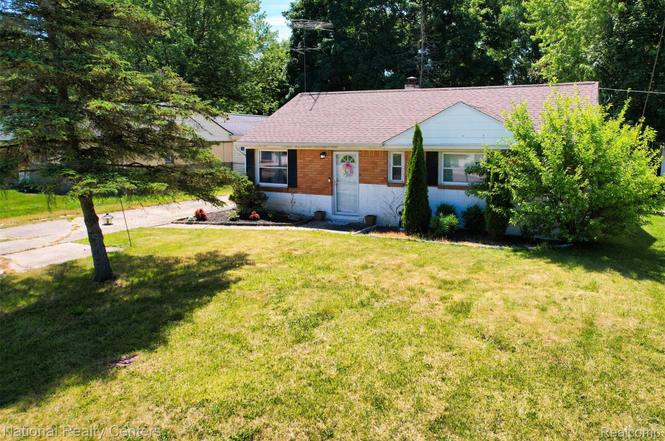
Welcome home to 2316 Rollins Street! This charming ranch sits on a spacious 0.23-acre lot in a quiet neighborhood and features a large, fenced backyard - perfect for entertaining, pets, or simply relaxing outdoors. Whether you're a first-time homebuyer or looking to downsize, this home offers comfort, functionality, and plenty of potential. Inside, you'll find three bedrooms and two full bathrooms, along with a bright and inviting family room that fills with natural light. The galley-style kitchen features newer cabinetry and offers an efficient layout with easy access to the home's private primary suite. Tucked away through a charming entrance nook, the secluded primary bedroom includes its own full bathroom for added privacy. Enjoy added peace of mind with newer windows (2021) and a new roof and gutters (2023). The home also includes a 1.5-car garage and comes complete with the countertop dishwasher, refrigerator, microwave, range, washer, dryer, and two A/C units. Step outside and imagine transforming the backyard patio into the perfect firepit or gathering space for summer evenings with family and friends. With just a few personal touches, this delightful home is ready to make your own. Schedule your showing today and discover all that 2316 Rollins Street has to offer!
Key facts
- Galley-style kitchen
- Newer windows
- New roof and gutters
Tags
Property features AI
Exterior
- Parking: Detached garage; Approximately 1.5 garage spaces
- Utilities: Public water; Public sewer
- Home design: Single-family residence; One story; Ground-level entry; Entry faces ground level
- Construction: Block, brick, and vinyl siding construction; Slab foundation; Built with asphalt roof
- Exterior features: Fenced backyard; Paved road access; Asphalt roof
Interior
- Kitchen: Built-in electric range; Free-standing refrigerator; Microwave; Portable dishwasher
- Bathrooms: Two full bathrooms
- Heating & cooling: Forced air heating (natural gas); Window unit cooling
- Interior features: Built-in electric range; Free-standing refrigerator; Microwave; Portable dishwasher; Washer/dryer stacked; Five total rooms
- Laundry & utility: Stacked washer and dryer
Neighborhood map
What this means for you Summary
Snapshot
- This is a 2-bed/1.5-bath single-family listed at $160k.
Deal economics
- At list price, monthly cash flow is $-45 ($-544/yr) — negative.
- To cash-flow at today's rent, offer at most $152k (5.0% below list).
- To meet the 1% rule (rent ≥ 1% of price), the offer needs to be $133k (16.9% below list).
- Recommended offer: $133k (16.9% below list) — sets the bar for 1% rule.
- Cap rate 6.0% vs local median 2.4% in Grand Blanc — top-decile yield for the area; either an underpriced asset or a hidden risk that comps aren't pricing in. Stress-test before assuming the spread holds.
Location & tenants
- Location reads 82/100 on livability (#56 in MI, #1,077 nationally) — a professional / high-income tenant draw. Strengths: cost of living A+, housing A+, health & safety A+; Watch: commute F.
- Grand Blanc Community Schools (suburban): math 33% / reading 54% proficiency, ranked #149 of 540 in MI (top 28%) — families likely to look elsewhere, expect single-tenant / working-renter base with shorter leases.
- Market conditions: Rents rising fast (+6.8%/yr); 434 active listings in the ZIP; 6 comparable units currently listed for rent nearby; rentals leasing fast (median 13d on market — plan ~1-2 weeks tenant-placement turnaround); solid renter incomes; 419 units permitted in Genesee County in 2024 (68 in 5+ unit buildings).
Forward outlook
- Local home prices are declining (-3.0%/yr); year-one equity from $1k of loan paydown is wiped out by about $5k of value loss. Plan a longer hold.
- Genesee County population projected at -27% by 2050 — secular population decline; favor cash flow + early exit over multi-decade hold.
Negotiation context
- Only 2 days on market — expect competitive offers; lowballing is unlikely to land.
- 12 sale attempts since 21y ago with the ask held roughly flat each time — persistent listings suggest the price (not the market) is what's stuck; bring a comps-based counter.
Risks & watch-outs
- Watch-outs: built in 1951 — expect roof / HVAC / electrical / plumbing capex.
Questions for the listing agent
- What do current leases actually rent for vs. the listed asking? Can we see a recent rent roll and the last 12 months of T-12 income?
- Built in 1951 — when were the roof, HVAC, electrical panel, plumbing, and water heater last replaced?
- Is there a deadline driving the sale (1031 exchange, divorce, estate, relocation)? That informs how much negotiation room exists.
- Schools are B-rated — typically a magnet for longer-tenancy family renters. What's the average tenant stay here, and is there a school-zone premium baked into asking?
- The area grade is low — what's the realistic commute time and amenity access for the typical tenant pool here? Any planned neighborhood developments (good or bad) we should know about?
- What's the average days-on-market for RENTAL listings here right now (not sales)? A rising rental-DOM trend means longer vacancies and softer asking-rent achievability than the comps imply.
- What's the recent tenant-quality profile in this submarket — average credit score on applications, eviction rate, late-payment / NSF rate, and stable-employment percentage? A property-management company in the area should have these aggregated.
- How much new for-sale + rental construction is in the pipeline within 1–3 miles? Heavy new supply typically softens prices + rents 12–24 months out; constrained supply supports both.
Investment metrics
- 1% rule
- 0.83% ✗
- Cap rate
- 5.95%
- Cash-on-cash
- -1.21%
- DSCR
- 0.95
- GRM
- 10.0
CMA / ARV
- ARV (on-the-fly)
- $172,592
- Comps found
- 12
Show comp detail 12 sales within ~0.75 mi
| Address | Dist | Beds/Ba | Sqft | Sold | Price | $/sf | Match |
|---|---|---|---|---|---|---|---|
| 2340 Rollins St | 0.05mi | 3/1.5 (+1) | 1,192 (+11%) | 2mo | $180,000 | $151 | 72 |
| 2253 Russell St | 0.36mi | 2/1.0 | 1,036 (-3%) | 6mo | $151,000 | $146 | 71 |
| 6085 Westdale Dr | 0.45mi | 3/1.0 (+1) | 1,056 (-2%) | 1mo | $173,000 | $164 | 69 |
| 6302 Springdale Blvd | 0.70mi | 2/1.0 | 1,032 (-4%) | 1mo | $130,000 | $126 | 58 |
| 5481 Alexander St | 0.33mi | 3/1.0 (+1) | 968 (-10%) | 5mo | $115,000 | $119 | 57 |
| 5143 Todd St | 0.52mi | 3/2.0 (+1) | 1,133 (+6%) | 4mo | $110,000 | $97 | 56 |
| 6094 Grove Ave | 0.42mi | 3/1.0 (+1) | 1,161 (+8%) | 7mo | $187,000 | $161 | 54 |
| 2278 Chapin St | 0.43mi | 3/2.0 (+1) | 1,228 (+15%) | 0mo | $200,000 | $163 | 48 |
| 6314 Woodsdale Dr | 0.60mi | 3/1.0 (+1) | 960 (-10%) | 8mo | $190,000 | $198 | 41 |
| 6230 Woodsdale Dr | 0.62mi | 3/1.0 (+1) | 960 (-10%) | 7mo | $190,000 | $198 | 41 |
| 6294 Springdale Blvd | 0.70mi | 3/1.5 (+1) | 1,200 (+12%) | 3mo | $123,000 | $103 | 40 |
| 6307 Springdale Blvd | 0.73mi | 3/1.0 (+1) | 912 (-15%) | 6mo | $180,000 | $197 | 29 |
Match score weights: distance 35% · size 25% · config 20% · recency 20%. Top-matched comps best support the ARV.
Projected returns pro-forma
-3.0% appreciation · 6.79% rent growth · sell at horizon
- IRR
- -14.2%
- Equity multiple
- 0.47×
- Total profit
- $-23,538
- Equity at exit
- $23,857
- IRR
- -0.2%
- Equity multiple
- 0.98×
- Total profit
- $-812
- Equity at exit
- $13,834
Cash invested: $44,800 (down + closing). Projections, not guarantees.
Landlord ↔ Tenant lean methodology
- Overall (STATE)
- 62 Landlord-Friendly
- State Michigan
- 62 Landlord-Friendly · EVEN
- County
- — inherits STATE
- City
- — inherits STATE
ZIP-level market 48439
- Rents YoY
- 6.8%
- Active inventory
- 434
- Price-to-rent
- 10.0×
Monthly cashflow live
- Estimated rent
- $1,329 high interval (Pro) →
- Mortgage (P&I)
- −$839
- Tax from tax record
- −$190 /mo · $2,276/yr
- Insurance
- −$67
- HOA
- −$0
- Vacancy / Maint / Mgmt
- −$279
- Net cashflow
- $-45
Break-even live
UW: 25.0% down · 7.5% · 30yr · 1.5% tax · 5.0% vac · 8.0% maint · 8.0% mgmt
Financing live
Cash to close
- Down payment
- $40,000
- Closing costs
- $4,800
- Reserves months
- —
- Total cash needed
- —
Loan-product check · same deal, 3 products live
Conventional
25% down · 7.5% · 30yr
- Down + closing
- —
- Monthly P&I
- —
- Monthly cashflow
- —
- DSCR
- —
- Eligible?
- —
Personal DTI + credit; lowest rate.
DSCR
20% down · 8.5% · 30yr
- Down + closing
- —
- Monthly P&I
- —
- Monthly cashflow
- —
- DSCR
- —
- Eligible?
- —
No personal income docs; deal must DSCR.
Hard money
10% down · 12.0% · 12mo
- Down + closing
- —
- Monthly P&I
- —
- Monthly cashflow
- —
- DSCR
- —
- Eligible?
- —
Short-term bridge; refi at stabilization.
Rent comps 6 comps
| Address | Beds | Baths | Sqft | Rent | $/sqft | DOM | Units | Dist |
|---|---|---|---|---|---|---|---|---|
| 2130 E Hill Rd Grand Blanc, MI | 1.0–3.0 | 1.0–2.5 | 1270 | $1,500 | $1.18 | 13d | 29 | 0.42mi |
| 6066 Dort Hwy Grand Blanc, MI | 3.0 | 1.0 | 1000 | $1,400 | $1.40 | 43d | 1 | 0.55mi |
| 6284 Woodsdale Dr Grand Blanc, MI | 2.0 | 1.0 | 960 | $1,500 | $1.56 | 13d | 1 | 0.62mi |
| 2168 Fox Hill Dr Grand Blanc, MI | 1.0–2.0 | 1.0–2.0 | 885 | $1,254 | $1.42 | 13d | 10 | 0.66mi |
| 5800 Maplebrook Ln Flint, MI | 1.0–3.0 | 1.0–1.5 | 837 | $1,245 | $1.49 | 13d | 70 | 1.35mi |
| 5238 Dunn Hill Dr Grand Blanc, MI | 2.0–3.0 | 1.5 | 1075 | $1,100 | $1.02 | 13d | 1 | 1.41mi |
Listing history 3 events
-
2026-06-18days on market $160,000 Active 2 DOM
-
2026-06-16remarks 693-char remark
-
2026-06-16$160,000 Active 1 DOM
ⓘ Source: listings_history table (triggers on properties + properties_extension) + one-shot
backfill from property_details.listing_events for pre-trigger history.
Tax reassessment forecast MI · Partial reset (capped growth)
- Current annual tax
- $2,276 · $190/mo
- Projected year-2 tax
- $2,370 · $197/mo
- Expected delta
- +$94/yr (+$8/mo · 4.1%)
ⓘ Screening estimate from a state-policy table — verify with the county assessor before closing.
Climate risk First Street
- Flood 1/10 Low FEMA zone X (unshaded) · 0% chance over 30 yrs
- Wildfire 1/10 Low
- Heat 2/10 Low 7 d/yr ≥96°F today · 15 d/yr by 30 yrs out
- Wind 2/10 Low
- Air quality 2/10 Low 1 unhealthy d/yr today · 3 by 30 yrs out
Nearby sold comps map
Loading sold comps map…
Walkable amenities ~0.75 mi
Loading nearby amenities…
Taxation est. · year 1
- Rental income
- $15,950
- − Mortgage interest
- −$8,962
- − Property taxes
- −$2,276
- − Insurance
- −$800
- − Repairs & maintenance
- −$1,276
- − Management
- −$1,276
- − Depreciation
- −$4,655
- Taxable loss
- −$3,295
- Est. tax savings @ 24.0%
- +$791
- After-tax cash flow
- $247/yr
For passive investors: Depreciation is non-cash, so a rental often shows a tax loss while cash-flowing — sheltering income. Rental losses are passive: they offset passive income freely, and up to $25,000/yr can offset ordinary (W-2) income if you actively participate and your MAGI is under $100k (phasing out to $0 by $150k); unused losses carry forward. On sale, claimed depreciation is recaptured at up to 25%, and gains may owe capital-gains tax (a 1031 exchange can defer both). Figures are a year-1 estimate at your 24.0% rate — not tax advice; consult a CPA.
Schools (NCES district)
- District
- Grand Blanc Community Schools
- NCES district ID
- 2616350
- Math proficiency
- 33% ▼ -11.00%
- Reading proficiency
- 54% ▼ -7.00%
- Median HH income
- $59,691
- Composite
- 38.24/100
- National rank
- #4243
- State rank
- #149 of 540 in MI
Livability — Grand Blanc
- Score
- 82/100
- State rank
- #56
- US rank
- #1077
Category grades
Schools grade is shown separately in the Schools card above.
Census & demographics
- County
- Genesee County · 221,329 people
- City population
- 51,900
- Metro
- Flint, MI
- Population (ZIP)
- 51,900
- Household income
- $88,490
- Rent vs Own
- Severe rent burden
- 864.0
Population outlook (Genesee County) Hauer SSP2
- Today (2025)
- 381,312 people
- By 2030
- 362,731 · -4.9%
- By 2040
- 321,550 · -15.7%
- By 2050
- 279,212 · -26.8%
- By 2075
- 193,336 · -49.3%
- By 2100
- 128,118 · -66.4%
Race, ethnicity, and origin ACS 2023
- Neighborhood character
- Predominantly White (76%)
- Race & ethnicity
- White 76% Black 11% Two or more races 6% Hispanic / Latino 4% Asian 3%
- Common ancestry
- Romanian 7% Lithuanian 4% Slovak 3%
- Foreign-born
- 6% · Canada, China
- Languages at home
- 93% English-only · Arabic 2% Other Indo-European 1% Chinese 1%
Political lean MEDSL · Genesee
- 2024 margin
- Toss-up / Even · D 51.4% · R 47.2% · Other 1.4%
- 2008→2024 swing
- -28.3pp toward R · 2008: 32.5pp · 2024: 4.2pp
- All cycles
- 2024: D+4.2 2020: D+9.3 2016: D+9.5 2012: D+28.2 2008: D+32.5
Not yet ingested
- Civics
- —
Market trends
- HPI YoY
- ▼ -193.17%
- Current HPI
- 216.3543
- Rent YoY
- ▲ 6.79%
- Metro
- Flint, MI
- State GDP YoY
- ▲ 1.37%
- F500 in state
- 28
Industry mix (Fortune 500 HQ in MI)
| Industry | F500 HQs | Revenue |
|---|---|---|
| Automotive Parts | 3 | $48B |
|
||
| Automotive | 2 | $372B |
|
||
| Chemicals | 1 | $45B |
|
||
| Automotive Retail | 1 | $29B |
|
||
| Healthcare / Medical Devices | 1 | $23B |
|
||
| Automotive Technology | 1 | $20B |
|
||
Price history
+46.8% since first listed64 events — show timeline
- 2026-06-12 Listed $160,000 MiRealSource-MiMLS
- 2026-06-12 Listed $160,000 REALCOMP
- 2022-11-03 Sold (Public Records) $150,000 Public Records
- 2022-10-26 Pending — REALCOMP
- 2022-10-26 Sold (MLS) $150,000 MiRealSource-MiMLS
- 2022-10-26 Sold (MLS) $150,000 REALCOMP
- 2022-09-23 Contingent — MiRealSource-MiMLS
- 2022-09-23 Contingent — REALCOMP
- 2022-09-16 Listed $154,900 MiRealSource-MiMLS
- 2022-09-16 Listed $154,900 REALCOMP
- 2019-07-16 Sold (MLS) $110,200 MiRealSource-MiMLS
- 2019-07-16 Sold (MLS) $110,200 REALCOMP
- 2019-06-07 Pending — MiRealSource-MiMLS
- 2019-06-07 Pending — REALCOMP
- 2019-06-07 Price Changed $111,900 MiRealSource-MiMLS
- 2019-06-06 Price Changed $111,900 REALCOMP
- 2019-05-30 Price Changed $107,900 MiRealSource-MiMLS
- 2019-05-29 Price Changed $107,900 REALCOMP
- 2019-05-29 Price Changed $108,900 MiRealSource-MiMLS
- 2019-05-29 Price Changed $108,900 REALCOMP
- 2019-05-24 Price Changed $109,900 MiRealSource-MiMLS
- 2019-05-24 Price Changed $109,900 REALCOMP
- 2019-05-18 Relisted — MiRealSource-MiMLS
- 2019-05-17 Relisted — REALCOMP
- 2019-05-16 Pending — MiRealSource-MiMLS
- 2019-05-16 Pending — REALCOMP
- 2019-05-07 Contingent — MiRealSource-MiMLS
- 2019-05-07 Contingent — REALCOMP
- 2019-05-06 Pending — MiRealSource-MiMLS
- 2019-05-06 Pending — REALCOMP
- 2019-05-03 Price Changed $111,900 MiRealSource-MiMLS
- 2019-05-03 Price Changed $111,900 REALCOMP
- 2019-04-29 Price Changed $113,900 MiRealSource-MiMLS
- 2019-04-29 Price Changed $113,900 REALCOMP
- 2019-04-23 Price Changed $115,900 MiRealSource-MiMLS
- 2019-04-23 Price Changed $115,900 REALCOMP
- 2019-04-15 Price Changed $117,999 MiRealSource-MiMLS
- 2019-04-15 Price Changed $117,999 REALCOMP
- 2019-04-11 Price Changed $119,900 MiRealSource-MiMLS
- 2019-04-11 Price Changed $119,900 REALCOMP
- 2019-04-10 Price Changed $121,900 MiRealSource-MiMLS
- 2019-04-10 Price Changed $121,900 REALCOMP
- 2019-04-08 Price Changed $124,900 MiRealSource-MiMLS
- 2019-04-08 Price Changed $124,900 REALCOMP
- 2019-04-08 Relisted — MiRealSource-MiMLS
- 2019-04-08 Relisted — REALCOMP
- 2019-04-06 Pending — MiRealSource-MiMLS
- 2019-04-05 Pending — REALCOMP
- 2019-04-03 Price Changed $127,000 MiRealSource-MiMLS
- 2019-04-02 Price Changed $127,000 REALCOMP
- 2019-04-01 Price Changed $124,900 MiRealSource-MiMLS
- 2019-04-01 Price Changed $124,900 REALCOMP
- 2019-03-22 Price Changed $127,900 MiRealSource-MiMLS
- 2019-03-22 Price Changed $127,900 REALCOMP
- 2019-03-21 Price Changed $129,900 MiRealSource-MiMLS
- 2019-03-21 Price Changed $129,900 REALCOMP
- 2019-03-18 Listed $124,900 MiRealSource-MiMLS
- 2019-03-18 Listed $124,900 REALCOMP
- 2006-04-19 Sold (Public Records) $111,300 Public Records
- 2006-04-03 Sold (MLS) $111,300 MiRealSource-MiMLS
- 2006-04-03 Sold (MLS) $111,300 REALCOMP
- 2006-03-28 Listing Removed — MiRealSource-MiMLS
- 2005-11-08 Listed $109,000 MiRealSource-MiMLS
- 2005-11-08 Listed $109,000 REALCOMP
Property tax history
+5.3%/yrLatest (2025): $2,276 · +4.0% YoY. Source: county tax records.
Cash-flow waterfall
monthlySold comps — $/sqft
last 12 mo · ≤1 miLoading sold comps…