10349 Highway 143 · Claiborne, LA
Flood risk No data
- FEMA flood zone
- —
- Chance of flooding over 30 yrs
- —
- Est. flood insurance / yr
- —
Fire risk No data
- Est. fire insurance / yr
- —
Heat risk No data
- Hot days now (above threshold)
- —
- Hot days in 30 yrs
- —
Wind risk No data
- Chance of severe wind over 30 yrs
- —
Air-quality risk No data
- Unhealthy air days now
- —
- Unhealthy air days in 30 yrs
- —
Risk factors via First Street. Map © Google.
Why this score? — see what drove the B- grade
The composite is a weighted blend of 9 inputs, each scored 0–100. Each bar is that input's sub-score; the figure is the points it added to the 100-point composite (weight × sub-score).
- Cash flow +30.0/30.0
- 1% rule +10.0/10.0
- DSCR +10.0/10.0
- ARV discount +7.5/15.0
- Livability +3.4/5.0
- Rent growth +2.5/5.0
- Condition / age +2.5/5.0
- Schools +1.3/10.0
- Appreciation +0.0/10.0
$130,000
🖨 Deal sheet (PDF) 📄 Offer letter ✓ Due diligence
Listing remarks
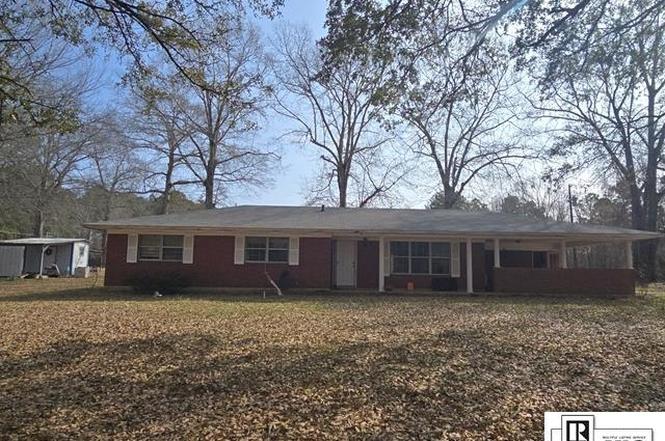
This 3-bedroom, 2-bath home sits on over 2 acres and offers a great opportunity for buyers looking to add their personal touch. With a functional layout, spacious lot, and plenty of potential, this property is ready for updates and improvements to bring it back to life. Whether you are an investor, first-time buyer, or someone looking for room to grow, this home has the foundation for something special. Schedule your showing today and imagine the possibilities.
Key facts
- 2 garage spots
- Built 1968
- Listed 7 days
Property features AI
Finance
- Other: Workshop (other structure)
- HOA & community: No association amenities
Exterior
- Parking: 2-car garage; Has carport
- Security: Security system
- Utilities: Public water; Septic tank; Natural gas available and connected
- Home design: Single-family residence (site build); One story; Entry level: 1
- Construction: Brick veneer construction; Asphalt roof; Slab foundation; Built as a residential single-family home
- Exterior features: Covered patio/porch; No fencing; Irregular lot
Interior
- Kitchen: Gas water heater; Other appliances
- Bedrooms: 3 main-level bedrooms
- Bathrooms: 2 full bathrooms (both on the main level)
- Heating & cooling: Central air conditioning; Other heating
- Interior features: Fireplace with gas log; Security system; Other interior features
- Laundry & utility: Natural gas available and connected
Neighborhood map
What this means for you Summary
Snapshot
- This is a 3-bed/2.0-bath single-family listed at $130k.
Deal economics
- At list price, monthly cash flow is $813 ($10k/yr) — positive.
- The deal already cash-flows at list — no discount required.
- Meets the 1% rule at list price ($2k rent vs $130k).
- Cap rate 13.8% vs local median 4.0% in Claiborne — top-decile yield for the area; either an underpriced asset or a hidden risk that comps aren't pricing in. Stress-test before assuming the spread holds.
Location & tenants
- Location reads 67/100 on livability (#109 in LA) — a middle-class / working-renter tenant base. Strengths: cost of living A+, housing A+, employment A-; Watch: schools D+, crime D+, health & safety D.
- Union Parish (rural): math 12% / reading 20% proficiency, ranked #74 of 98 in LA (top 76%) — low school quality limits family demand, transient renter base, plan for 1-2y turnover; 76% free/reduced lunch — lower-income household profile, screen leases tightly.
- Market conditions: 111 active listings in the ZIP; 2 units permitted in Union Parish in 2024 (0 in 5+ unit buildings).
Forward outlook
- Local home prices are declining (-3.0%/yr); year-one equity from $899 of loan paydown is wiped out by about $4k of value loss. Plan a longer hold.
- Union County population projected at -14% by 2050 — secular population decline; favor cash flow + early exit over multi-decade hold.
- At projected returns (-3.0% appreciation + 3.0% rent growth), your $36k cash investment doubles in ~5 years — after that, you're playing with house money.
Negotiation context
- Only 8 days on market — expect competitive offers; lowballing is unlikely to land.
- 3 sale attempts since 9y ago with the ask held roughly flat each time — persistent listings suggest the price (not the market) is what's stuck; bring a comps-based counter.
Questions for the listing agent
- Built in 1968 — when were the roof, HVAC, electrical panel, plumbing, and water heater last replaced?
- Is there a deadline driving the sale (1031 exchange, divorce, estate, relocation)? That informs how much negotiation room exists.
- Schools are D-rated, which usually means shorter tenancies and higher turnover. Who's the typical renter profile here, and what's been the actual vacancy rate?
- Crime grade is D in this area — have there been break-ins, vandalism, or insurance claims at this property in the last 3 years? What carrier currently insures it and at what premium?
- What's the average days-on-market for RENTAL listings here right now (not sales)? A rising rental-DOM trend means longer vacancies and softer asking-rent achievability than the comps imply.
- What's the recent tenant-quality profile in this submarket — average credit score on applications, eviction rate, late-payment / NSF rate, and stable-employment percentage? A property-management company in the area should have these aggregated.
- How much new for-sale + rental construction is in the pipeline within 1–3 miles? Heavy new supply typically softens prices + rents 12–24 months out; constrained supply supports both.
Investment metrics
- 1% rule
- 1.62% ✓
- Cap rate
- 13.80%
- Cash-on-cash
- 26.80%
- DSCR
- 2.19
- GRM
- 5.1
CMA / ARV
No comps found within radius.
Projected returns pro-forma
-3.0% appreciation · 3.0% rent growth · sell at horizon
- IRR
- 20.7%
- Equity multiple
- 1.84×
- Total profit
- $30,712
- Equity at exit
- $19,383
- IRR
- 28.9%
- Equity multiple
- 3.57×
- Total profit
- $93,419
- Equity at exit
- $11,240
Cash invested: $36,400 (down + closing). Projections, not guarantees.
Landlord ↔ Tenant lean methodology
- Overall (STATE)
- 90 Strongly Landlord-Friendly
- State Louisiana
- 90 Strongly Landlord-Friendly · R+12
- County
- — inherits STATE
- City
- — inherits STATE
ZIP-level market 71241
- Home prices YoY
- -21.0%
- Active inventory
- 111
- Price-to-rent
- 5.1×
Monthly cashflow live
- Estimated rent
- $2,104 medium interval (Pro) →
- Mortgage (P&I)
- −$682
- Tax from tax record
- −$113 /mo · $1,357/yr
- Insurance
- −$54
- HOA
- −$0
- Vacancy / Maint / Mgmt
- −$442
- Net cashflow
- $813
Break-even live
Sensitivity live
| Price | -10% $887 | -5% $850 | +0% $813 | +5% $776 | +10% $739 |
|---|---|---|---|---|---|
| Rent | -10% $647 | -5% $730 | +0% $813 | +5% $896 | +10% $979 |
| Rate | -1.0pp $878 | -0.5pp $846 | base $813 | +0.5pp $779 | +1.0pp $745 |
UW: 25.0% down · 7.5% · 30yr · 1.5% tax · 5.0% vac · 8.0% maint · 8.0% mgmt
Financing live
Cash to close
- Down payment
- $32,500
- Closing costs
- $3,900
- Reserves months
- —
- Total cash needed
- —
Loan-product check · same deal, 3 products live
Conventional
25% down · 7.5% · 30yr
- Down + closing
- —
- Monthly P&I
- —
- Monthly cashflow
- —
- DSCR
- —
- Eligible?
- —
Personal DTI + credit; lowest rate.
DSCR
20% down · 8.5% · 30yr
- Down + closing
- —
- Monthly P&I
- —
- Monthly cashflow
- —
- DSCR
- —
- Eligible?
- —
No personal income docs; deal must DSCR.
Hard money
10% down · 12.0% · 12mo
- Down + closing
- —
- Monthly P&I
- —
- Monthly cashflow
- —
- DSCR
- —
- Eligible?
- —
Short-term bridge; refi at stabilization.
Listing history 8 events
-
2026-06-19days on market $130,000 Active 8 DOM
-
2026-06-18days on market $130,000 Active 7 DOM
-
2026-06-17days on market $130,000 Active 6 DOM
-
2026-06-16days on market $130,000 Active 5 DOM
-
2026-06-15days on market $130,000 Active 4 DOM
-
2026-06-14days on market $130,000 Active 2 DOM
-
2026-06-13remarks 465-char remark
-
2026-06-13$130,000 Active 1 DOM
ⓘ Source: listings_history table (triggers on properties + properties_extension) + one-shot
backfill from property_details.listing_events for pre-trigger history.
Tax reassessment forecast LA · Resets to sale price
- Current annual tax
- $1,357 · $113/mo
- Projected year-2 tax
- $1,357 · $113/mo
- Expected delta
- $0/yr ($0/mo · 0.0%)
ⓘ Screening estimate from a state-policy table — verify with the county assessor before closing.
Nearby sold comps map
Loading sold comps map…
Walkable amenities ~0.75 mi
Loading nearby amenities…
Taxation est. · year 1
- Rental income
- $25,244
- − Mortgage interest
- −$7,282
- − Property taxes
- −$1,357
- − Insurance
- −$650
- − Repairs & maintenance
- −$2,020
- − Management
- −$2,020
- − Depreciation
- −$3,782
- Taxable income
- $8,134
- Est. tax owed @ 24.0%
- −$1,952
- After-tax cash flow
- $7,803/yr
For passive investors: Depreciation is non-cash, so a rental often shows a tax loss while cash-flowing — sheltering income. Rental losses are passive: they offset passive income freely, and up to $25,000/yr can offset ordinary (W-2) income if you actively participate and your MAGI is under $100k (phasing out to $0 by $150k); unused losses carry forward. On sale, claimed depreciation is recaptured at up to 25%, and gains may owe capital-gains tax (a 1031 exchange can defer both). Figures are a year-1 estimate at your 24.0% rate — not tax advice; consult a CPA.
Schools (NCES district)
- District
- Union Parish
- NCES district ID
- 2201770
- Math proficiency
- 12% ▼ -37.00%
- Reading proficiency
- 20% ▼ -34.00%
- Median HH income
- $37,279
- Composite
- 13.35/100
- National rank
- #9537
- State rank
- #74 of 98 in LA
Livability — Claiborne
- Score
- 67/100
- State rank
- #109
- US rank
- #10626
Category grades
Schools grade is shown separately in the Schools card above.
Census & demographics
- Population (ZIP)
- 7,773
Population outlook (Union County) Hauer SSP2
- Today (2025)
- 21,722 people
- By 2030
- 21,226 · -2.3%
- By 2040
- 20,026 · -7.8%
- By 2050
- 18,682 · -14.0%
- By 2075
- 15,725 · -27.6%
- By 2100
- 12,509 · -42.4%
Race, ethnicity, and origin ACS 2023
- Neighborhood character
- Predominantly White (66%)
- Race & ethnicity
- White 66% Black 26% Hispanic / Latino 5% Two or more races 3%
- Hispanic origin (detail)
- Common ancestry
- Slovak 1% Italian 1% Lithuanian 1%
- Foreign-born
- 3% · Canada
- Languages at home
- 98% English-only · Spanish 1%
Political lean MEDSL · Union
- 2024 margin
- Solid R (+57.0) · D 21.1% · R 78.0%
- 2008→2024 swing
- -15.4pp toward R · 2008: -41.5pp · 2024: -57.0pp
- All cycles
- 2024: R+57.0 2020: R+51.4 2016: R+48.5 2012: R+41.7 2008: R+41.5
Not yet ingested
- Civics
- —
Market trends
- HPI YoY
- ▼ -44.85%
- Current HPI
- 169.0449
- Rent YoY
- —
- Metro
- —
- State GDP YoY
- ▲ 3.29%
- F500 in state
- 10
Industry mix (Fortune 500 HQ in LA)
| Industry | F500 HQs | Revenue |
|---|---|---|
| Telecommunications | 2 | $23B |
|
||
| Utilities | 1 | $12B |
|
||
| Wholesale / Distribution | 1 | $5B |
|
||
| Advertising | 1 | $2B |
|
||
Price history
-18.8% since first listed5 events — show timeline
- 2026-06-11 Listed $130,000 NELABOR
- 2017-11-14 Sold (Public Records) $148,000 Public Records
- 2017-05-11 Listed $153,900 NELABOR
- 2017-02-24 Listed $175,000 NELABOR
- 2016-09-16 Sold (Public Records) $160,100 Public Records
Property tax history
+13.0%/yrLatest (2025): $1,357 · +0.0% YoY. Source: county tax records.
Cash-flow waterfall
monthlySold comps — $/sqft
last 12 mo · ≤1 miLoading sold comps…