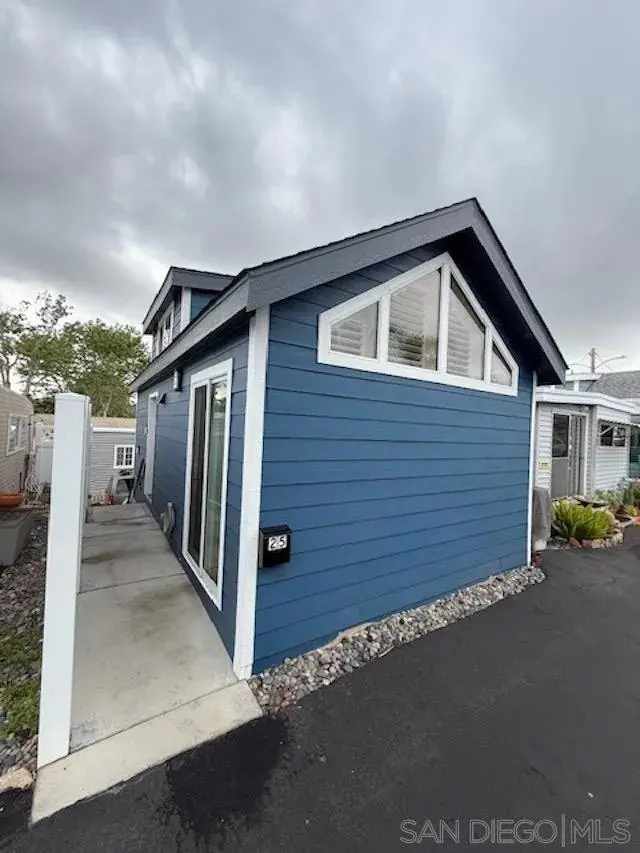
170 Diana St Spc 25 · Encinitas, CA
Flood risk 1/10 · Minimal
- FEMA flood zone
- X (unshaded)
- Chance of flooding over 30 yrs
- 0.0%
- Est. flood insurance / yr
- $507 – $1,088
Fire risk 2/10 · Minimal
- Est. fire insurance / yr
- $659 – $1,223
Heat risk 4/10 · Minor
- Hot days now (above 85°F)
- 7 days/yr
- Hot days in 30 yrs
- 18 days/yr
Wind risk 1/10 · Minimal
- Chance of severe wind over 30 yrs
- —
Air-quality risk 3/10 · Minor
- Unhealthy air days now
- 4 days/yr
- Unhealthy air days in 30 yrs
- 4 days/yr
Risk factors via First Street. Map © Google.
Why this score? — see what drove the D+ grade
The composite is a weighted blend of 9 inputs, each scored 0–100. Each bar is that input's sub-score; the figure is the points it added to the 100-point composite (weight × sub-score).
- Cash flow +14.8/30.0
- ARV discount +7.5/15.0
- Schools +7.1/10.0
- DSCR +4.5/10.0
- 1% rule +4.1/10.0
- Livability +4.0/5.0
- Rent growth +3.8/5.0
- Condition / age +2.5/5.0
- Appreciation +0.0/10.0
$299,000
🖨 Deal sheet 📄 Offer letter ✓ Due diligence
Listing remarks
Experience the coveted Encinitas coastal lifestyle—without the coastal price tag. Nestled in the heart of Leucadia within Beacon’s Beach Village, this beautifully maintained turnkey mobile home (built in 2013) offers the perfect blend of charm, comfort, and location. Step inside to find warm wood plank flooring, fresh interior paint, and vaulted ceilings that flood the home with natural light and create an airy, open feel. The flexible floor plan features a spacious downstairs bedroom and a charming upstairs loft with room for two beds—ideal for guests or a creative retreat. Thoughtful upgrades throughout include a recently upgraded kitchen with a new stove, countertops an
Key facts
- Flexible floor plan
- Upgraded kitchen
- Wood plank flooring
Tags
Property features AI
Finance
- Other: Pets allowed with breed restrictions; Located in Beacon's Beach Village, Leucadia
Exterior
- Parking: 1 assigned parking space
- Utilities: Sewer connected
- Home design: Manufactured home; Residential property; 2 stories
- Exterior features: Partial fencing; Composition roof; Located in a common-interest community
Interior
- Kitchen: Electric cooktop; Refrigerator
- Bedrooms: Can be used as 2 bedrooms
- Bathrooms: 1 full bathroom
- Heating & cooling: Electric heating
- Interior features: Refrigerator; Electric cooktop
Neighborhood map
What this means for you Summary
Snapshot
- This is a 1-bed/1.0-bath manufactured listed at $299k.
Deal economics
- At list price, monthly cash flow is $80 ($964/yr) — positive.
- The deal already cash-flows at list — no discount required.
- To meet the 1% rule (rent ≥ 1% of price), the offer needs to be $272k (9.1% below list).
- Recommended offer: $272k (9.1% below list) — sets the bar for 1% rule.
- Cap rate 6.6% vs local median 1.6% in Encinitas — top-decile yield for the area; either an underpriced asset or a hidden risk that comps aren't pricing in. Stress-test before assuming the spread holds.
Location & tenants
- Location reads 79/100 on livability (#54 in CA, #2,026 nationally) — a middle-class / working-renter tenant base. Strengths: schools A+, amenities A+, commute A+; Watch: health & safety C-, cost of living F.
- San Dieguito Union High (urban): math 72% / reading 79% proficiency, ranked #56 of 1,400 in CA (top 4%) — strong family-tenant draw, lease renewals of 3-5y typical; only 8% free/reduced lunch — higher-income household profile.
- Market conditions: Rents rising fast (+5.4%/yr); 205 active listings in the ZIP; high-income renter base; 11,759 units permitted in San Diego County in 2024 (7,244 in 5+ unit buildings).
Forward outlook
- Local home prices are declining (-3.0%/yr); year-one equity from $2k of loan paydown is wiped out by about $9k of value loss. Plan a longer hold.
- San Diego County population projected at +20% by 2050 — long-run rental-demand tailwind backs the buy-and-hold thesis.
Negotiation context
- It's been on market 78 days — a 6% lower offer ($281k) is reasonable based on typical stale-listing flexibility.
- 8 sale attempts since 14y ago with the ask held roughly flat each time — persistent listings suggest the price (not the market) is what's stuck; bring a comps-based counter.
- Current owner paid $108k; list at $299k implies a 177% gain — meaningful room to come down on a strong offer.
Questions for the listing agent
- It's been on market 78 days. Have you received any prior offers? Is the seller open to a 9% concession, seller financing, or rate buy-down credit?
- Why hasn't it sold? Are there any deal-killer items the seller is aware of (foundation, flood, title, zoning, code violations)?
- Is there a deadline driving the sale (1031 exchange, divorce, estate, relocation)? That informs how much negotiation room exists.
- Schools are A-rated — typically a magnet for longer-tenancy family renters. What's the average tenant stay here, and is there a school-zone premium baked into asking?
- The area grade is low — what's the realistic commute time and amenity access for the typical tenant pool here? Any planned neighborhood developments (good or bad) we should know about?
- What's the average days-on-market for RENTAL listings here right now (not sales)? A rising rental-DOM trend means longer vacancies and softer asking-rent achievability than the comps imply.
- What's the recent tenant-quality profile in this submarket — average credit score on applications, eviction rate, late-payment / NSF rate, and stable-employment percentage? A property-management company in the area should have these aggregated.
- How much new for-sale + rental construction is in the pipeline within 1–3 miles? Heavy new supply typically softens prices + rents 12–24 months out; constrained supply supports both.
Investment metrics
- 1% rule
- 0.91% ✗
- Cap rate
- 6.62%
- Cash-on-cash
- 1.15%
- DSCR
- 1.05
- GRM
- 9.2
CMA / ARV
- ARV (on-the-fly)
- $186,750
- Comps found
- 7
Show comp detail 7 sales within ~0.75 mi
| Address | Dist | Beds/Ba | Sqft | Sold | Price | $/sf | Match |
|---|---|---|---|---|---|---|---|
| 170 Diana St #24 | 0.00mi | 1/1.0 | 392 (-13%) | 3mo | $175,000 | $446 | 76 |
| 159 Diana St #3 | 0.06mi | 1/1.0 | 432 (-4%) | 23mo | $399,999 | $926 | 72 |
| 1624 N coast hwy 101 #51 | 0.56mi | 1/1.0 | 442 (-2%) | 19mo | $220,000 | $498 | 55 |
| 1549 N Vulcan Ave #4 | 0.55mi | 1/1.0 | 470 (+4%) | 15mo | $195,000 | $415 | 55 |
| 1549 N Vulcan Ave #58 | 0.53mi | 1/1.0 | 504 (+12%) | 7mo | $125,000 | $248 | 49 |
| 699 N Vulcan Ave #73 | 0.49mi | 1/1.0 | 504 (+12%) | 19mo | $150,000 | $298 | 41 |
| 1549 N Vulcan Ave #60 | 0.55mi | 2/1.0 (+1) | 390 (-13%) | 18mo | $110,000 | $282 | 32 |
Match score weights: distance 35% · size 25% · config 20% · recency 20%. Top-matched comps best support the ARV.
Projected returns pro-forma
-3.0% appreciation · 5.39% rent growth · sell at horizon
- IRR
- -11.8%
- Equity multiple
- 0.56×
- Total profit
- $-36,601
- Equity at exit
- $44,582
- IRR
- 0.6%
- Equity multiple
- 1.04×
- Total profit
- $3,717
- Equity at exit
- $25,852
Cash invested: $83,720 (down + closing). Projections, not guarantees.
Landlord ↔ Tenant lean methodology
- Overall (STATE)
- 18 Strongly Tenant-Friendly
- State California
- 18 Strongly Tenant-Friendly · D+13
- County
- — inherits STATE
- City
- — inherits STATE
ZIP-level market 92024
- Rents YoY
- 5.4%
- Active inventory
- 205
- Price-to-rent
- 9.2×
Monthly cashflow live
- Estimated rent
- $2,717 medium interval (Pro) →
- Mortgage (P&I)
- −$1,568
- Tax est. 1.5%
- −$374 /mo · $4,485/yr
- Insurance
- −$125
- HOA
- −$0
- Vacancy / Maint / Mgmt
- −$571
- Net cashflow
- $80
Break-even live
UW: 25.0% down · 7.5% · 30yr · 1.5% tax · 5.0% vac · 8.0% maint · 8.0% mgmt
Financing live
Cash to close
- Down payment
- $74,750
- Closing costs
- $8,970
- Reserves months
- —
- Total cash needed
- —
Loan-product check · same deal, 3 products live
Conventional
25% down · 7.5% · 30yr
- Down + closing
- —
- Monthly P&I
- —
- Monthly cashflow
- —
- DSCR
- —
- Eligible?
- —
Personal DTI + credit; lowest rate.
DSCR
20% down · 8.5% · 30yr
- Down + closing
- —
- Monthly P&I
- —
- Monthly cashflow
- —
- DSCR
- —
- Eligible?
- —
No personal income docs; deal must DSCR.
Hard money
10% down · 12.0% · 12mo
- Down + closing
- —
- Monthly P&I
- —
- Monthly cashflow
- —
- DSCR
- —
- Eligible?
- —
Short-term bridge; refi at stabilization.
Listing history 48 events
-
2026-06-18days on market $299,000 Active 78 DOM
-
2026-06-17days on market $299,000 Active 77 DOM
-
2026-06-16days on market $299,000 Active 76 DOM
-
2026-06-15days on market $299,000 Active 75 DOM
-
2026-06-13days on market $299,000 Active 73 DOM
-
2026-06-13days on market $299,000 Active 72 DOM
-
2026-06-09days on market $299,000 Active 69 DOM
-
2026-06-08days on market $299,000 Active 68 DOM
-
2026-06-07days on market $299,000 Active 67 DOM
-
2026-06-04days on market $299,000 Active 64 DOM
-
2026-06-03days on market $299,000 Active 63 DOM
-
2026-06-02days on market $299,000 Active 62 DOM
-
2026-06-01days on market $299,000 Active 61 DOM
-
2026-05-31days on market $299,000 Active 60 DOM
-
2026-04-01$299,000 Active
-
2025-01-18historical
-
2024-03-25$299,000
-
2023-07-31historical
-
2023-07-24price $275,000
-
2023-04-01$299,000 Active
-
2020-08-10status Pending Sale
-
2020-08-09historical
-
2020-08-04price $177,500
-
2020-08-04price $177,500
-
2020-07-08price $187,500
-
2020-07-07price $187,500
-
2020-06-27$199,000 Active
-
2020-06-25historical
-
2018-10-31historical
-
2018-10-17price $229,900
-
2018-09-24price $242,900
-
2018-09-21price $249,999
-
2018-09-05price $250,000
-
2018-08-14price $299,876
-
2018-08-02$349,876 Active
-
2013-11-22soldstatus $108,000
-
2013-11-22soldstatus $108,000 Sold
-
2013-11-08status Pending
-
2013-10-23price $115,000
-
2013-10-13price $180,000
-
2013-08-13price $125,000
-
2013-07-21price $160,000
-
2013-06-01$199,000 Active
-
2013-05-28$115,000
-
2012-07-19soldstatus $18,000
-
2012-06-28price $29,000
-
2012-05-02price $34,990
-
2012-03-09$29,000
ⓘ Source: listings_history table (triggers on properties + properties_extension) + one-shot
backfill from property_details.listing_events for pre-trigger history.
Climate risk First Street
- Flood 1/10 Low FEMA zone X (unshaded) · 0% chance over 30 yrs
- Wildfire 2/10 Low
- Heat 4/10 Moderate 7 d/yr ≥85°F today · 18 d/yr by 30 yrs out
- Wind 1/10 Low
- Air quality 3/10 Moderate 4 unhealthy d/yr today · 4 by 30 yrs out
Nearby sold comps map
Loading sold comps map…
Walkable amenities ~0.75 mi
Loading nearby amenities…
Taxation est. · year 1
- Rental income
- $32,608
- − Mortgage interest
- −$16,749
- − Property taxes
- −$4,485
- − Insurance
- −$1,495
- − Repairs & maintenance
- −$2,609
- − Management
- −$2,609
- − Depreciation
- −$8,698
- Taxable loss
- −$4,036
- Est. tax savings @ 24.0%
- +$969
- After-tax cash flow
- $1,933/yr
For passive investors: Depreciation is non-cash, so a rental often shows a tax loss while cash-flowing — sheltering income. Rental losses are passive: they offset passive income freely, and up to $25,000/yr can offset ordinary (W-2) income if you actively participate and your MAGI is under $100k (phasing out to $0 by $150k); unused losses carry forward. On sale, claimed depreciation is recaptured at up to 25%, and gains may owe capital-gains tax (a 1031 exchange can defer both). Figures are a year-1 estimate at your 24.0% rate — not tax advice; consult a CPA.
Schools (NCES district)
- District
- San Dieguito Union High
- NCES district ID
- 0634380
- Math proficiency
- 72% ▬ 0.00%
- Reading proficiency
- 79% ▼ -1.00%
- Median HH income
- $110,199
- Composite
- 70.63/100
- National rank
- #519
- State rank
- #56 of 1400 in CA
Livability — Encinitas
- Score
- 79/100
- State rank
- #54
- US rank
- #2026
Category grades
Schools grade is shown separately in the Schools card above.
Census & demographics
- Census place
- Encinitas, CA
- County
- San Diego County · 3,178,799 people
- City population
- 61,717
- Metro
- San Diego-Chula Vista-Carlsbad, CA
- Population (ZIP)
- 50,617
- Household income
- $158,507
- Rent vs Own
- Severe rent burden
- 1537.0
Population outlook (San Diego County) Hauer SSP2
- Today (2025)
- 3,678,185 people
- By 2030
- 3,856,546 · +4.8%
- By 2040
- 4,171,407 · +13.4%
- By 2050
- 4,421,607 · +20.2%
- By 2075
- 4,831,599 · +31.4%
- By 2100
- 4,832,502 · +31.4%
Race, ethnicity, and origin ACS 2023
- Neighborhood character
- Predominantly White (75%)
- Race & ethnicity
- White 75% Hispanic / Latino 14% Two or more races 11% Asian 5%
- Hispanic origin (detail)
- Mexican 10%
- Common ancestry
- Italian 4% Romanian 3% Slovak 3%
- Foreign-born
- 12% · Canada, China
- Languages at home
- 84% English-only · Spanish 9% Other Indo-European 2% German/W. Germanic 1%
Political lean MEDSL · San Diego
- 2024 margin
- D (+16.8) · D 56.9% · R 40.1% · Other 2.9%
- 2008→2024 swing
- +6.6pp toward D · 2008: 10.2pp · 2024: 16.8pp
- All cycles
- 2024: D+16.8 2020: D+22.8 2016: D+17.8 2012: D+5.1 2008: D+10.2
Not yet ingested
- Civics
- —
Market trends
- HPI YoY
- ▼ -881.14%
- Current HPI
- 461.5044
- Rent YoY
- ▲ 5.39%
- Metro
- San Diego-Chula Vista-Carlsbad, CA
- State GDP YoY
- ▲ 3.21%
- F500 in state
- 116
Industry mix (Fortune 500 HQ in CA)
| Industry | F500 HQs | Revenue |
|---|---|---|
| Technology | 27 | $1,492B |
|
||
| Financial Services | 3 | $174B |
|
||
| Retail | 3 | $44B |
|
||
| Insurance | 3 | $26B |
|
||
| Media / Entertainment | 2 | $115B |
|
||
| Pharmaceuticals / Biotech | 2 | $62B |
|
||
Price history
+931.0% since first listed34 events — show timeline
- 2026-04-01 Listed $299,000 SDMLS
- 2025-01-18 Listing Removed — SDMLS
- 2024-03-25 Listed $299,000 SDMLS
- 2023-07-31 Listing Removed — SDMLS
- 2023-07-24 Price Changed $275,000 SDMLS
- 2023-04-01 Listed $299,000 SDMLS
- 2020-08-10 Pending — CRMLS
- 2020-08-09 Listing Removed — CRMLS
- 2020-08-04 Price Changed $177,500 SDMLS
- 2020-08-04 Price Changed $177,500 CRMLS
- 2020-07-08 Price Changed $187,500 SDMLS
- 2020-07-07 Price Changed $187,500 CRMLS
- 2020-06-27 Listed $199,000 CRMLS
- 2020-06-25 Coming Soon — CRMLS
- 2018-10-31 Listing Removed — SDMLS
- 2018-10-17 Price Changed $229,900 SDMLS
- 2018-09-24 Price Changed $242,900 SDMLS
- 2018-09-21 Price Changed $249,999 SDMLS
- 2018-09-05 Price Changed $250,000 SDMLS
- 2018-08-14 Price Changed $299,876 SDMLS
- 2018-08-02 Listed $349,876 SDMLS
- 2013-11-22 Sold (MLS) $108,000 SDMLS
- 2013-11-22 Sold (MLS) $108,000 CRMLS
- 2013-11-08 Pending — SDMLS
- 2013-10-23 Price Changed $115,000 SDMLS
- 2013-10-13 Price Changed $180,000 SDMLS
- 2013-08-13 Price Changed $125,000 SDMLS
- 2013-07-21 Price Changed $160,000 SDMLS
- 2013-06-01 Listed $199,000 SDMLS
- 2013-05-28 Listed $115,000 CRMLS
- 2012-07-19 Sold (MLS) $18,000 CRMLS
- 2012-06-28 Price Changed $29,000 SDMLS
- 2012-05-02 Price Changed $34,990 SDMLS
- 2012-03-09 Listed $29,000 CRMLS
Cash-flow waterfall
monthlySold comps — $/sqft
last 12 mo · ≤1 miLoading sold comps…