 Multi-family
680 Pine Acres · Daleville, AL
Flood risk 1/10 · Minimal
- FEMA flood zone
- X (unshaded)
- Chance of flooding over 30 yrs
- 0.0%
- Est. flood insurance / yr
- $507 – $1,088
Fire risk 4/10 · Minor
- Est. fire insurance / yr
- $916 – $1,700
Heat risk 7/10 · Major
- Hot days now (above 106°F)
- 6 days/yr
- Hot days in 30 yrs
- 14 days/yr
Wind risk 8/10 · Major
- Chance of severe wind over 30 yrs
- 99.0%
Air-quality risk 1/10 · Minimal
- Unhealthy air days now
- 0 days/yr
- Unhealthy air days in 30 yrs
- 0 days/yr
Risk factors via First Street. Map © Google.
Why this score? — see what drove the C+ grade
The composite is a weighted blend of 9 inputs, each scored 0–100. Each bar is that input's sub-score; the figure is the points it added to the 100-point composite (weight × sub-score).
- Cash flow +25.5/30.0
- DSCR +8.5/10.0
- ARV discount +7.5/15.0
- Appreciation +6.9/10.0
- 1% rule +6.7/10.0
- Schools +3.1/10.0
- Livability +3.1/5.0
- Rent growth +2.5/5.0
- Condition / age +1.0/5.0
$175,000
🖨 Deal sheet (PDF) 📄 Offer letter ✓ Due diligence
Multi-family units
County records classify this as Multi-Family (2-4 Unit). Listing-text estimate: 1 unit. estimate disagrees with records
Listing remarks MLS
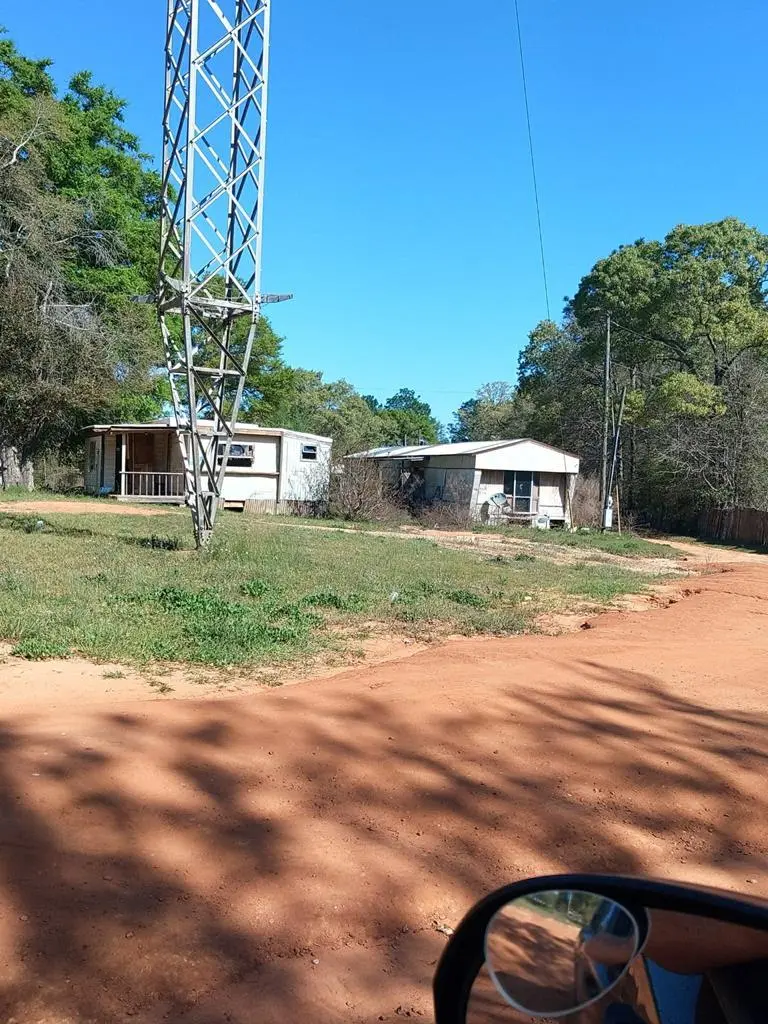
Over 7.28 acres of land with existing mobile homes. Whether you're looking to invest, develop, or create your own space, this property offers plenty of potential and room to grow.
Key facts
- 7.28 acres of land
- 7.28 acre lot
- Listed 81 days
Tags
Neighborhood map
What this means for you Summary
Snapshot
- This is a multifamily listed at $175k. Condition is rated poor.
Deal economics
- At list price, monthly cash flow is $410 ($5k/yr) — positive.
- The deal already cash-flows at list — no discount required.
- Meets the 1% rule at list price ($2k rent vs $175k).
- Recommended offer: $164k (6.0% below list) — sets the bar for market timing.
- Cap rate 9.1% vs local median 6.5% in Daleville — top-decile yield for the area; either an underpriced asset or a hidden risk that comps aren't pricing in. Stress-test before assuming the spread holds.
Location & tenants
- Location reads 61/100 on livability (#278 in AL) — a middle-class / working-renter tenant base. Strengths: cost of living A+, housing A-; Watch: health & safety D, schools F, amenities F.
- Houston County (rural): math 25% / reading 49% proficiency, ranked #38 of 129 in AL (top 30%) — families likely to look elsewhere, expect single-tenant / working-renter base with shorter leases.
- Market conditions: 60 active listings in the ZIP; 1 comparable units currently listed for rent nearby; 463 units permitted in Houston County in 2024 (96 in 5+ unit buildings).
Forward outlook
- In year one you build about $8k of equity ($1k loan paydown + $7k appreciation (3.8% local appreciation)).
- Houston County population projected at +7% by 2050 — modest demand growth; plan on rents tracking national, not racing it.
- At projected returns (3.8% appreciation + 3.0% rent growth), your $49k cash investment doubles in ~4 years — after that, you're playing with house money.
- By year 5, paydown + projected appreciation supports a ~$34k cash-out refi (75% LTV) — recoverable capital for the next deal without selling this one.
Negotiation context
- It's been on market 82 days — a 6% lower offer ($164k) is reasonable based on typical stale-listing flexibility.
- 2 sale attempts with the ask held roughly flat each time — persistent listings suggest the price (not the market) is what's stuck; bring a comps-based counter.
Risks & watch-outs
- Climate carrying-cost: severe wind risk, 99% chance of damaging wind over 30y; extreme-heat days projected 6→14/yr by 2055 (HVAC capex compounding) — expect insurance premiums to compound above CPI over the hold.
Questions for the listing agent
- It's been on market 82 days. Have you received any prior offers? Is the seller open to a 6% concession, seller financing, or rate buy-down credit?
- Have any recent inspections been done? Can we get a copy of the seller's disclosures and any deferred-maintenance estimates?
- Why hasn't it sold? Are there any deal-killer items the seller is aware of (foundation, flood, title, zoning, code violations)?
- Is there a deadline driving the sale (1031 exchange, divorce, estate, relocation)? That informs how much negotiation room exists.
- Schools are F-rated, which usually means shorter tenancies and higher turnover. Who's the typical renter profile here, and what's been the actual vacancy rate?
- What's the average days-on-market for RENTAL listings here right now (not sales)? A rising rental-DOM trend means longer vacancies and softer asking-rent achievability than the comps imply.
- What's the recent tenant-quality profile in this submarket — average credit score on applications, eviction rate, late-payment / NSF rate, and stable-employment percentage? A property-management company in the area should have these aggregated.
- How much new apartment / multifamily construction is in the pipeline within 1–3 miles? Heavy new supply (>2% of stock underway) typically softens rents 12–24 months out; light construction supports rent growth.
Investment metrics
- 1% rule
- 1.17% ✓
- Cap rate
- 9.11%
- Cash-on-cash
- 10.04%
- DSCR
- 1.45
- GRM
- 7.1
CMA / ARV
No comps found within radius.
Projected returns pro-forma
3.83% appreciation · 3.0% rent growth · sell at horizon
- IRR
- 18.9%
- Equity multiple
- 2.12×
- Total profit
- $54,994
- Equity at exit
- $86,945
- IRR
- 19.6%
- Equity multiple
- 4.06×
- Total profit
- $149,969
- Equity at exit
- $140,801
Cash invested: $49,000 (down + closing). Projections, not guarantees.
Landlord ↔ Tenant lean methodology
- Overall (STATE)
- 90 Strongly Landlord-Friendly
- State Alabama
- 90 Strongly Landlord-Friendly · R+15
- County
- — inherits STATE
- City
- — inherits STATE
ZIP-level market 36352
- Home prices YoY
- 1.6%
- Active inventory
- 60
- Price-to-rent
- 7.1×
Monthly cashflow live
- Estimated rent
- $2,050 medium interval (Pro) →
- Mortgage (P&I)
- −$918
- Tax est. 1.5%
- −$219 /mo · $2,625/yr
- Insurance
- −$73
- HOA
- −$0
- Vacancy / Maint / Mgmt
- −$430
- Net cashflow
- $410
Break-even live
Sensitivity live
| Price | -10% $531 | -5% $471 | +0% $410 | +5% $350 | +10% $289 |
|---|---|---|---|---|---|
| Rent | -10% $248 | -5% $329 | +0% $410 | +5% $491 | +10% $572 |
| Rate | -1.0pp $498 | -0.5pp $455 | base $410 | +0.5pp $365 | +1.0pp $319 |
UW: 25.0% down · 7.5% · 30yr · 1.5% tax · 5.0% vac · 8.0% maint · 8.0% mgmt
Financing live
Cash to close
- Down payment
- $43,750
- Closing costs
- $5,250
- Reserves months
- —
- Total cash needed
- —
Loan-product check · same deal, 3 products live
Conventional
25% down · 7.5% · 30yr
- Down + closing
- —
- Monthly P&I
- —
- Monthly cashflow
- —
- DSCR
- —
- Eligible?
- —
Personal DTI + credit; lowest rate.
DSCR
20% down · 8.5% · 30yr
- Down + closing
- —
- Monthly P&I
- —
- Monthly cashflow
- —
- DSCR
- —
- Eligible?
- —
No personal income docs; deal must DSCR.
Hard money
10% down · 12.0% · 12mo
- Down + closing
- —
- Monthly P&I
- —
- Monthly cashflow
- —
- DSCR
- —
- Eligible?
- —
Short-term bridge; refi at stabilization.
Rent comps 1 comps
| Address | Beds | Baths | Sqft | Rent | $/sqft | DOM | Units | Dist |
|---|---|---|---|---|---|---|---|---|
| 14040 W US 84 Newton, AL | 3.0 | 2.0 | — | $2,050 | — | 44d | 1 | 1.25mi |
Listing history 19 events
-
2026-06-19days on market $175,000 Active 82 DOM
-
2026-06-18days on market $175,000 Active 81 DOM
-
2026-06-17days on market $175,000 Active 80 DOM
-
2026-06-16days on market $175,000 Active 79 DOM
-
2026-06-15days on market $175,000 Active 78 DOM
-
2026-06-14days on market $175,000 Active 76 DOM
-
2026-06-12days on market $175,000 Active 75 DOM
-
2026-06-09days on market $175,000 Active 72 DOM
-
2026-06-08days on market $175,000 Active 71 DOM
-
2026-06-07days on market $175,000 Active 70 DOM
-
2026-06-05days on market $175,000 Active 67 DOM
-
2026-06-03days on market $175,000 Active 66 DOM
-
2026-06-02days on market $175,000 Active 65 DOM
-
2026-06-01days on market $175,000 Active 64 DOM
-
2026-05-31days on market $175,000 Active 63 DOM
-
2026-05-30days on market $175,000 Active 62 DOM
-
2026-05-08status Active 179-char remark
Show marketing remark (179 chars)
Over 7.28 acres of land with existing mobile homes. Whether you're looking to invest, develop, or create your own space, this property offers plenty of potential and room to grow.
-
2026-03-30historical Active Under Contract 179-char remark
Show marketing remark (179 chars)
Over 7.28 acres of land with existing mobile homes. Whether you're looking to invest, develop, or create your own space, this property offers plenty of potential and room to grow.
-
2026-03-29$175,000 Active 179-char remark
Show marketing remark (179 chars)
Over 7.28 acres of land with existing mobile homes. Whether you're looking to invest, develop, or create your own space, this property offers plenty of potential and room to grow.
ⓘ Source: listings_history table (triggers on properties + properties_extension) + one-shot
backfill from property_details.listing_events for pre-trigger history.
Climate risk First Street
- Flood 1/10 Low FEMA zone X (unshaded) · 0% chance over 30 yrs
- Wildfire 4/10 Moderate
- Heat 7/10 Severe 6 d/yr ≥106°F today · 14 d/yr by 30 yrs out
- Wind 8/10 Severe 99% chance of damaging wind over 30 yrs
- Air quality 1/10 Low 0 unhealthy d/yr today · 0 by 30 yrs out
Nearby sold comps map
Loading sold comps map…
Walkable amenities ~0.75 mi
Loading nearby amenities…
Taxation est. · year 1
- Rental income
- $24,600
- − Mortgage interest
- −$9,803
- − Property taxes
- −$2,625
- − Insurance
- −$875
- − Repairs & maintenance
- −$1,968
- − Management
- −$1,968
- − Depreciation
- −$5,091
- Taxable income
- $2,270
- Est. tax owed @ 24.0%
- −$545
- After-tax cash flow
- $4,376/yr
For passive investors: Depreciation is non-cash, so a rental often shows a tax loss while cash-flowing — sheltering income. Rental losses are passive: they offset passive income freely, and up to $25,000/yr can offset ordinary (W-2) income if you actively participate and your MAGI is under $100k (phasing out to $0 by $150k); unused losses carry forward. On sale, claimed depreciation is recaptured at up to 25%, and gains may owe capital-gains tax (a 1031 exchange can defer both). Figures are a year-1 estimate at your 24.0% rate — not tax advice; consult a CPA.
Condition & rehab AI · 4 photos
This property requires extensive repairs and improvements to its mobile homes and landscaping to become move-in ready and increase its value.
Repairs flagged
- Major Mobile home siding — Significant damage and missing siding.
- Major Mobile home roof — Visible damage and possible leaking.
- Major Landscaping and yard cleanup — Debris and old furniture need removal for a better appearance.
Value-add opportunities
- Both Mobile home repairs and repainting — Repairs and repainting would improve both the resale and rental value.
- Both Landscaping and yard cleanup — Aesthetic improvements would attract potential buyers and renters.
Renovation cost estimate screening
| Repair item | Severity | Est. cost |
|---|---|---|
| Mobile home siding · Significant damage and missing siding. | Major | $15,000–50,000 |
| Mobile home roof · Visible damage and possible leaking. | Major | $15,000–50,000 |
| Landscaping and yard cleanup · Debris and old furniture need removal for a better appearance. | Major | $15,000–50,000 |
| Total estimated repair cost · 3 items | $45,000–150,000 |
Value-add ROI direction
- Both Mobile home repairs and repainting — Repairs and repainting would improve both the resale and rental value. ↑
- Both Landscaping and yard cleanup — Aesthetic improvements would attract potential buyers and renters. ↑
ⓘ Cost ranges are severity-bucket heuristics (US national rule-of-thumb). Get contractor quotes + a written scope before underwriting a rehab budget.
Schools (NCES district)
- District
- Houston County
- NCES district ID
- 0101770
- Math proficiency
- 25% ▼ -33.00%
- Reading proficiency
- 49% ▼ -1.00%
- Median HH income
- $40,530
- Composite
- 31.01/100
- National rank
- #6092
- State rank
- #38 of 129 in AL
Livability — Daleville
- Score
- 61/100
- State rank
- #278
- US rank
- #18463
Category grades
Schools grade is shown separately in the Schools card above.
Census & demographics
- City population
- 7,740
- Population (ZIP)
- 5,762
Population outlook (Houston County) Hauer SSP2
- Today (2025)
- 110,280 people
- By 2030
- 112,668 · +2.2%
- By 2040
- 116,149 · +5.3%
- By 2050
- 117,805 · +6.8%
- By 2075
- 118,577 · +7.5%
- By 2100
- 110,940 · +0.6%
Race, ethnicity, and origin ACS 2023
- Neighborhood character
- Predominantly White (90%)
- Race & ethnicity
- White 90% Black 6% Two or more races 3%
- Common ancestry
- Slovak 4% Iranian 4% Italian 3%
- Foreign-born
- 1%
- Languages at home
- 98% English-only · Spanish 1% Tagalog/Filipino 1%
Political lean MEDSL · Houston
- 2024 margin
- Solid R (+47.8) · D 25.7% · R 73.5%
- 2008→2024 swing
- -7.0pp toward R · 2008: -40.8pp · 2024: -47.8pp
- All cycles
- 2024: R+47.8 2020: R+42.7 2016: R+47.6 2012: R+40.3 2008: R+40.8
Not yet ingested
- Civics
- —
Market trends
- HPI YoY
- ▲ 3.83%
- Current HPI
- 239.5672
- Rent YoY
- —
- Metro
- —
- State GDP YoY
- ▲ 2.94%
- F500 in state
- 4
Industry mix (Fortune 500 HQ in AL)
| Industry | F500 HQs | Revenue |
|---|---|---|
| Financial Services | 1 | $8B |
|
||
| Healthcare | 1 | $5B |
|
||
Price history
3 events — show timeline
- 2026-05-08 Relisted — SAMLS
- 2026-03-30 Contingent — SAMLS
- 2026-03-29 Listed $175,000 SAMLS
Cash-flow waterfall
monthlySold comps — $/sqft
last 12 mo · ≤1 miLoading sold comps…