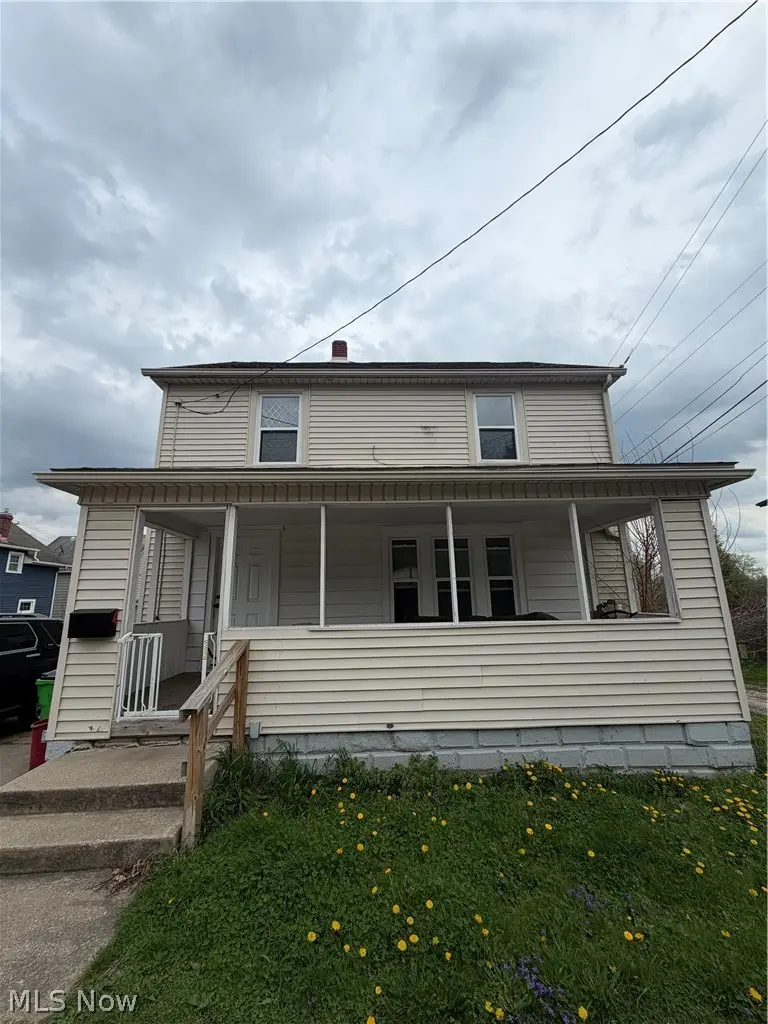
1015 Romig Ave · Barberton, OH
Flood risk 1/10 · Minimal
- FEMA flood zone
- X (unshaded)
- Chance of flooding over 30 yrs
- 0.0%
- Est. flood insurance / yr
- $473 – $860
Fire risk 1/10 · Minimal
- Est. fire insurance / yr
- $713 – $1,323
Heat risk 3/10 · Minor
- Hot days now (above 97°F)
- 7 days/yr
- Hot days in 30 yrs
- 17 days/yr
Wind risk 1/10 · Minimal
- Chance of severe wind over 30 yrs
- —
Air-quality risk 2/10 · Minimal
- Unhealthy air days now
- 0 days/yr
- Unhealthy air days in 30 yrs
- 1 days/yr
Risk factors via First Street. Map © Google.
Why this score? — see what drove the C grade
The composite is a weighted blend of 9 inputs, each scored 0–100. Each bar is that input's sub-score; the figure is the points it added to the 100-point composite (weight × sub-score).
- Cash flow +18.6/30.0
- ARV discount +15.0/15.0
- DSCR +5.8/10.0
- 1% rule +4.7/10.0
- Schools +4.1/10.0
- Rent growth +4.0/5.0
- Livability +3.6/5.0
- Condition / age +2.5/5.0
- Appreciation +0.0/10.0
$140,000
🖨 Deal sheet (PDF) 📄 Offer letter ✓ Due diligence
Listing remarks MLS
Investment opportunity!!!! Home needs some TLC and your touches, but good bones. Great rental or flip opportunity.
Key facts
- 3,262 sq ft lot
- Parking
- Built 1928
Property features AI
Finance
- Financial info: Annual tax amount listed (tax year provided)
Exterior
- Parking: Concrete driveway parking
- Utilities: Public water; Public sewer
- Home design: Two-story home; Updated/remodeled; Above-grade finished living area approximately 1,248
- Construction: Aluminum siding; Vinyl siding; Asphalt shingle roof; Concrete perimeter foundation; Built (year source: public records)
- Exterior features: Concrete driveway
Interior
- Kitchen: Range; Refrigerator
- Bedrooms: One main-level bedroom
- Bathrooms: One full bathroom; One half bathroom; One main-level bathroom
- Heating & cooling: Forced air heating
- Interior features: ENERGY STAR qualified windows; Updated/remodeled condition
- Laundry & utility: Laundry in basement
Neighborhood map
What this means for you Summary
Snapshot
- This is a 3-bed/1.0-bath single-family listed at $140k.
Deal economics
- At list price, monthly cash flow is $135 ($2k/yr) — positive.
- The deal already cash-flows at list — no discount required.
- To meet the 1% rule (rent ≥ 1% of price), the offer needs to be $136k (2.8% below list).
- Recommended offer: $136k (2.8% below list) — sets the bar for 1% rule.
- Cap rate 7.5% vs local median 6.2% in Barberton — meaningfully above typical; check what's discounted (condition, days-on-market, listing class) to confirm the premium yield is real.
Location & tenants
- Location reads 71/100 on livability (#428 in OH) — a middle-class / working-renter tenant base. Strengths: cost of living A+, housing A+, health & safety A+; Watch: crime C-, amenities F, commute F.
- Barberton City (suburban): math 47% / reading 51% proficiency, ranked #466 of 656 in OH (top 71%) — families likely to look elsewhere, expect single-tenant / working-renter base with shorter leases; 62% free/reduced lunch — lower-income household profile, screen leases tightly.
- Market conditions: Rents rising fast (+5.9%/yr); 219 active listings in the ZIP; 15 comparable units currently listed for rent nearby; rentals at typical pace (median 22d on market — plan ~3-4 weeks tenant-placement turnaround); 1,114 units permitted in Summit County in 2024 (397 in 5+ unit buildings).
Forward outlook
- Local home prices are declining (-3.0%/yr); year-one equity from $968 of loan paydown is wiped out by about $4k of value loss. Plan a longer hold.
- Summit County population projected to shrink 6% by 2050 — rents likely to lag national; underwrite the cash flow, not the appreciation.
Negotiation context
- It's been on market 20 days — a 2% lower offer ($138k) is reasonable based on typical stale-listing flexibility.
- 6 sale attempts since 35y ago with the ask held roughly flat each time — persistent listings suggest the price (not the market) is what's stuck; bring a comps-based counter.
- Current owner paid $58k; list at $140k implies a 141% gain — meaningful room to come down on a strong offer.
Risks & watch-outs
- Watch-outs: built in 1928 — expect roof / HVAC / electrical / plumbing capex.
Questions for the listing agent
- Built in 1928 — when were the roof, HVAC, electrical panel, plumbing, and water heater last replaced?
- Is there a deadline driving the sale (1031 exchange, divorce, estate, relocation)? That informs how much negotiation room exists.
- What's the average days-on-market for RENTAL listings here right now (not sales)? A rising rental-DOM trend means longer vacancies and softer asking-rent achievability than the comps imply.
- What's the recent tenant-quality profile in this submarket — average credit score on applications, eviction rate, late-payment / NSF rate, and stable-employment percentage? A property-management company in the area should have these aggregated.
- How much new for-sale + rental construction is in the pipeline within 1–3 miles? Heavy new supply typically softens prices + rents 12–24 months out; constrained supply supports both.
Investment metrics
- 1% rule
- 0.97% ✗
- Cap rate
- 7.45%
- Cash-on-cash
- 4.14%
- DSCR
- 1.18
- GRM
- 8.6
CMA / ARV
- ARV (on-the-fly)
- $174,720
- Comps found
- 12
Show comp detail 12 sales within ~0.75 mi
| Address | Dist | Beds/Ba | Sqft | Sold | Price | $/sf | Match |
|---|---|---|---|---|---|---|---|
| 103 Norwood St | 0.27mi | 3/2.0 | 1,301 (+4%) | 2mo | $129,500 | $100 | 75 |
| 324 W State St | 0.28mi | 3/2.0 | 1,131 (-9%) | 0mo | $210,000 | $186 | 67 |
| 134 Hazelwood Ave | 0.13mi | 3/2.0 | 1,062 (-15%) | 2mo | $212,500 | $200 | 64 |
| 26 W Hiram St | 0.23mi | 4/2.0 (+1) | 1,358 (+9%) | 3mo | $190,000 | $140 | 63 |
| 135 Yonker St | 0.43mi | 3/1.0 | 1,140 (-9%) | 5mo | $77,917 | $68 | 62 |
| 2650 30th St SW | 0.58mi | 3/1.0 | 1,134 (-9%) | 1mo | $62,500 | $55 | 57 |
| 162 Mitchell St | 0.50mi | 3/1.0 | 1,104 (-12%) | 2mo | $175,000 | $159 | 56 |
| 1923 Caroline Ave | 0.59mi | 3/1.5 | 1,128 (-10%) | 2mo | $249,100 | $221 | 53 |
| 1201 Weiser Ave | 0.75mi | 3/1.0 | 1,144 (-8%) | 1mo | $137,000 | $120 | 50 |
| 589 Highland Ave | 0.44mi | 2/1.5 (-1) | 1,380 (+11%) | 7mo | $113,000 | $82 | 49 |
| 1288 Tampa Ave | 0.58mi | 2/1.0 (-1) | 1,104 (-12%) | 6mo | $111,100 | $101 | 44 |
| 1952 Caroline Ave | 0.62mi | 3/3.0 | 1,402 (+12%) | 1mo | $280,000 | $200 | 42 |
Match score weights: distance 35% · size 25% · config 20% · recency 20%. Top-matched comps best support the ARV.
Projected returns pro-forma
-3.0% appreciation · 5.86% rent growth · sell at horizon
- IRR
- -6.7%
- Equity multiple
- 0.74×
- Total profit
- $-10,046
- Equity at exit
- $20,874
- IRR
- 6.0%
- Equity multiple
- 1.51×
- Total profit
- $19,879
- Equity at exit
- $12,105
Cash invested: $39,200 (down + closing). Projections, not guarantees.
Landlord ↔ Tenant lean methodology
- Overall (STATE)
- 73 Landlord-Friendly
- State Ohio
- 73 Landlord-Friendly · R+6
- County
- — inherits STATE
- City
- — inherits STATE
ZIP-level market 44203
- Rents YoY
- 5.9%
- Active inventory
- 219
- Price-to-rent
- 8.6×
Monthly cashflow live
- Estimated rent
- $1,361 high interval (Pro) →
- Mortgage (P&I)
- −$734
- Tax from tax record
- −$147 /mo · $1,767/yr
- Insurance
- −$58
- HOA
- −$0
- Vacancy / Maint / Mgmt
- −$286
- Net cashflow
- $135
Break-even live
Sensitivity live
| Price | -10% $214 | -5% $175 | +0% $135 | +5% $96 | +10% $56 |
|---|---|---|---|---|---|
| Rent | -10% $28 | -5% $81 | +0% $135 | +5% $189 | +10% $243 |
| Rate | -1.0pp $206 | -0.5pp $171 | base $135 | +0.5pp $99 | +1.0pp $62 |
UW: 25.0% down · 7.5% · 30yr · 1.5% tax · 5.0% vac · 8.0% maint · 8.0% mgmt
Financing live
Cash to close
- Down payment
- $35,000
- Closing costs
- $4,200
- Reserves months
- —
- Total cash needed
- —
Loan-product check · same deal, 3 products live
Conventional
25% down · 7.5% · 30yr
- Down + closing
- —
- Monthly P&I
- —
- Monthly cashflow
- —
- DSCR
- —
- Eligible?
- —
Personal DTI + credit; lowest rate.
DSCR
20% down · 8.5% · 30yr
- Down + closing
- —
- Monthly P&I
- —
- Monthly cashflow
- —
- DSCR
- —
- Eligible?
- —
No personal income docs; deal must DSCR.
Hard money
10% down · 12.0% · 12mo
- Down + closing
- —
- Monthly P&I
- —
- Monthly cashflow
- —
- DSCR
- —
- Eligible?
- —
Short-term bridge; refi at stabilization.
Rent comps 15 comps
| Address | Beds | Baths | Sqft | Rent | $/sqft | DOM | Units | Dist |
|---|---|---|---|---|---|---|---|---|
| 1453 Woodbirch Ave Akron, OH | 3.0 | 2.0 | 1008 | $1,500 | $1.49 | 44d | 1 | 0.72mi |
| 1455 Woodbirch Ave Akron, OH | 3.0 | 2.0 | 1008 | $1,500 | $1.49 | 21d | 1 | 0.73mi |
| 1169 Weiser Ave Akron, OH | 2.0 | 1.0 | 768 | $950 | $1.24 | 44d | 1 | 0.80mi |
| 1292 W Wilbeth Rd Akron, OH | 3.0 | 1.0 | 1248 | $1,200 | $0.96 | 21d | 1 | 0.82mi |
| 1253 California Ave Akron, OH | 2.0 | 1.0 | 780 | $1,100 | $1.41 | 45d | 1 | 0.86mi |
| 1253 California Ave Akron, OH | 2.0 | 1.0 | 780 | $950 | $1.22 | 24d | 1 | 0.86mi |
| 1138 Kohler Ave Akron, OH | 3.0 | 1.0 | 1000 | $1,250 | $1.25 | 14d | 1 | 0.86mi |
| 2569 Romig Rd Unit 2561-16 Akron, OH | 2.0 | 1.5 | 810 | $1,125 | $1.39 | 14d | 1 | 0.89mi |
| 653 Washington Ave Barberton, OH | 4.0 | 2.0 | 1360 | $1,600 | $1.18 | 21d | 1 | 0.92mi |
| 543 Otterbein Ave Barberton, OH | 4.0 | 1.0 | 1100 | $1,500 | $1.36 | 14d | 1 | 0.96mi |
| 1304 Kellogg Ave Akron, OH | 2.0 | 2.0 | 1148 | $2,000 | $1.74 | 14d | 1 | 1.08mi |
| 2138 East Ave Akron, OH | 3.0 | 1.0 | 990 | $1,100 | $1.11 | 24d | 1 | 1.21mi |
| 1029 Harpster Ave Akron, OH | 4.0 | 1.0 | 1403 | $1,250 | $0.89 | 14d | 1 | 1.43mi |
| 2211 18th St SW Akron, OH | 3.0 | 1.0 | 1332 | $1,250 | $0.94 | 14d | 1 | 1.47mi |
| 617 Robinson Ave Barberton, OH | 2.0 | 1.0 | 1140 | $995 | $0.87 | 14d | 1 | 1.48mi |
Listing history 15 events
-
2026-06-18days on market $140,000 Active 20 DOM
-
2026-06-17days on market $140,000 Active 19 DOM
-
2026-06-16days on market $140,000 Active 18 DOM
-
2026-06-15days on market $140,000 Active 17 DOM
-
2026-06-14days on market $140,000 Active 15 DOM
-
2026-06-10days on market $140,000 Active 12 DOM
-
2026-06-09days on market $140,000 Active 11 DOM
-
2026-06-08days on market $140,000 Active 10 DOM
-
2026-06-07days on market $140,000 Active 9 DOM
-
2026-06-03days on market $140,000 Active 5 DOM
-
2026-06-02days on market $140,000 Active 4 DOM
-
2026-06-01days on market $140,000 Active 3 DOM
-
2026-05-31days on market $140,000 Active 2 DOM
-
2026-05-31remarks 324-char remark
-
2026-05-31$140,000 Active 1 DOM
ⓘ Source: listings_history table (triggers on properties + properties_extension) + one-shot
backfill from property_details.listing_events for pre-trigger history.
Tax reassessment forecast OH · Partial reset (capped growth)
- Current annual tax
- $1,767 · $147/mo
- Projected year-2 tax
- $1,976 · $165/mo
- Expected delta
- +$208/yr (+$17/mo · 11.8%)
ⓘ Screening estimate from a state-policy table — verify with the county assessor before closing.
Climate risk First Street
- Flood 1/10 Low FEMA zone X (unshaded) · 0% chance over 30 yrs
- Wildfire 1/10 Low
- Heat 3/10 Moderate 7 d/yr ≥97°F today · 17 d/yr by 30 yrs out
- Wind 1/10 Low
- Air quality 2/10 Low 0 unhealthy d/yr today · 1 by 30 yrs out
Nearby sold comps map
Loading sold comps map…
Walkable amenities ~0.75 mi
Loading nearby amenities…
Taxation est. · year 1
- Rental income
- $16,328
- − Mortgage interest
- −$7,842
- − Property taxes
- −$1,767
- − Insurance
- −$700
- − Repairs & maintenance
- −$1,306
- − Management
- −$1,306
- − Depreciation
- −$4,073
- Taxable loss
- −$666
- Est. tax savings @ 24.0%
- +$160
- After-tax cash flow
- $1,782/yr
For passive investors: Depreciation is non-cash, so a rental often shows a tax loss while cash-flowing — sheltering income. Rental losses are passive: they offset passive income freely, and up to $25,000/yr can offset ordinary (W-2) income if you actively participate and your MAGI is under $100k (phasing out to $0 by $150k); unused losses carry forward. On sale, claimed depreciation is recaptured at up to 25%, and gains may owe capital-gains tax (a 1031 exchange can defer both). Figures are a year-1 estimate at your 24.0% rate — not tax advice; consult a CPA.
Schools (NCES district)
- District
- Barberton City
- NCES district ID
- 3904353
- Math proficiency
- 47% ▼ -9.00%
- Reading proficiency
- 51% ▼ -9.00%
- Median HH income
- $37,660
- Composite
- 40.77/100
- National rank
- #3646
- State rank
- #466 of 656 in OH
Livability — Barberton
- Score
- 71/100
- State rank
- #428
- US rank
- #7016
Category grades
Schools grade is shown separately in the Schools card above.
Census & demographics
- Census place
- Barberton, OH
- County
- Summit County · 440,783 people
- City population
- 38,701
- Metro
- Akron, OH
- Population (ZIP)
- 38,701
- Household income
- $63,759
- Rent vs Own
- Severe rent burden
- 805.0
Population outlook (Summit County) Hauer SSP2
- Today (2025)
- 546,583 people
- By 2030
- 544,028 · -0.5%
- By 2040
- 531,363 · -2.8%
- By 2050
- 514,923 · -5.8%
- By 2075
- 481,765 · -11.9%
- By 2100
- 432,265 · -20.9%
Race, ethnicity, and origin ACS 2023
- Neighborhood character
- Predominantly White (86%)
- Race & ethnicity
- White 86% Black 7% Two or more races 5% Hispanic / Latino 1%
- Common ancestry
- Romanian 3% Slovak 2% Italian 1%
- Foreign-born
- 2% · Canada
- Languages at home
- 97% English-only · Russian/Polish/Slavic 1% Spanish 1%
Political lean MEDSL · Summit
- 2024 margin
- Lean D (+7.0) · D 53.0% · R 46.0%
- 2008→2024 swing
- -9.6pp toward R · 2008: 16.6pp · 2024: 7.0pp
- All cycles
- 2024: D+7.0 2020: D+9.6 2016: D+8.2 2012: D+14.8 2008: D+16.6
Not yet ingested
- Civics
- —
Market trends
- HPI YoY
- ▼ -224.82%
- Current HPI
- 199.8143
- Rent YoY
- ▲ 5.86%
- Metro
- Akron, OH
- State GDP YoY
- ▲ 1.98%
- F500 in state
- 48
Industry mix (Fortune 500 HQ in OH)
| Industry | F500 HQs | Revenue |
|---|---|---|
| Insurance | 3 | $145B |
|
||
| Industrial Machinery | 3 | $49B |
|
||
| Financial Services | 3 | $24B |
|
||
| Consumer Goods | 2 | $93B |
|
||
| Aerospace / Defense | 2 | $47B |
|
||
| Utilities | 2 | $33B |
|
||
Price history
+400.0% since first listed15 events — show timeline
- 2026-05-29 Listed $140,000 MLSNOW
- 2023-09-15 Pending — MLSNOW
- 2023-09-11 Sold (Public Records) $58,000 Public Records
- 2023-09-08 Sold (MLS) $58,000 MLSNOW
- 2023-08-08 Contingent — MLSNOW
- 2023-08-07 Listed $69,900 MLSNOW
- 2004-04-09 Listing Removed — MLSNOW
- 2003-12-09 Listed $84,900 MLSNOW
- 1993-04-30 Sold (Public Records) $39,000 Public Records
- 1993-01-08 Listed $39,900 MLSNOW
- 1992-12-16 Listing Removed — MLSNOW
- 1992-06-22 Listed $43,900 MLSNOW
- 1992-06-01 Listing Removed — MLSNOW
- 1991-11-04 Listed $47,500 MLSNOW
- 1985-06-26 Sold (Public Records) $28,000 Public Records
Property tax history
+2.9%/yrLatest (2025): $1,767 · +0.3% YoY. Source: county tax records.
Cash-flow waterfall
monthlySold comps — $/sqft
last 12 mo · ≤1 miLoading sold comps…