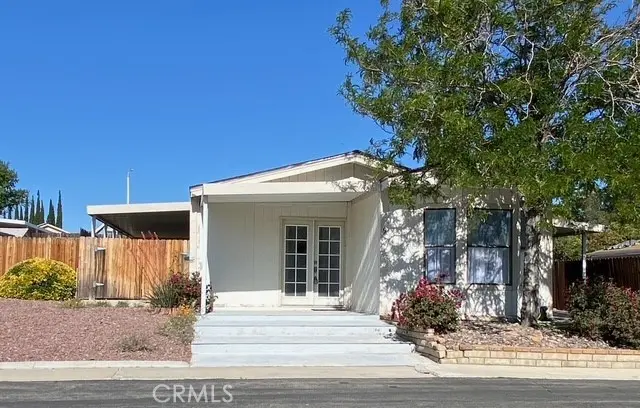
12250 Main St #9 · Hesperia, CA
Flood risk No data
- FEMA flood zone
- —
- Chance of flooding over 30 yrs
- —
- Est. flood insurance / yr
- —
Fire risk No data
- Est. fire insurance / yr
- —
Heat risk No data
- Hot days now (above threshold)
- —
- Hot days in 30 yrs
- —
Wind risk No data
- Chance of severe wind over 30 yrs
- —
Air-quality risk No data
- Unhealthy air days now
- —
- Unhealthy air days in 30 yrs
- —
Risk factors via First Street. Map © Google.
Why this score? — see what drove the B- grade
The composite is a weighted blend of 9 inputs, each scored 0–100. Each bar is that input's sub-score; the figure is the points it added to the 100-point composite (weight × sub-score).
- Cash flow +30.0/30.0
- DSCR +10.0/10.0
- 1% rule +9.6/10.0
- ARV discount +9.6/15.0
- Schools +2.6/10.0
- Livability +2.6/5.0
- Rent growth +2.5/5.0
- Condition / age +2.5/5.0
- Appreciation +0.0/10.0
$155,000
🖨 Deal sheet 📄 Offer letter ✓ Due diligence
Listing remarks
Beautifully remodeled and thoughtfully upgraded in April/May 2026, this spacious 2-bedroom, 2-bath all-electric home is located in a gated senior community in the heart of Hesperia. Offering approximately 1,200 sq. ft. of living space, this move-in-ready home was redesigned with comfort, accessibility, and ease of living in mind. Remodeling choices and design were carefully overseen by a former AARP editor with consideration for the needs of today’s active 55+ lifestyle. The upgraded kitchen features updated cabinetry, butcher block countertops, a stainless steel farmhouse sink, and includes newer appliances, refrigerator, dishwasher, stove, washer, and dryer. Stylish wood-look plank
Key facts
- Community pool
- Built 1988
- Listed 41 days
Property features AI
Finance
- Other: Rent includes pool (for rentals); Lot information sourced from assessor's data
- Financial info: Land lease in park (monthly)
- HOA & community: Senior community; Park name: Willow Oaks Estates; Community features include sidewalks and suburban setting; Manager approval required; Pets: call for details
Exterior
- Parking: Covered parking; Attached carport; Concrete driveway (paved, uphill from street); Additional driveway parking
- Security: Automatic gate; Gated community; Resident manager; Smoke and carbon monoxide detectors
- Utilities: District/public water; Public sewer; Standard electric service; Telephone in street; Cable available; Electricity and water connected; Sewer connected
- Home design: Single-story mobile home (model: CAREFREE); Double body type; Mobile home remains on site; Entry at main level facing Main Street; Has a view
- Construction: Wood construction elements (fence and skirt); Listed year-built source: public records
- Exterior features: Front covered porch; Open concrete patio; In-ground community pool (fenced); Wood skirt; Wood fencing; Landscaped yard; Desert-back setting; Gentle slope; Paved surfaces
Interior
- Kitchen: Remodeled kitchen; Refrigerator; Electric range and oven; Dishwasher; Water heater unit (electric)
- Bedrooms: Primary bedroom (main floor); Primary suite/retreat
- Flooring: Vinyl flooring; Carpet
- Bathrooms: 2 full bathrooms; Upgraded finishes; Walk-in shower; Shower in tub; Bathtub
- Heating & cooling: Central cooling (gas/electric); Central furnace heating
- Interior features: Ceiling fans; Stone counters; Cathedral/vaulted ceilings; French doors; Community spa
- Laundry & utility: Inside laundry room; Washer included; Dryer included; Washer and electric dryer hookups
Neighborhood map
What this means for you Summary
Snapshot
- This is a 2-bed/2.0-bath manufactured listed at $155k.
Deal economics
- At list price, monthly cash flow is $723 ($9k/yr) — positive.
- The deal already cash-flows at list — no discount required.
- Meets the 1% rule at list price ($2k rent vs $155k).
- Recommended offer: $150k (3.0% below list) — sets the bar for market timing.
- Cap rate 11.9% vs local median 3.7% in Hesperia — top-decile yield for the area; either an underpriced asset or a hidden risk that comps aren't pricing in. Stress-test before assuming the spread holds.
Location & tenants
- Location reads 52/100 on livability (#1,009 in CA) — a working-class tenant base; expect higher turnover. Strengths: housing A+; Watch: employment D, schools F, crime D-.
- Hesperia Unified (suburban): math 20% / reading 39% proficiency, ranked #353 of 517 in CA (top 68%) — low school quality limits family demand, transient renter base, plan for 1-2y turnover; 61% free/reduced lunch — lower-income household profile, screen leases tightly.
- Market conditions: 195 active listings in the ZIP; 1 comparable units currently listed for rent nearby; solid renter incomes; 5,458 units permitted in San Bernardino County in 2024 (1,500 in 5+ unit buildings).
Forward outlook
- Local home prices are declining (-3.0%/yr); year-one equity from $1k of loan paydown is wiped out by about $5k of value loss. Plan a longer hold.
- San Bernardino County population projected at +15% by 2050 — modest demand growth; plan on rents tracking national, not racing it.
- At projected returns (-3.0% appreciation + 3.0% rent growth), your $43k cash investment doubles in ~7 years — after that, you're playing with house money.
Negotiation context
- It's been on market 41 days — a 3% lower offer ($150k) is reasonable based on typical stale-listing flexibility.
Questions for the listing agent
- It's been on market 41 days. Have you received any prior offers? Is the seller open to a 3% concession, seller financing, or rate buy-down credit?
- Is there a deadline driving the sale (1031 exchange, divorce, estate, relocation)? That informs how much negotiation room exists.
- Schools are F-rated, which usually means shorter tenancies and higher turnover. Who's the typical renter profile here, and what's been the actual vacancy rate?
- Crime grade is D in this area — have there been break-ins, vandalism, or insurance claims at this property in the last 3 years? What carrier currently insures it and at what premium?
- What's the average days-on-market for RENTAL listings here right now (not sales)? A rising rental-DOM trend means longer vacancies and softer asking-rent achievability than the comps imply.
- What's the recent tenant-quality profile in this submarket — average credit score on applications, eviction rate, late-payment / NSF rate, and stable-employment percentage? A property-management company in the area should have these aggregated.
- How much new for-sale + rental construction is in the pipeline within 1–3 miles? Heavy new supply typically softens prices + rents 12–24 months out; constrained supply supports both.
Investment metrics
- 1% rule
- 1.46% ✓
- Cap rate
- 11.89%
- Cash-on-cash
- 19.98%
- DSCR
- 1.89
- GRM
- 5.7
CMA / ARV
- ARV (median comp)
- $162,754
- List price
- $155,000
- Delta
- -4.76%
- Verdict
- FAIR
- Comps
- 10 within 1.0 mi
Show comp detail 4 sales within ~0.75 mi
| Address | Dist | Beds/Ba | Sqft | Sold | Price | $/sf | Match |
|---|---|---|---|---|---|---|---|
| 12550 Main St #13 | 0.19mi | 2/2.0 | 1,066 (-2%) | 2mo | $143,000 | $134 | 87 |
| 12550 Main St #8 | 0.19mi | 2/2.0 | 1,152 (+6%) | 1mo | $105,000 | $91 | 80 |
| 12550 Main St #56 | 0.19mi | 2/2.0 | 1,080 (-0%) | 18mo | $125,000 | $116 | 76 |
| 12550 Main #5 | 0.19mi | 3/2.0 (+1) | 1,152 (+6%) | 24mo | $130,000 | $113 | 56 |
Match score weights: distance 35% · size 25% · config 20% · recency 20%. Top-matched comps best support the ARV.
Projected returns pro-forma
-3.0% appreciation · 3.0% rent growth · sell at horizon
- IRR
- 12.1%
- Equity multiple
- 1.48×
- Total profit
- $20,934
- Equity at exit
- $23,111
- IRR
- 21.1%
- Equity multiple
- 2.79×
- Total profit
- $77,622
- Equity at exit
- $13,402
Cash invested: $43,400 (down + closing). Projections, not guarantees.
Landlord ↔ Tenant lean methodology
- Overall (STATE)
- 18 Strongly Tenant-Friendly
- State California
- 18 Strongly Tenant-Friendly · D+13
- County
- — inherits STATE
- City
- — inherits STATE
ZIP-level market 92344
- Home prices YoY
- -8.5%
- Active inventory
- 195
- Price-to-rent
- 5.7×
Monthly cashflow live
- Estimated rent
- $2,270 medium interval (Pro) →
- Mortgage (P&I)
- −$813
- Tax est. 1.5%
- −$194 /mo · $2,325/yr
- Insurance
- −$65
- HOA
- −$0
- Vacancy / Maint / Mgmt
- −$477
- Net cashflow
- $723
Break-even live
UW: 25.0% down · 7.5% · 30yr · 1.5% tax · 5.0% vac · 8.0% maint · 8.0% mgmt
Financing live
Cash to close
- Down payment
- $38,750
- Closing costs
- $4,650
- Reserves months
- —
- Total cash needed
- —
Loan-product check · same deal, 3 products live
Conventional
25% down · 7.5% · 30yr
- Down + closing
- —
- Monthly P&I
- —
- Monthly cashflow
- —
- DSCR
- —
- Eligible?
- —
Personal DTI + credit; lowest rate.
DSCR
20% down · 8.5% · 30yr
- Down + closing
- —
- Monthly P&I
- —
- Monthly cashflow
- —
- DSCR
- —
- Eligible?
- —
No personal income docs; deal must DSCR.
Hard money
10% down · 12.0% · 12mo
- Down + closing
- —
- Monthly P&I
- —
- Monthly cashflow
- —
- DSCR
- —
- Eligible?
- —
Short-term bridge; refi at stabilization.
Rent comps 1 comps
| Address | Beds | Baths | Sqft | Rent | $/sqft | DOM | Units | Dist |
|---|---|---|---|---|---|---|---|---|
| 13500 Live Oak St Hesperia, CA | 2.0 | 1.0–2.0 | 901 | $2,222 | $2.47 | 3d | 6 | 1.17mi |
Listing history 16 events
-
2026-06-18days on market $155,000 Active 41 DOM
-
2026-06-17days on market $155,000 Active 40 DOM
-
2026-06-16days on market $155,000 Active 39 DOM
-
2026-06-15days on market $155,000 Active 38 DOM
-
2026-06-13days on market $155,000 Active 36 DOM
-
2026-06-13days on market $155,000 Active 35 DOM
-
2026-06-09days on market $155,000 Active 32 DOM
-
2026-06-08days on market $155,000 Active 31 DOM
-
2026-06-07days on market $155,000 Active 30 DOM
-
2026-06-04days on market $155,000 Active 27 DOM
-
2026-06-03days on market $155,000 Active 26 DOM
-
2026-06-02days on market $155,000 Active 25 DOM
-
2026-06-01days on market $155,000 Active 24 DOM
-
2026-05-31days on market $155,000 Active 23 DOM
-
2026-05-08$155,000 Active 1913-char remark
-
2026-05-07historical $155,000 1913-char remark
ⓘ Source: listings_history table (triggers on properties + properties_extension) + one-shot
backfill from property_details.listing_events for pre-trigger history.
Nearby sold comps map
Loading sold comps map…
Walkable amenities ~0.75 mi
Loading nearby amenities…
Taxation est. · year 1
- Rental income
- $27,246
- − Mortgage interest
- −$8,682
- − Property taxes
- −$2,325
- − Insurance
- −$775
- − Repairs & maintenance
- −$2,180
- − Management
- −$2,180
- − Depreciation
- −$4,509
- Taxable income
- $6,595
- Est. tax owed @ 24.0%
- −$1,583
- After-tax cash flow
- $7,087/yr
For passive investors: Depreciation is non-cash, so a rental often shows a tax loss while cash-flowing — sheltering income. Rental losses are passive: they offset passive income freely, and up to $25,000/yr can offset ordinary (W-2) income if you actively participate and your MAGI is under $100k (phasing out to $0 by $150k); unused losses carry forward. On sale, claimed depreciation is recaptured at up to 25%, and gains may owe capital-gains tax (a 1031 exchange can defer both). Figures are a year-1 estimate at your 24.0% rate — not tax advice; consult a CPA.
Schools (NCES district)
- District
- Hesperia Unified
- NCES district ID
- 0600014
- Math proficiency
- 20% ▼ -4.00%
- Reading proficiency
- 39% ▲ 4.00%
- Median HH income
- $49,376
- Composite
- 25.66/100
- National rank
- #7397
- State rank
- #353 of 517 in CA
Livability — Hesperia
- Score
- 52/100
- State rank
- #1009
- US rank
- #24896
Category grades
Schools grade is shown separately in the Schools card above.
Census & demographics
- Census place
- Hesperia, CA
- County
- San Bernardino County · 2,030,291 people
- City population
- 110,055
- Metro
- Riverside-San Bernardino-Ontario, CA
- Population (ZIP)
- 21,349
- Household income
- $98,071
- Rent vs Own
- Severe rent burden
- 145.0
Population outlook (San Bernardino County) Hauer SSP2
- Today (2025)
- 2,300,329 people
- By 2030
- 2,378,907 · +3.4%
- By 2040
- 2,523,137 · +9.7%
- By 2050
- 2,642,388 · +14.9%
- By 2075
- 2,880,769 · +25.2%
- By 2100
- 2,909,436 · +26.5%
Race, ethnicity, and origin ACS 2023
- Neighborhood character
- Diverse neighborhood (Simpson 0.60)
- Race & ethnicity
- Hispanic / Latino 51% White 36% Two or more races 18% Asian 5% Black 4%
- Hispanic origin (detail)
- Mexican 43%
- Common ancestry
- Romanian 5% Italian 2% Slovak 2%
- Foreign-born
- 16% · Canada, China, Guatemala
- Languages at home
- 61% English-only · Spanish 33% Chinese 2% Other Indo-European 1%
Political lean MEDSL · San Bernardino
- 2024 margin
- Toss-up / Even · D 47.5% · R 49.7% · Other 2.8%
- 2008→2024 swing
- -8.5pp toward R · 2008: 6.3pp · 2024: -2.1pp
- All cycles
- 2024: R+2.1 2020: D+10.7 2016: D+9.8 2012: D+5.4 2008: D+6.3
Not yet ingested
- Civics
- —
Market trends
- HPI YoY
- ▼ -32.11%
- Current HPI
- 345.9998
- Rent YoY
- —
- Metro
- Riverside-San Bernardino-Ontario, CA
- State GDP YoY
- ▲ 3.21%
- F500 in state
- 116
Industry mix (Fortune 500 HQ in CA)
| Industry | F500 HQs | Revenue |
|---|---|---|
| Technology | 27 | $1,492B |
|
||
| Financial Services | 3 | $174B |
|
||
| Retail | 3 | $44B |
|
||
| Insurance | 3 | $26B |
|
||
| Media / Entertainment | 2 | $115B |
|
||
| Pharmaceuticals / Biotech | 2 | $62B |
|
||
Price history
+0.0% since first listed2 events — show timeline
- 2026-05-08 Listed $155,000 CRMLS
- 2026-05-07 Coming Soon $155,000 CRMLS
Property tax history
-3.2%/yrLatest (2025): $245 · +0.4% YoY. Source: county tax records.
Cash-flow waterfall
monthlySold comps — $/sqft
last 12 mo · ≤1 miLoading sold comps…