 Fourplex
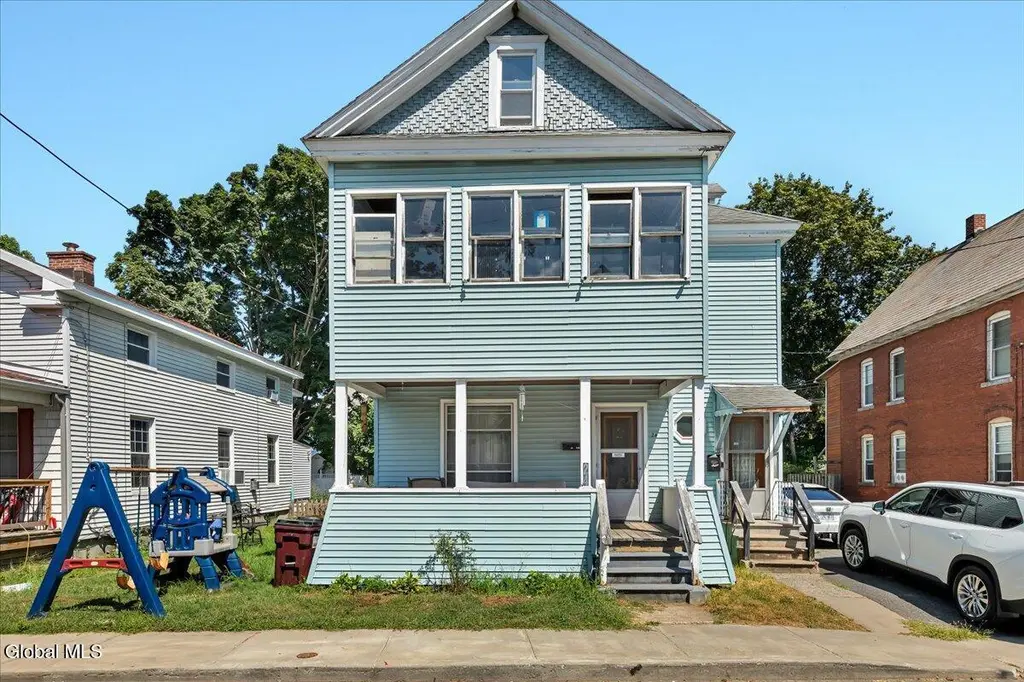
24 Green St · Mechanicville, NY
Flood risk 1/10 · Minimal
- FEMA flood zone
- X
- Chance of flooding over 30 yrs
- 0.0%
- Est. flood insurance / yr
- $473 – $860
Fire risk 3/10 · Minor
- Est. fire insurance / yr
- $691 – $1,283
Heat risk 4/10 · Minor
- Hot days now (above 97°F)
- 7 days/yr
- Hot days in 30 yrs
- 17 days/yr
Wind risk 3/10 · Minor
- Chance of severe wind over 30 yrs
- 6.0%
Air-quality risk 2/10 · Minimal
- Unhealthy air days now
- 0 days/yr
- Unhealthy air days in 30 yrs
- 1 days/yr
Risk factors via First Street. Map © Google.
Why this score? — see what drove the A grade
The composite is a weighted blend of 9 inputs, each scored 0–100. Each bar is that input's sub-score; the figure is the points it added to the 100-point composite (weight × sub-score).
- Cash flow +30.0/30.0
- ARV discount +14.2/15.0
- 1% rule +10.0/10.0
- DSCR +10.0/10.0
- Appreciation +10.0/10.0
- Schools +4.9/10.0
- Livability +3.4/5.0
- Rent growth +2.5/5.0
- Condition / age +2.5/5.0
$385,000
🖨 Deal sheet 📄 Offer letter ✓ Due diligence
Multi-family units
County records classify this as Multi-Family (2-4 Unit). Listing-text estimate: 4 units. confirmed
Listing remarks
Solid 4-Unit Investment with Significant Value-Add Potential. This well-built 4-family property offers a strong structure and functional layout, providing an excellent foundation for your next investment. Fully rented and generating income from day one, the building itself is solid, while the units need some updating and TLC--creating a great opportunity to renovate, increase rents, and build substantial equity. Key improvements include four separate 100-amp electric services and all newer replacement windows, adding long-term value and efficiency. Additional highlights include off-street parking with a covered carport, enhancing convenience for tenants. Ideal for investors looking to add v
Key facts
- 5,227 sq ft lot
- 5 parking spots
- Built 1940
Property features AI
Finance
- Financial info: Four-unit multi-family property (4 total units); Tenants responsible for hot water and electricity
Exterior
- Parking: Off-street parking; Carport; Driveway; Five parking spaces total
- Utilities: Public water; Public sewer; 100 amp electric service with circuit breakers
- Home design: Quadruplex; 2-story units present; Stone foundation; Vinyl siding construction; Asphalt roof
- Construction: Stone foundation; Vinyl siding; Asphalt roof
- Exterior features: Covered front porch; Cleared lot
Interior
- Kitchen: Each unit includes a kitchen
- Bedrooms: Unit 1: 1 bedroom (1st floor); Unit 2: 2 bedrooms (1st floor); Unit 3: 2 bedrooms (2nd floor); Unit 4: 1 bedroom (2nd floor)
- Flooring: Vinyl flooring; Wood flooring
- Bathrooms: Four full bathrooms total; Unit 1: 1 full bath (1st floor); Unit 2: 1 full bath plus 1 full bath in basement; Unit 3: 1 full bath (2nd floor); Unit 4: 1 full bath (2nd floor)
- Heating & cooling: Baseboard heating; Natural gas heating
- Interior features: Ceiling paddle fan; Full basement
- Laundry & utility: Tenants pay hot water and electricity
Neighborhood map
What this means for you Summary
Snapshot
- This is a 4 × 6-bed/4.0-bath units multifamily listed at $385k.
Deal economics
- At list price, monthly cash flow is $4k ($48k/yr) — positive. Per door: $990/mo.
- The deal already cash-flows at list — no discount required.
- Meets the 1% rule at list price ($8k rent vs $385k).
- Cap rate 18.6% vs local median 1.9% in Mechanicville — top-decile yield for the area; either an underpriced asset or a hidden risk that comps aren't pricing in. Stress-test before assuming the spread holds.
Location & tenants
- Location reads 67/100 on livability (#568 in NY) — a middle-class / working-renter tenant base. Strengths: housing A+, health & safety A+, cost of living B+; Watch: amenities C-, crime D+, employment D.
- Mechanicville City School District (rural): math 57% / reading 57% proficiency, ranked #270 of 590 in NY (top 46%) — acceptable for families but not a draw, mixed tenant base, ~2y average lease.
- Market conditions: 144 active listings in the ZIP; solid renter incomes; 1,132 units permitted in Saratoga County in 2024 (378 in 5+ unit buildings).
- At $8,463/mo this rent would consume 110% of the median local household income ($93k/yr) (locally 552% of renters already pay >50% of income on rent) — very limited rent-growth headroom before tenants either downsize or default.
Forward outlook
- In year one you build about $41k of equity ($3k loan paydown + $38k appreciation (10.0% local appreciation)).
- Saratoga County population projected at +4% by 2050 — modest demand growth; plan on rents tracking national, not racing it.
- At projected returns (10.0% appreciation + 3.0% rent growth), your $108k cash investment doubles in ~2 years — after that, you're playing with house money.
- By year 2, paydown + projected appreciation supports a ~$66k cash-out refi (75% LTV) — recoverable capital for the next deal without selling this one.
Negotiation context
- Only 7 days on market — expect competitive offers; lowballing is unlikely to land.
- 2 sale attempts with the ask held roughly flat each time — persistent listings suggest the price (not the market) is what's stuck; bring a comps-based counter.
Risks & watch-outs
- Watch-outs: built in 1940 — expect roof / HVAC / electrical / plumbing capex.
Questions for the listing agent
- Can we see the unit-by-unit rent roll, current vacancy, and any below-market leases? What's the average tenancy length?
- What capital expenditures (roof, boiler, parking lot, exteriors) have been made in the last 5 years, and what's planned in the next 2?
- Built in 1940 — when were the roof, HVAC, electrical panel, plumbing, and water heater last replaced?
- Is there a deadline driving the sale (1031 exchange, divorce, estate, relocation)? That informs how much negotiation room exists.
- Schools are B-rated — typically a magnet for longer-tenancy family renters. What's the average tenant stay here, and is there a school-zone premium baked into asking?
- Crime grade is D in this area — have there been break-ins, vandalism, or insurance claims at this property in the last 3 years? What carrier currently insures it and at what premium?
- What's the average days-on-market for RENTAL listings here right now (not sales)? A rising rental-DOM trend means longer vacancies and softer asking-rent achievability than the comps imply.
- What's the recent tenant-quality profile in this submarket — average credit score on applications, eviction rate, late-payment / NSF rate, and stable-employment percentage? A property-management company in the area should have these aggregated.
- How much new apartment / multifamily construction is in the pipeline within 1–3 miles? Heavy new supply (>2% of stock underway) typically softens rents 12–24 months out; light construction supports rent growth.
Investment metrics
- 1% rule
- 2.20% ✓
- Cap rate
- 18.64%
- Cash-on-cash
- 44.10%
- DSCR
- 2.96
- GRM
- 3.8
CMA / ARV
- ARV (median comp)
- $452,387
- List price
- $385,000
- Delta
- -14.90%
- Verdict
- UNDERPRICED
- Comps
- 20 within 1.0 mi
Show comp detail 7 sales within ~0.75 mi
| Address | Dist | Beds/Ba | Sqft | Sold | Price | $/sf | Match |
|---|---|---|---|---|---|---|---|
| 221 S 2nd Ave | 0.21mi | 6/2.0 | 3,222 (+1%) | 23mo | $275,000 | $85 | 69 |
| 415 Broadway | 0.37mi | 6/3.0 | 2,843 (-10%) | 4mo | $255,000 | $90 | 58 |
| 136 S Third Ave | 0.27mi | 5/3.0 (-1) | 3,427 (+8%) | 10mo | $405,000 | $118 | 57 |
| 252 S Main St | 0.45mi | 6/2.0 | 2,727 (-14%) | 1mo | $235,000 | $86 | 55 |
| 418 Broadway | 0.40mi | 6/2.0 | 2,752 (-13%) | 8mo | $156,000 | $57 | 52 |
| 215 N 4th Ave | 0.49mi | 6/2.0 | 2,935 (-8%) | 21mo | $269,000 | $92 | 47 |
| 321 N 4th Ave | 0.55mi | 7/2.0 (+1) | 2,788 (-12%) | 3mo | $340,000 | $122 | 46 |
Match score weights: distance 35% · size 25% · config 20% · recency 20%. Top-matched comps best support the ARV.
Projected returns pro-forma
10.0% appreciation · 3.0% rent growth · sell at horizon
- IRR
- 58.6%
- Equity multiple
- 5.29×
- Total profit
- $462,185
- Equity at exit
- $346,839
- IRR
- 52.2%
- Equity multiple
- 11.79×
- Total profit
- $1,162,953
- Equity at exit
- $747,970
Cash invested: $107,800 (down + closing). Projections, not guarantees.
Landlord ↔ Tenant lean methodology
- Overall (STATE)
- 15 Strongly Tenant-Friendly
- State New York
- 15 Strongly Tenant-Friendly · D+10
- County
- — inherits STATE
- City
- — inherits STATE
ZIP-level market 12118
- Home prices YoY
- 8.3%
- Active inventory
- 144
- Price-to-rent
- 15.2×
Monthly cashflow live
- Estimated rent
- $8,463 medium interval (Pro) →
- Mortgage (P&I)
- −$2,019
- Tax from tax record
- −$544 /mo · $6,533/yr
- Insurance
- −$160
- HOA
- −$0
- Vacancy / Maint / Mgmt
- −$1,777
- Net cashflow
- $3,962
Break-even live
4-unit breakdown (identical units grouped — click to expand)
| Units | Beds | Baths | Est. rent |
|---|---|---|---|
| 4× units | 6 | 4 | $8,464 |
| #1 | 6 | 4 | $2,116 |
| #2 | 6 | 4 | $2,116 |
| #3 | 6 | 4 | $2,116 |
| #4 | 6 | 4 | $2,116 |
| Total (4 units) | $8,463 | ||
UW: 25.0% down · 7.5% · 30yr · 1.5% tax · 5.0% vac · 8.0% maint · 8.0% mgmt
Financing live
Cash to close
- Down payment
- $96,250
- Closing costs
- $11,550
- Reserves months
- —
- Total cash needed
- —
Loan-product check · same deal, 3 products live
Conventional
25% down · 7.5% · 30yr
- Down + closing
- —
- Monthly P&I
- —
- Monthly cashflow
- —
- DSCR
- —
- Eligible?
- —
Personal DTI + credit; lowest rate.
DSCR
20% down · 8.5% · 30yr
- Down + closing
- —
- Monthly P&I
- —
- Monthly cashflow
- —
- DSCR
- —
- Eligible?
- —
No personal income docs; deal must DSCR.
Hard money
10% down · 12.0% · 12mo
- Down + closing
- —
- Monthly P&I
- —
- Monthly cashflow
- —
- DSCR
- —
- Eligible?
- —
Short-term bridge; refi at stabilization.
Listing history 4 events
-
2026-05-11status Pending 1015-char remark
-
2026-05-02$385,000 Active 1015-char remark
-
2026-02-17historical
-
2025-08-16$385,000 Active
ⓘ Source: listings_history table (triggers on properties + properties_extension) + one-shot
backfill from property_details.listing_events for pre-trigger history.
Tax reassessment forecast NY · Partial reset (capped growth)
- Current annual tax
- $6,533 · $544/mo
- Projected year-2 tax
- $6,533 · $544/mo
- Expected delta
- $0/yr ($0/mo · 0.0%)
ⓘ Screening estimate from a state-policy table — verify with the county assessor before closing.
Climate risk First Street
- Flood 1/10 Low FEMA zone X · 0% chance over 30 yrs
- Wildfire 3/10 Moderate
- Heat 4/10 Moderate 7 d/yr ≥97°F today · 17 d/yr by 30 yrs out
- Wind 3/10 Moderate 6% chance of damaging wind over 30 yrs
- Air quality 2/10 Low 0 unhealthy d/yr today · 1 by 30 yrs out
Nearby sold comps map
Loading sold comps map…
Walkable amenities ~0.75 mi
Loading nearby amenities…
Taxation est. · year 1
- Rental income
- $101,556
- − Mortgage interest
- −$21,566
- − Property taxes
- −$6,533
- − Insurance
- −$1,925
- − Repairs & maintenance
- −$8,124
- − Management
- −$8,124
- − Depreciation
- −$11,200
- Taxable income
- $44,083
- Est. tax owed @ 24.0%
- −$10,580
- After-tax cash flow
- $36,963/yr
For passive investors: Depreciation is non-cash, so a rental often shows a tax loss while cash-flowing — sheltering income. Rental losses are passive: they offset passive income freely, and up to $25,000/yr can offset ordinary (W-2) income if you actively participate and your MAGI is under $100k (phasing out to $0 by $150k); unused losses carry forward. On sale, claimed depreciation is recaptured at up to 25%, and gains may owe capital-gains tax (a 1031 exchange can defer both). Figures are a year-1 estimate at your 24.0% rate — not tax advice; consult a CPA.
Schools (NCES district)
- District
- Mechanicville City School District
- NCES district ID
- 3618900
- Math proficiency
- 57% ▼ -3.00%
- Reading proficiency
- 57% ▲ 5.00%
- Median HH income
- $57,701
- Composite
- 49.33/100
- National rank
- #2021
- State rank
- #270 of 590 in NY
Livability — Mechanicville
- Score
- 67/100
- State rank
- #568
- US rank
- #10227
Category grades
Schools grade is shown separately in the Schools card above.
Census & demographics
- Census place
- Mechanicville, NY
- County
- Saratoga County · 166,192 people
- City population
- 17,069
- Metro
- Albany-Schenectady-Troy, NY
- Population (ZIP)
- 17,069
- Household income
- $92,710
- Rent vs Own
- Severe rent burden
- 552.0
Population outlook (Saratoga County) Hauer SSP2
- Today (2025)
- 238,889 people
- By 2030
- 243,681 · +2.0%
- By 2040
- 249,118 · +4.3%
- By 2050
- 248,638 · +4.1%
- By 2075
- 241,675 · +1.2%
- By 2100
- 213,150 · -10.8%
Race, ethnicity, and origin ACS 2023
- Neighborhood character
- Predominantly White (88%)
- Race & ethnicity
- White 88% Two or more races 5% Hispanic / Latino 4% Asian 3%
- Common ancestry
- Lithuanian 8% Romanian 8% Iranian 2%
- Foreign-born
- 5% · Canada, China
- Languages at home
- 92% English-only · Spanish 3% Other Indo-European 2% Chinese 1%
Political lean MEDSL · Saratoga
- 2024 margin
- Toss-up / Even · D 50.9% · R 49.1%
- 2008→2024 swing
- -1.6pp toward R · 2008: 3.4pp · 2024: 1.8pp
- All cycles
- 2024: D+1.8 2020: D+5.4 2016: R+4.4 2012: D+2.1 2008: D+3.4
Not yet ingested
- Civics
- —
Market trends
- HPI YoY
- ▲ 26.43%
- Current HPI
- 343.9893
- Rent YoY
- —
- Metro
- Albany-Schenectady-Troy, NY
- State GDP YoY
- ▲ 2.60%
- F500 in state
- 92
Industry mix (Fortune 500 HQ in NY)
| Industry | F500 HQs | Revenue |
|---|---|---|
| Financial Services | 10 | $950B |
|
||
| Consumer Goods | 9 | $162B |
|
||
| Insurance | 4 | $225B |
|
||
| Telecommunications | 2 | $144B |
|
||
| Pharmaceuticals | 2 | $112B |
|
||
| Media / Entertainment | 2 | $69B |
|
||
Price history
+0.0% since first listed4 events — show timeline
- 2026-05-11 Pending — Global MLS
- 2026-05-02 Listed $385,000 Global MLS
- 2026-02-17 Listing Removed — Global MLS
- 2025-08-16 Listed $385,000 Global MLS
Property tax history
+1.2%/yrLatest (2025): $6,533 · +136.8% YoY. Source: county tax records.
Cash-flow waterfall
monthlySold comps — $/sqft
last 12 mo · ≤1 miLoading sold comps…