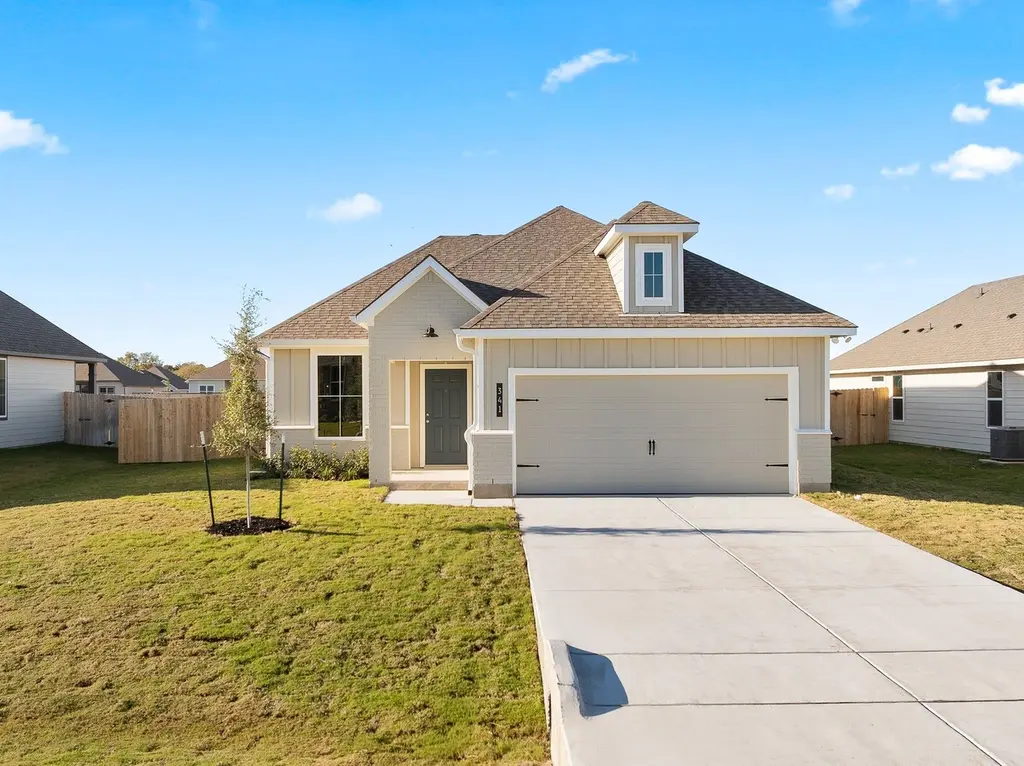
413 Harvest Lake Dr · Snook, TX
Flood risk No data
- FEMA flood zone
- —
- Chance of flooding over 30 yrs
- —
- Est. flood insurance / yr
- —
Fire risk No data
- Est. fire insurance / yr
- —
Heat risk No data
- Hot days now (above threshold)
- —
- Hot days in 30 yrs
- —
Wind risk No data
- Chance of severe wind over 30 yrs
- —
Air-quality risk No data
- Unhealthy air days now
- —
- Unhealthy air days in 30 yrs
- —
Risk factors via First Street. Map © Google.
Why this score? — see what drove the D- grade
The composite is a weighted blend of 9 inputs, each scored 0–100. Each bar is that input's sub-score; the figure is the points it added to the 100-point composite (weight × sub-score).
- ARV discount +8.1/15.0
- Cash flow +8.0/30.0
- Appreciation +5.2/10.0
- Schools +3.6/10.0
- Livability +3.2/5.0
- 1% rule +2.8/10.0
- Rent growth +2.5/5.0
- Condition / age +2.5/5.0
- DSCR +2.0/10.0
$270,900
🖨 Deal sheet (PDF) 📄 Offer letter ✓ Due diligence
Listing remarks MLS
Some images shown may be from a previously built Stylecraft home of similar design. Actual options, colors, and selections may vary. Contact us for details! This charming 3 bedroom, 2 bath home is spacious with a versatile design! Featuring a foyer and galley way entrance, this home feels elegant and special immediately upon your entrance. Some of our favorite things about this floor plan are its large primary bedroom, which includes a massive closet, and enough space for a sitting area in front of the window beaming with natural light. This home is great for entertaining, with so much counter space and its separate formal dining room that flows seamlessly into the kitchen. Additional options included: Stainless steel appliances, a decorative tile backsplash, upgraded Level 2 granite countertops, the kitchen is prewired for pendant lighting, and a dual primary bathroom vanity
Key facts
- 8,524 sq ft lot
- 2 garage spots
- Built 2026
Neighborhood map
What this means for you Summary
Snapshot
- This is a 3-bed/2.0-bath single-family listed at $271k.
Deal economics
- At list price, monthly cash flow is $-278 ($-3k/yr) — negative.
- To cash-flow at today's rent, offer at most $231k (14.9% below list).
- To meet the 1% rule (rent ≥ 1% of price), the offer needs to be $210k (22.5% below list).
- Recommended offer: $210k (22.5% below list) — sets the bar for 1% rule.
Location & tenants
- Location reads 65/100 on livability (#700 in TX) — a middle-class / working-renter tenant base. Strengths: cost of living A+, housing A+, employment B+; Watch: schools C-, amenities F, commute F.
- Snook ISD (rural): math 50% / reading 34% proficiency, ranked #334 of 826 in TX (top 40%) — families likely to look elsewhere, expect single-tenant / working-renter base with shorter leases; 60% free/reduced lunch — lower-income household profile, screen leases tightly.
- Market conditions: 75 active listings in the ZIP; 1 comparable units currently listed for rent nearby; 44 units permitted in Burleson County in 2024 (0 in 5+ unit buildings).
Forward outlook
- In year one you build about $3k of equity ($2k loan paydown + $1k appreciation (0.5% local appreciation)).
- By year 9, paydown + projected appreciation supports a ~$32k cash-out refi (75% LTV) — recoverable capital for the next deal without selling this one.
Negotiation context
- It's been on market 16 days — a 2% lower offer ($267k) is reasonable based on typical stale-listing flexibility.
Questions for the listing agent
- What do current leases actually rent for vs. the listed asking? Can we see a recent rent roll and the last 12 months of T-12 income?
- What does the HOA fee cover, when was the last increase, and are there any pending special assessments or reserve-fund shortfalls?
- Is there a deadline driving the sale (1031 exchange, divorce, estate, relocation)? That informs how much negotiation room exists.
- The area grade is low — what's the realistic commute time and amenity access for the typical tenant pool here? Any planned neighborhood developments (good or bad) we should know about?
- What's the average days-on-market for RENTAL listings here right now (not sales)? A rising rental-DOM trend means longer vacancies and softer asking-rent achievability than the comps imply.
- What's the recent tenant-quality profile in this submarket — average credit score on applications, eviction rate, late-payment / NSF rate, and stable-employment percentage? A property-management company in the area should have these aggregated.
- How much new for-sale + rental construction is in the pipeline within 1–3 miles? Heavy new supply typically softens prices + rents 12–24 months out; constrained supply supports both.
Investment metrics
- 1% rule
- 0.78% ✗
- Cap rate
- 5.06%
- Cash-on-cash
- -4.40%
- DSCR
- 0.80
- GRM
- 10.8
CMA / ARV
- ARV (median comp)
- $274,701
- List price
- $270,900
- Delta
- -1.38%
- Verdict
- FAIR
- Comps
- 20 within 1.0 mi
Show comp detail 12 sales within ~0.75 mi
| Address | Dist | Beds/Ba | Sqft | Sold | Price | $/sf | Match |
|---|---|---|---|---|---|---|---|
| 533 Harvest Lake Dr | 0.13mi | 3/2.5 | 1,415 (+5%) | 1mo | $244,045 | $172 | 83 |
| 306 Harvest Lake Dr | 0.10mi | 3/2.0 | 1,447 (+7%) | 2mo | $269,900 | $187 | 82 |
| 148 Rustic Trce | 0.43mi | 3/2.0 | 1,330 (-1%) | 10mo | $260,000 | $195 | 69 |
| 281 Harvest Lake Dr | 0.14mi | 3/2.0 | 1,447 (+7%) | 15mo | $269,900 | $187 | 69 |
| 486 Harvest Lake Dr | 0.09mi | 3/2.0 | 1,498 (+11%) | 11mo | $279,900 | $187 | 68 |
| 221 Brazos Bnd | 0.24mi | 3/2.0 | 1,504 (+12%) | 2mo | $272,500 | $181 | 68 |
| 510 Harvest Lake Dr | 0.11mi | 3/2.0 | 1,498 (+11%) | 11mo | $279,900 | $187 | 67 |
| 305 Harvest Lake Dr | 0.11mi | 3/2.0 | 1,517 (+12%) | 12mo | $279,900 | $185 | 64 |
| 125 Turnrow Cv | 0.25mi | 3/2.0 | 1,539 (+14%) | 2mo | $289,800 | $188 | 64 |
| 172 Pleasant Path | 0.36mi | 3/2.0 | 1,520 (+13%) | 2mo | $262,000 | $172 | 60 |
| 124 Turnrow Cv | 0.26mi | 3/2.0 | 1,539 (+14%) | 6mo | $289,800 | $188 | 59 |
| 101 Windmill Rd | 0.47mi | 3/2.0 | 1,530 (+13%) | 13mo | $279,900 | $183 | 45 |
Match score weights: distance 35% · size 25% · config 20% · recency 20%. Top-matched comps best support the ARV.
Projected returns pro-forma
0.46% appreciation · 3.0% rent growth · sell at horizon
- IRR
- -5.3%
- Equity multiple
- 0.74×
- Total profit
- $-19,629
- Equity at exit
- $84,978
- IRR
- 0.3%
- Equity multiple
- 1.04×
- Total profit
- $2,772
- Equity at exit
- $107,336
Cash invested: $75,852 (down + closing). Projections, not guarantees.
Landlord ↔ Tenant lean methodology
- Overall (STATE)
- 87 Strongly Landlord-Friendly
- State Texas
- 87 Strongly Landlord-Friendly · R+5
- County
- — inherits STATE
- City
- — inherits STATE
ZIP-level market 77878
- Home prices YoY
- 0.5%
- Active inventory
- 75
- Price-to-rent
- 10.8×
Monthly cashflow live
- Estimated rent
- $2,100 medium interval (Pro) →
- Mortgage (P&I)
- −$1,421
- Tax est. 1.5%
- −$339 /mo · $4,064/yr
- Insurance
- −$113
- HOA
- −$65
- Vacancy / Maint / Mgmt
- −$441
- Net cashflow
- $-278
Break-even live
Sensitivity live
| Price | -10% $-91 | -5% $-185 | +0% $-278 | +5% $-372 | +10% $-465 |
|---|---|---|---|---|---|
| Rent | -10% $-444 | -5% $-361 | +0% $-278 | +5% $-195 | +10% $-112 |
| Rate | -1.0pp $-142 | -0.5pp $-209 | base $-278 | +0.5pp $-348 | +1.0pp $-420 |
UW: 25.0% down · 7.5% · 30yr · 1.5% tax · 5.0% vac · 8.0% maint · 8.0% mgmt
Financing live
Cash to close
- Down payment
- $67,725
- Closing costs
- $8,127
- Reserves months
- —
- Total cash needed
- —
Loan-product check · same deal, 3 products live
Conventional
25% down · 7.5% · 30yr
- Down + closing
- —
- Monthly P&I
- —
- Monthly cashflow
- —
- DSCR
- —
- Eligible?
- —
Personal DTI + credit; lowest rate.
DSCR
20% down · 8.5% · 30yr
- Down + closing
- —
- Monthly P&I
- —
- Monthly cashflow
- —
- DSCR
- —
- Eligible?
- —
No personal income docs; deal must DSCR.
Hard money
10% down · 12.0% · 12mo
- Down + closing
- —
- Monthly P&I
- —
- Monthly cashflow
- —
- DSCR
- —
- Eligible?
- —
Short-term bridge; refi at stabilization.
Rent comps 1 comps
| Address | Beds | Baths | Sqft | Rent | $/sqft | DOM | Units | Dist |
|---|---|---|---|---|---|---|---|---|
| 148 Turnrow Cv Snook, TX | 3.0 | 2.0 | 1790 | $2,100 | $1.17 | 21d | 1 | 0.30mi |
HOA detail
- Monthly dues
- $65 · $780/yr
Listing history 16 events
-
2026-06-18days on market $270,900 Active 16 DOM
-
2026-06-17days on market $270,900 Active 15 DOM
-
2026-06-16days on market $270,900 Active 14 DOM
-
2026-06-15days on market $270,900 Active 13 DOM
-
2026-06-14days on market $270,900 Active 11 DOM
-
2026-06-13days on market $270,900 Active 10 DOM
-
2026-06-10days on market $270,900 Active 8 DOM
-
2026-06-09days on market $270,900 Active 7 DOM
-
2026-06-08days on market $270,900 Active 6 DOM
-
2026-06-07days on market $270,900 Active 5 DOM
-
2026-06-03days on market $270,900 Active 1 DOM
-
2026-06-02days on market $270,900 Active 115 DOM
-
2026-06-01days on market $270,900 Active 114 DOM
-
2026-05-31days on market $270,900 Active 113 DOM
-
2026-05-30days on market $270,900 Active 112 DOM
-
2026-02-07$270,900 Active 888-char remark
Show marketing remark (888 chars)
Some images shown may be from a previously built Stylecraft home of similar design. Actual options, colors, and selections may vary. Contact us for details! This charming 3 bedroom, 2 bath home is spacious with a versatile design! Featuring a foyer and galley way entrance, this home feels elegant and special immediately upon your entrance. Some of our favorite things about this floor plan are its large primary bedroom, which includes a massive closet, and enough space for a sitting area in front of the window beaming with natural light. This home is great for entertaining, with so much counter space and its separate formal dining room that flows seamlessly into the kitchen. Additional options included: Stainless steel appliances, a decorative tile backsplash, upgraded Level 2 granite countertops, the kitchen is prewired for pendant lighting, and a dual primary bathroom vanity
ⓘ Source: listings_history table (triggers on properties + properties_extension) + one-shot
backfill from property_details.listing_events for pre-trigger history.
Nearby sold comps map
Loading sold comps map…
Walkable amenities ~0.75 mi
Loading nearby amenities…
Taxation est. · year 1
- Rental income
- $25,200
- − Mortgage interest
- −$15,175
- − Property taxes
- −$4,064
- − Insurance
- −$1,354
- − Repairs & maintenance
- −$2,016
- − Management
- −$2,016
- − HOA
- −$780
- − Depreciation
- −$7,881
- Taxable loss
- −$8,085
- Est. tax savings @ 24.0%
- +$1,940
- After-tax cash flow
- $-1,397/yr
For passive investors: Depreciation is non-cash, so a rental often shows a tax loss while cash-flowing — sheltering income. Rental losses are passive: they offset passive income freely, and up to $25,000/yr can offset ordinary (W-2) income if you actively participate and your MAGI is under $100k (phasing out to $0 by $150k); unused losses carry forward. On sale, claimed depreciation is recaptured at up to 25%, and gains may owe capital-gains tax (a 1031 exchange can defer both). Figures are a year-1 estimate at your 24.0% rate — not tax advice; consult a CPA.
Schools (NCES district)
- District
- Snook ISD
- NCES district ID
- 4840620
- Math proficiency
- 50% ▲ 8.00%
- Reading proficiency
- 34% ▼ -1.00%
- Median HH income
- $47,667
- Composite
- 36.0/100
- National rank
- #4788
- State rank
- #334 of 826 in TX
Livability — Snook
- Score
- 65/100
- State rank
- #700
- US rank
- #13044
Category grades
Schools grade is shown separately in the Schools card above.
Census & demographics
- Census place
- Snook, TX
- Population (ZIP)
- 706
Population outlook (Burleson County) Hauer SSP2
- Today (2025)
- 18,066 people
- By 2030
- 18,174 · +0.6%
- By 2040
- 18,198 · +0.7%
- By 2050
- 18,110 · +0.2%
- By 2075
- 18,166 · +0.6%
- By 2100
- 16,949 · -6.2%
Race, ethnicity, and origin ACS 2023
- Neighborhood character
- Majority White (50%)
- Race & ethnicity
- White 50% Hispanic / Latino 46% Two or more races 24% Native American 4% Black 3%
- Hispanic origin (detail)
- Mexican 46%
- Common ancestry
- Lithuanian 3%
- Foreign-born
- 14% · Canada
- Languages at home
- 68% English-only · Spanish 32%
Political lean MEDSL · Burleson
- 2024 margin
- Solid R (+62.8) · D 18.2% · R 81.0%
- 2008→2024 swing
- -25.4pp toward R · 2008: -37.4pp · 2024: -62.8pp
- All cycles
- 2024: R+62.8 2020: R+57.6 2016: R+55.1 2012: R+46.0 2008: R+37.4
Not yet ingested
- Civics
- —
Market trends
- HPI YoY
- ▲ 0.46%
- Current HPI
- 89.5004
- Rent YoY
- —
- Metro
- —
- State GDP YoY
- ▲ 3.95%
- F500 in state
- 110
Industry mix (Fortune 500 HQ in TX)
| Industry | F500 HQs | Revenue |
|---|---|---|
| Energy | 16 | $1,198B |
|
||
| Technology | 5 | $198B |
|
||
| Engineering / Construction | 4 | $72B |
|
||
| Energy Services | 3 | $60B |
|
||
| Utilities | 3 | $41B |
|
||
| Healthcare | 2 | $330B |
|
||
Price history
1 event — show timeline
- 2026-02-07 Listed $270,900 Zillow
Cash-flow waterfall
monthlySold comps — $/sqft
last 12 mo · ≤1 miLoading sold comps…