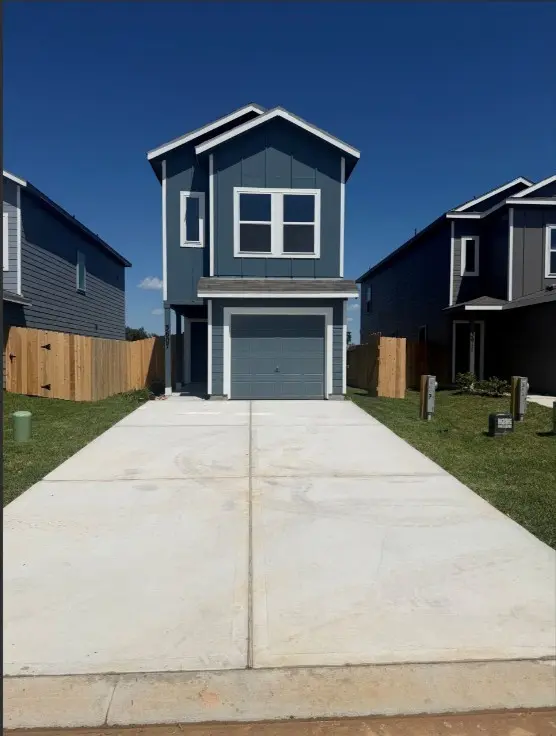
 🏗️ New Construction
3607 Duplet Ave · Deerwood, TX
Flood risk 6/10 · Moderate
- FEMA flood zone
- X (unshaded)
- Chance of flooding over 30 yrs
- 0.69%
- Est. flood insurance / yr
- $507 – $1,088
Fire risk 3/10 · Minor
- Est. fire insurance / yr
- $1,222 – $2,270
Heat risk 8/10 · Major
- Hot days now (above 111°F)
- 7 days/yr
- Hot days in 30 yrs
- 23 days/yr
Wind risk 8/10 · Major
- Chance of severe wind over 30 yrs
- 99.0%
Air-quality risk 2/10 · Minimal
- Unhealthy air days now
- 2 days/yr
- Unhealthy air days in 30 yrs
- 2 days/yr
Risk factors via First Street. Map © Google.
Why this score? — see what drove the D grade
The composite is a weighted blend of 9 inputs, each scored 0–100. Each bar is that input's sub-score; the figure is the points it added to the 100-point composite (weight × sub-score).
- Cash flow +12.5/30.0
- ARV discount +7.5/15.0
- Schools +5.1/10.0
- 1% rule +4.0/10.0
- Condition / age +4.0/5.0
- DSCR +3.7/10.0
- Rent growth +2.5/5.0
- Livability +2.5/5.0
- Appreciation +0.0/10.0
$183,990
🖨 Deal sheet 📄 Offer letter ✓ Due diligence
Listing remarks
NEW! Lennar Wellton Collection "Baja" Plan with Elevation "C" in the Villages of Greystone! This two-story home features a classic layout ideal for young families and working professionals. The living area is located on the primary floor and consists of a family room and fully-equipped kitchen. There are three bedrooms on the second level, including the spacious owner’s suite, which is situated at the back of the home for optimal privacy and comfort.
Key facts
- 2 garage spots
- Built 2026
- Listed 10 days
Property features AI
Finance
- HOA & community: Belongs to Villages at Greystone HOA; Annual association fee of $749
Exterior
- Parking: Attached 2-car garage
- Utilities: Has heating and cooling
- Home design: Residential property; Under construction (new construction); Slab foundation; Built in 2026
- Construction: Brick and cement siding construction; New construction
- Exterior features: Subdivision lot setting; Composition roof
Interior
- Kitchen: Kitchen on the first floor (approx. 11x10)
- Bedrooms: Primary bedroom on the second floor (approx. 14x11); Second-floor bedroom (approx. 10x9); Second-floor bedroom (approx. 10x9)
- Bathrooms: 2 full bathrooms; 1 half bathroom
- Heating & cooling: Central heating (gas); Central electric air conditioning
- Interior features: 5 total rooms
Neighborhood map
What this means for you Summary
Snapshot
- This is a 3-bed/2.5-bath single-family listed at $184k. Condition is rated good.
Deal economics
- At list price, monthly cash flow is $-28 ($-331/yr) — negative.
- To cash-flow at today's rent, offer at most $178k (3.3% below list).
- To meet the 1% rule (rent ≥ 1% of price), the offer needs to be $164k (11.1% below list).
- Recommended offer: $164k (11.1% below list) — sets the bar for 1% rule.
Location & tenants
- Location reads: area grade D — affects rentability + tenant quality, not the cash-flow math above.
- Conroe ISD (other): math 57% / reading 57% proficiency, ranked #69 of 826 in TX (top 8%) — acceptable for families but not a draw, mixed tenant base, ~2y average lease.
- Zoned schools: Creighton El (math 31% / reading 27%, grade F, #2,668 of 4,322 statewide, top 63%, 940 students, 92% FRL); Caney Creek H S (math 33% / reading 42%, grade F, #888 of 1,632 statewide, top 55%, 2,504 students, 79% FRL) — zoned schools average 86% FRL vs 34% district-wide (51 pts higher); higher-poverty schools than district average — tighter screening recommended.
- Zoned-school proficiency averages 33% at this address vs 57% district-wide (-24 pts) — the specific schools serving this property underperform the Conroe ISD average; the district grade overstates school quality for this exact location.
- Market conditions: 414 active listings in the ZIP; 1 comparable units currently listed for rent nearby; solid renter incomes; 13,259 units permitted in Montgomery County in 2024 (1,402 in 5+ unit buildings).
Forward outlook
- Local home prices are declining (-3.0%/yr); year-one equity from $1k of loan paydown is wiped out by about $5k of value loss. Plan a longer hold.
- Montgomery County population projected at +65% by 2050 — long-run rental-demand tailwind backs the buy-and-hold thesis.
Negotiation context
- Only 10 days on market — expect competitive offers; lowballing is unlikely to land.
Risks & watch-outs
- Climate carrying-cost: major flood risk; severe wind risk, 99% chance of damaging wind over 30y; extreme-heat days projected 7→23/yr by 2055 (HVAC capex compounding) — expect insurance premiums to compound above CPI over the hold.
Questions for the listing agent
- What do current leases actually rent for vs. the listed asking? Can we see a recent rent roll and the last 12 months of T-12 income?
- What does the HOA fee cover, when was the last increase, and are there any pending special assessments or reserve-fund shortfalls?
- Is there a deadline driving the sale (1031 exchange, divorce, estate, relocation)? That informs how much negotiation room exists.
- The area grade is low — what's the realistic commute time and amenity access for the typical tenant pool here? Any planned neighborhood developments (good or bad) we should know about?
- What's the average days-on-market for RENTAL listings here right now (not sales)? A rising rental-DOM trend means longer vacancies and softer asking-rent achievability than the comps imply.
- What's the recent tenant-quality profile in this submarket — average credit score on applications, eviction rate, late-payment / NSF rate, and stable-employment percentage? A property-management company in the area should have these aggregated.
- How much new for-sale + rental construction is in the pipeline within 1–3 miles? Heavy new supply typically softens prices + rents 12–24 months out; constrained supply supports both.
Investment metrics
- 1% rule
- 0.90% ✗
- Cap rate
- 6.11%
- Cash-on-cash
- -0.65%
- DSCR
- 0.97
- GRM
- 9.3
CMA / ARV
- ARV (median comp)
- $181,990
- List price
- $183,990
- Delta
- 1.10%
- Verdict
- FAIR
- Comps
- 20 within 1.0 mi
Show comp detail 12 sales within ~0.75 mi
| Address | Dist | Beds/Ba | Sqft | Sold | Price | $/sf | Match |
|---|---|---|---|---|---|---|---|
| 17107 Saxophone Ln | 0.19mi | 3/2.5 | 1,189 (0%) | 1mo | $184,990 | $156 | 90 |
| 17131 Saxophone Ln | 0.19mi | 3/2.5 | 1,189 (0%) | 2mo | $183,990 | $155 | 90 |
| 17115 Saxophone Ln | 0.19mi | 3/2.5 | 1,189 (0%) | 2mo | $183,990 | $155 | 90 |
| 17135 Saxophone Ln | 0.16mi | 3/2.0 | 1,360 (+14%) | 1mo | $188,990 | $139 | 66 |
| 3602 Duplet Ave | 0.19mi | 3/2.0 | 1,360 (+14%) | 1mo | $188,990 | $139 | 64 |
| 17143 Saxophone Ln | 0.19mi | 3/2.0 | 1,360 (+14%) | 2mo | $189,990 | $140 | 64 |
| 139 Pegasus Ct | 0.38mi | 3/2.0 | 1,120 (-6%) | 10mo | $129,000 | $115 | 62 |
| 3603 Duplet Ave | 0.19mi | 2/2.5 (-1) | 1,013 (-15%) | 1mo | $179,991 | $178 | 61 |
| 17103 Saxophone Ln | 0.20mi | 2/2.5 (-1) | 1,013 (-15%) | 2mo | $178,990 | $177 | 60 |
| 16431 Trenda Ct | 0.49mi | 3/2.0 | 1,120 (-6%) | 14mo | $55,000 | $49 | 54 |
| 16406 Trenda Ct | 0.54mi | 3/2.0 | 1,344 (+13%) | 14mo | $135,000 | $100 | 39 |
| 16479 Taurus Ct | 0.57mi | 3/2.0 | 1,344 (+13%) | 15mo | $159,900 | $119 | 38 |
Match score weights: distance 35% · size 25% · config 20% · recency 20%. Top-matched comps best support the ARV.
Projected returns pro-forma
-3.0% appreciation · 3.0% rent growth · sell at horizon
- IRR
- -17.3%
- Equity multiple
- 0.39×
- Total profit
- $-31,184
- Equity at exit
- $27,135
- IRR
- -9.2%
- Equity multiple
- 0.43×
- Total profit
- $-29,161
- Equity at exit
- $15,735
Cash invested: $50,957 (down + closing). Projections, not guarantees.
Landlord ↔ Tenant lean methodology
- Overall (STATE)
- 87 Strongly Landlord-Friendly
- State Texas
- 87 Strongly Landlord-Friendly · R+5
- County
- — inherits STATE
- City
- — inherits STATE
ZIP-level market 77306
- Home prices YoY
- -4.1%
- Active inventory
- 414
- Price-to-rent
- 9.4×
Monthly cashflow live
- Estimated rent
- $1,636 medium interval (Pro) →
- Mortgage (P&I)
- −$954
- Tax est. 1.5%
- −$227 /mo · $2,730/yr
- Insurance
- −$76
- HOA
- −$62
- Vacancy / Maint / Mgmt
- −$343
- Net cashflow
- $-28
Break-even live
UW: 25.0% down · 7.5% · 30yr · 1.5% tax · 5.0% vac · 8.0% maint · 8.0% mgmt
Financing live
Cash to close
- Down payment
- $45,498
- Closing costs
- $5,460
- Reserves months
- —
- Total cash needed
- —
Loan-product check · same deal, 3 products live
Conventional
25% down · 7.5% · 30yr
- Down + closing
- —
- Monthly P&I
- —
- Monthly cashflow
- —
- DSCR
- —
- Eligible?
- —
Personal DTI + credit; lowest rate.
DSCR
20% down · 8.5% · 30yr
- Down + closing
- —
- Monthly P&I
- —
- Monthly cashflow
- —
- DSCR
- —
- Eligible?
- —
No personal income docs; deal must DSCR.
Hard money
10% down · 12.0% · 12mo
- Down + closing
- —
- Monthly P&I
- —
- Monthly cashflow
- —
- DSCR
- —
- Eligible?
- —
Short-term bridge; refi at stabilization.
Rent comps 1 comps
| Address | Beds | Baths | Sqft | Rent | $/sqft | DOM | Units | Dist |
|---|---|---|---|---|---|---|---|---|
| 6621 W Forest Rd Conroe, TX | 3.0 | 2.0 | 952 | $1,450 | $1.52 | 43d | 1 | 0.69mi |
HOA detail
- Monthly dues
- $62 · $744/yr
Listing history 3 events
-
2026-05-09status Pending 480-char remark
-
2026-05-09price $183,990 480-char remark
-
2026-04-28$150,090 Active 480-char remark
ⓘ Source: listings_history table (triggers on properties + properties_extension) + one-shot
backfill from property_details.listing_events for pre-trigger history.
Climate risk First Street
- Flood 6/10 Major FEMA zone X (unshaded) · 69% chance over 30 yrs
- Wildfire 3/10 Moderate
- Heat 8/10 Severe 7 d/yr ≥111°F today · 23 d/yr by 30 yrs out
- Wind 8/10 Severe 99% chance of damaging wind over 30 yrs
- Air quality 2/10 Low 2 unhealthy d/yr today · 2 by 30 yrs out
Nearby sold comps map
Loading sold comps map…
Walkable amenities ~0.75 mi
Loading nearby amenities…
Taxation est. · year 1
- Rental income
- $19,627
- − Mortgage interest
- −$10,194
- − Property taxes
- −$2,730
- − Insurance
- −$910
- − Repairs & maintenance
- −$1,570
- − Management
- −$1,570
- − HOA
- −$744
- − Depreciation
- −$5,294
- Taxable loss
- −$3,386
- Est. tax savings @ 24.0%
- +$813
- After-tax cash flow
- $482/yr
For passive investors: Depreciation is non-cash, so a rental often shows a tax loss while cash-flowing — sheltering income. Rental losses are passive: they offset passive income freely, and up to $25,000/yr can offset ordinary (W-2) income if you actively participate and your MAGI is under $100k (phasing out to $0 by $150k); unused losses carry forward. On sale, claimed depreciation is recaptured at up to 25%, and gains may owe capital-gains tax (a 1031 exchange can defer both). Figures are a year-1 estimate at your 24.0% rate — not tax advice; consult a CPA.
Condition & rehab AI · 3 photos
This well-maintained single-family home in Deerwood, TX, is ready for immediate occupancy and offers a good return on investment with minor updates for increased value.
Value-add opportunities
- Both Painting the exterior and interior walls — Fresh paint enhances curb appeal and interior aesthetics.
- Both Landscaping improvements — Enhanced landscaping can increase both resale and rental value.
- Resale Kitchen appliances — Upgrading appliances can attract more buyers.
- Resale Bathroom fixtures — Modern fixtures can improve the home's appeal to potential buyers.
- Rental HVAC system maintenance — A well-maintained HVAC system ensures comfort and reduces energy costs for tenants.
Renovation cost estimate screening
Value-add ROI direction
- Both Painting the exterior and interior walls — Fresh paint enhances curb appeal and interior aesthetics. ↑
- Both Landscaping improvements — Enhanced landscaping can increase both resale and rental value. ↑
- Resale Kitchen appliances — Upgrading appliances can attract more buyers. ↑
- Resale Bathroom fixtures — Modern fixtures can improve the home's appeal to potential buyers. ↑
- Rental HVAC system maintenance — A well-maintained HVAC system ensures comfort and reduces energy costs for tenants. ↑
ⓘ Cost ranges are severity-bucket heuristics (US national rule-of-thumb). Get contractor quotes + a written scope before underwriting a rehab budget.
Schools (NCES district)
- District
- Conroe ISD
- NCES district ID
- 4815000
- Math proficiency
- 57% ▼ -6.00%
- Reading proficiency
- 57% ▼ -1.00%
- Median HH income
- $71,541
- Composite
- 50.65/100
- National rank
- #1833
- State rank
- #69 of 826 in TX
Livability — Deerwood
No livability data for this city. (Only ~50 U.S. cities are tracked.)
Census & demographics
- County
- Montgomery County · 663,713 people
- Metro
- Houston-The Woodlands-Sugar Land, TX
- Population (ZIP)
- 18,086
- Household income
- $76,257
- Rent vs Own
- Severe rent burden
- 231.0
Population outlook (Montgomery County) Hauer SSP2
- Today (2025)
- 713,896 people
- By 2030
- 805,263 · +12.8%
- By 2040
- 992,708 · +39.1%
- By 2050
- 1,179,590 · +65.2%
- By 2075
- 1,628,084 · +128.1%
- By 2100
- 1,937,880 · +171.5%
Race, ethnicity, and origin ACS 2023
- Neighborhood character
- Majority Hispanic (55%)
- Race & ethnicity
- Hispanic / Latino 55% White 41% Two or more races 11% Black 2%
- Hispanic origin (detail)
- Mexican 51%
- Common ancestry
- Iranian 1% Slovak 1% Lithuanian 1%
- Foreign-born
- 21% · Canada
- Languages at home
- 53% English-only · Spanish 45% German/W. Germanic 1%
Political lean MEDSL · Montgomery
- 2024 margin
- Solid R (+45.5) · D 26.8% · R 72.3%
- 2008→2024 swing
- +7.2pp toward D · 2008: -52.7pp · 2024: -45.5pp
- All cycles
- 2024: R+45.5 2020: R+43.8 2016: R+51.4 2012: R+60.7 2008: R+52.7
Not yet ingested
- Civics
- —
Market trends
- HPI YoY
- ▼ -13.02%
- Current HPI
- 306.3801
- Rent YoY
- —
- Metro
- Houston-The Woodlands-Sugar Land, TX
- State GDP YoY
- ▲ 3.95%
- F500 in state
- 110
Industry mix (Fortune 500 HQ in TX)
| Industry | F500 HQs | Revenue |
|---|---|---|
| Energy | 16 | $1,198B |
|
||
| Technology | 5 | $198B |
|
||
| Engineering / Construction | 4 | $72B |
|
||
| Energy Services | 3 | $60B |
|
||
| Utilities | 3 | $41B |
|
||
| Healthcare | 2 | $330B |
|
||
Price history
+22.6% since first listed3 events — show timeline
- 2026-05-09 Pending — HARMLS
- 2026-05-09 Price Changed $183,990 HARMLS
- 2026-04-28 Listed $150,090 HARMLS
Cash-flow waterfall
monthlySold comps — $/sqft
last 12 mo · ≤1 miLoading sold comps…