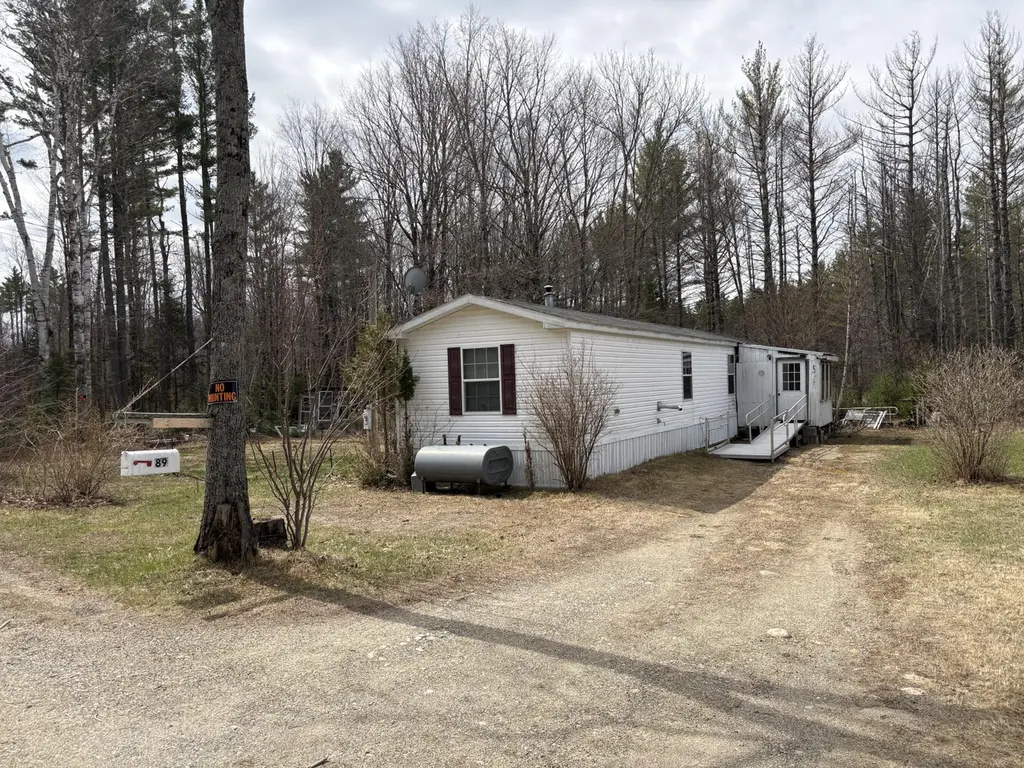
89 Littlehale Rd · Andover, ME
Flood risk No data
- FEMA flood zone
- —
- Chance of flooding over 30 yrs
- —
- Est. flood insurance / yr
- —
Fire risk No data
- Est. fire insurance / yr
- —
Heat risk No data
- Hot days now (above threshold)
- —
- Hot days in 30 yrs
- —
Wind risk No data
- Chance of severe wind over 30 yrs
- —
Air-quality risk No data
- Unhealthy air days now
- —
- Unhealthy air days in 30 yrs
- —
Risk factors via First Street. Map © Google.
Why this score? — see what drove the F grade
The composite is a weighted blend of 9 inputs, each scored 0–100. Each bar is that input's sub-score; the figure is the points it added to the 100-point composite (weight × sub-score).
- ARV discount +7.5/15.0
- Cash flow +7.4/30.0
- Appreciation +5.0/10.0
- Schools +4.0/10.0
- Rent growth +2.5/5.0
- Livability +2.5/5.0
- Condition / age +2.5/5.0
- 1% rule +2.1/10.0
- DSCR +1.5/10.0
$146,000
🖨 Deal sheet (PDF) 📄 Offer letter ✓ Due diligence
Key facts
- 1 acre lot
- Parking
- Built 2009
Property features AI
Exterior
- Parking: 1–4 parking spaces on gravel
- Utilities: Well (private) water source; Septic tank (private sewer)
- Home design: Mobile home property type; Single-story (first level primary living); Built in 2009
- Construction: Vinyl siding mobile home; Shingle roof; Slab foundation
- Exterior features: Level, rural lot; Waterfront on Barrett Brook (brook)
Interior
- Kitchen: First-level kitchen
- Bedrooms: Two bedrooms on the first level
- Flooring: Vinyl flooring; Carpet flooring
- Bathrooms: One full bathroom
- Heating & cooling: Pellet stove; Forced air; Direct vent furnace; Circuit breaker electrical system; Electric water heater
- Interior features: 4 total rooms; Level of finish includes vinyl and carpet flooring
Neighborhood map
What this means for you Summary
Snapshot
- This is a 2-bed/1.0-bath single-family listed at $146k.
Deal economics
- At list price, monthly cash flow is $-191 ($-2k/yr) — negative.
- To cash-flow at today's rent, offer at most $118k (18.9% below list).
- To meet the 1% rule (rent ≥ 1% of price), the offer needs to be $104k (29.1% below list).
- Recommended offer: $104k (29.1% below list) — sets the bar for 1% rule.
Location & tenants
- Location reads: area grade F — affects rentability + tenant quality, not the cash-flow math above.
- Andover Public Schools (rural): math 30% / reading 60% proficiency, ranked #82 of 185 in ME (top 44%) — families likely to look elsewhere, expect single-tenant / working-renter base with shorter leases.
- Zoned schools: Andover Elementary School (math 75% / reading 75%, grade A, #224 of 294 statewide, top 77%, 30 students, 30% FRL) — zoned schools average 30% FRL vs 53% district-wide (23 pts lower); this property's tenant base skews higher-income than the district average.
- Zoned-school proficiency averages 75% at this address vs 45% district-wide (+30 pts) — the actual schools serving this property are materially stronger than the Andover Public Schools average implies; a family-tenant draw the district grade alone would hide.
- Market conditions: 12 active listings in the ZIP; 329 units permitted in Oxford County in 2024 (0 in 5+ unit buildings).
Forward outlook
- In year one you build about $5k of equity ($1k loan paydown + $4k appreciation (3.0% local appreciation)).
- Oxford County population projected at -21% by 2050 — secular population decline; favor cash flow + early exit over multi-decade hold.
- By year 7, paydown + projected appreciation supports a ~$34k cash-out refi (75% LTV) — recoverable capital for the next deal without selling this one.
Negotiation context
- It's been on market 60 days — a 3% lower offer ($142k) is reasonable based on typical stale-listing flexibility.
- 2 sale attempts since 25y ago with the ask held roughly flat each time — persistent listings suggest the price (not the market) is what's stuck; bring a comps-based counter.
Questions for the listing agent
- What do current leases actually rent for vs. the listed asking? Can we see a recent rent roll and the last 12 months of T-12 income?
- It's been on market 60 days. Have you received any prior offers? Is the seller open to a 29% concession, seller financing, or rate buy-down credit?
- Is there a deadline driving the sale (1031 exchange, divorce, estate, relocation)? That informs how much negotiation room exists.
- The area grade is low — what's the realistic commute time and amenity access for the typical tenant pool here? Any planned neighborhood developments (good or bad) we should know about?
- What's the average days-on-market for RENTAL listings here right now (not sales)? A rising rental-DOM trend means longer vacancies and softer asking-rent achievability than the comps imply.
- What's the recent tenant-quality profile in this submarket — average credit score on applications, eviction rate, late-payment / NSF rate, and stable-employment percentage? A property-management company in the area should have these aggregated.
- How much new for-sale + rental construction is in the pipeline within 1–3 miles? Heavy new supply typically softens prices + rents 12–24 months out; constrained supply supports both.
Investment metrics
- 1% rule
- 0.71% ✗
- Cap rate
- 4.72%
- Cash-on-cash
- -5.61%
- DSCR
- 0.75
- GRM
- 11.8
CMA / ARV
No comps found within radius.
Projected returns pro-forma
3.0% appreciation · 3.0% rent growth · sell at horizon
- IRR
- 2.3%
- Equity multiple
- 1.13×
- Total profit
- $5,437
- Equity at exit
- $65,648
- IRR
- 5.8%
- Equity multiple
- 1.89×
- Total profit
- $36,449
- Equity at exit
- $101,171
Cash invested: $40,880 (down + closing). Projections, not guarantees.
Landlord ↔ Tenant lean methodology
- Overall (STATE)
- 41 Moderately Tenant-Leaning
- State Maine
- 41 Moderately Tenant-Leaning · D+2
- County
- — inherits STATE
- City
- — inherits STATE
ZIP-level market 04216
- Active inventory
- 12
- Price-to-rent
- 11.8×
Monthly cashflow live
- Estimated rent
- $1,035 medium interval (Pro) →
- Mortgage (P&I)
- −$766
- Tax est. 1.5%
- −$182 /mo · $2,190/yr
- Insurance
- −$61
- HOA
- −$0
- Vacancy / Maint / Mgmt
- −$217
- Net cashflow
- $-191
Break-even live
Sensitivity live
| Price | -10% $-90 | -5% $-141 | +0% $-191 | +5% $-241 | +10% $-292 |
|---|---|---|---|---|---|
| Rent | -10% $-273 | -5% $-232 | +0% $-191 | +5% $-150 | +10% $-109 |
| Rate | -1.0pp $-118 | -0.5pp $-154 | base $-191 | +0.5pp $-229 | +1.0pp $-267 |
UW: 25.0% down · 7.5% · 30yr · 1.5% tax · 5.0% vac · 8.0% maint · 8.0% mgmt
Financing live
Cash to close
- Down payment
- $36,500
- Closing costs
- $4,380
- Reserves months
- —
- Total cash needed
- —
Loan-product check · same deal, 3 products live
Conventional
25% down · 7.5% · 30yr
- Down + closing
- —
- Monthly P&I
- —
- Monthly cashflow
- —
- DSCR
- —
- Eligible?
- —
Personal DTI + credit; lowest rate.
DSCR
20% down · 8.5% · 30yr
- Down + closing
- —
- Monthly P&I
- —
- Monthly cashflow
- —
- DSCR
- —
- Eligible?
- —
No personal income docs; deal must DSCR.
Hard money
10% down · 12.0% · 12mo
- Down + closing
- —
- Monthly P&I
- —
- Monthly cashflow
- —
- DSCR
- —
- Eligible?
- —
Short-term bridge; refi at stabilization.
Listing history 18 events
-
2026-06-21days on market $146,000 Active 60 DOM
-
2026-06-21days on market $146,000 Active 59 DOM
-
2026-06-18days on market $146,000 Active 57 DOM
-
2026-06-17days on market $146,000 Active 56 DOM
-
2026-06-16days on market $146,000 Active 55 DOM
-
2026-06-15days on market $146,000 Active 54 DOM
-
2026-06-13days on market $146,000 Active 52 DOM
-
2026-06-12days on market $146,000 Active 51 DOM
-
2026-06-09days on market $146,000 Active 48 DOM
-
2026-06-08days on market $146,000 Active 47 DOM
-
2026-06-07days on market $146,000 Active 46 DOM
-
2026-06-07days on market $146,000 Active 45 DOM
-
2026-06-04days on market $146,000 Active 42 DOM
-
2026-06-02days on market $146,000 Active 41 DOM
-
2026-06-01days on market $146,000 Active 40 DOM
-
2026-05-31days on market $146,000 Active 39 DOM
-
2026-05-31days on market $146,000 Active 38 DOM
-
2026-04-22$146,000 Active 297-char remark
ⓘ Source: listings_history table (triggers on properties + properties_extension) + one-shot
backfill from property_details.listing_events for pre-trigger history.
Nearby sold comps map
Loading sold comps map…
Walkable amenities ~0.75 mi
Loading nearby amenities…
Taxation est. · year 1
- Rental income
- $12,424
- − Mortgage interest
- −$8,178
- − Property taxes
- −$2,190
- − Insurance
- −$730
- − Repairs & maintenance
- −$994
- − Management
- −$994
- − Depreciation
- −$4,247
- Taxable loss
- −$4,909
- Est. tax savings @ 24.0%
- +$1,178
- After-tax cash flow
- $-1,114/yr
For passive investors: Depreciation is non-cash, so a rental often shows a tax loss while cash-flowing — sheltering income. Rental losses are passive: they offset passive income freely, and up to $25,000/yr can offset ordinary (W-2) income if you actively participate and your MAGI is under $100k (phasing out to $0 by $150k); unused losses carry forward. On sale, claimed depreciation is recaptured at up to 25%, and gains may owe capital-gains tax (a 1031 exchange can defer both). Figures are a year-1 estimate at your 24.0% rate — not tax advice; consult a CPA.
Schools (NCES district)
- District
- Andover Public Schools
- NCES district ID
- 2314823
- Math proficiency
- 30% ▼ -10.00%
- Reading proficiency
- 60% ▲ 10.00%
- Median HH income
- $44,234
- Composite
- 40.25/100
- National rank
- #7803
- State rank
- #82 of 185 in ME
Livability — Andover
No livability data for this city. (Only ~50 U.S. cities are tracked.)
Census & demographics
- Population (ZIP)
- 602
Population outlook (Oxford County) Hauer SSP2
- Today (2025)
- 55,853 people
- By 2030
- 54,190 · -3.0%
- By 2040
- 49,484 · -11.4%
- By 2050
- 43,958 · -21.3%
- By 2075
- 32,308 · -42.2%
- By 2100
- 21,858 · -60.9%
Race, ethnicity, and origin ACS 2023
- Neighborhood character
- Predominantly White (96%)
- Race & ethnicity
- White 96% Asian 3%
- Common ancestry
- Lithuanian 13% Slovak 5% Scotch-Irish 2%
- Foreign-born
- 3% · China, Canada
- Languages at home
- 98% English-only · Chinese 2% Other Indo-European 1%
Political lean MEDSL · Oxford
- 2024 margin
- R (+12.9) · D 42.7% · R 55.6% · Other 1.7%
- 2008→2024 swing
- -28.9pp toward R · 2008: 16.0pp · 2024: -12.9pp
- All cycles
- 2024: R+12.9 2020: R+8.8 2016: R+13.0 2012: D+14.9 2008: D+16.0
Not yet ingested
- Civics
- —
Market trends
- HPI YoY
- —
- Current HPI
- —
- Rent YoY
- —
- Metro
- —
- State GDP YoY
- —
- F500 in state
- 0
Price history
+495.9% since first listed2 events — show timeline
- 2026-04-22 Listed $146,000 MREIS
- 2001-08-24 Listed $24,500 MREIS
Cash-flow waterfall
monthlySold comps — $/sqft
last 12 mo · ≤1 miLoading sold comps…