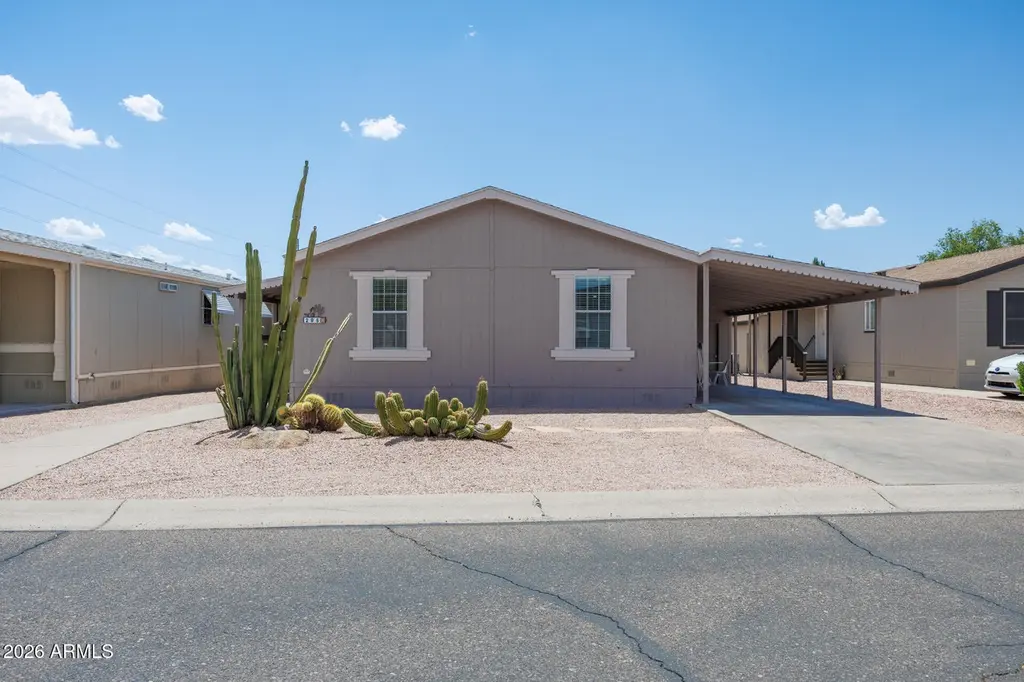
3901 E Pinnacle Peak Rd #295 · Phoenix, AZ
Flood risk 1/10 · Minimal
- FEMA flood zone
- X (shaded)
- Chance of flooding over 30 yrs
- 0.0%
- Est. flood insurance / yr
- $507 – $1,088
Fire risk 5/10 · Moderate
- Est. fire insurance / yr
- $610 – $1,132
Heat risk 8/10 · Major
- Hot days now (above 110°F)
- 7 days/yr
- Hot days in 30 yrs
- 17 days/yr
Wind risk 1/10 · Minimal
- Chance of severe wind over 30 yrs
- —
Air-quality risk 3/10 · Minor
- Unhealthy air days now
- 3 days/yr
- Unhealthy air days in 30 yrs
- 5 days/yr
Risk factors via First Street. Map © Google.
Why this score? — see what drove the B+ grade
The composite is a weighted blend of 9 inputs, each scored 0–100. Each bar is that input's sub-score; the figure is the points it added to the 100-point composite (weight × sub-score).
- Cash flow +30.0/30.0
- ARV discount +14.4/15.0
- 1% rule +10.0/10.0
- DSCR +10.0/10.0
- Condition / age +4.0/5.0
- Schools +3.8/10.0
- Livability +3.8/5.0
- Rent growth +3.0/5.0
- Appreciation +0.0/10.0
$128,800
🖨 Deal sheet (PDF) 📄 Offer letter ✓ Due diligence
Listing remarks
Hidden gem in the desert! This gated 55+ community features an executive 9 hole GOLF COURSE, Frank Llyod Wright designed community, hasHEATED swimming POOL, hot tub, four PICKLEBALL courts, & so much more. Visit the community website for a full list of activities. Thiscomfortable 3 BDRM, 2 bath has a fresh coat of paint, updated flooring, all appliances are included. TWO CAR tandem carport plus AIRCONDITIONED WORKSHOP! You can't beat this price for a 3 bdrm! Listing agent is related to the seller.
Key facts
- Gated community
- 9 hole golf course
- Hot tub
Tags
Property features AI
Finance
- Other: Lot size source: Assessor; Building area source: Builder; Directions provided to unit 295
- HOA & community: Land lease: $930 monthly; Association fee includes: other (see remarks); Community pool; Community spa (heated); Golf; Pickleball courts
Exterior
- Parking: 2 covered parking spaces; 2 carport spaces
- Security: Gated community; Guarded entry
- Utilities: City water; Sewer connected; 220V in kitchen / electric
- Home design: Manufactured/mobile home; Leasehold ownership
- Construction: Wood siding and wood frame construction; Painted exterior; Composition roof
- Exterior features: Private street(s); Desert front and back
Interior
- Kitchen: 220V outlet in kitchen; Laminate countertops; Refrigerator; Dishwasher; Disposal
- Bedrooms: 3 possible bedrooms
- Flooring: Carpet; Laminate
- Bathrooms: 2 full bathrooms
- Heating & cooling: Has heating; Central air conditioning
- Interior features: Double vanity; Vaulted ceilings; 3/4 bath in master bedroom; Skylight(s)
- Laundry & utility: Inside laundry
Neighborhood map
What this means for you Summary
Snapshot
- This is a 3-bed/2.0-bath manufactured listed at $129k. Condition is rated good.
Deal economics
- At list price, monthly cash flow is $2k ($28k/yr) — positive.
- The deal already cash-flows at list — no discount required.
- Meets the 1% rule at list price ($4k rent vs $129k).
- Recommended offer: $125k (3.0% below list) — sets the bar for market timing.
- Cap rate 28.4% vs local median 3.3% in Phoenix — top-decile yield for the area; either an underpriced asset or a hidden risk that comps aren't pricing in. Stress-test before assuming the spread holds.
Location & tenants
- Location reads 75/100 on livability (#16 in AZ, #3,924 nationally) — a middle-class / working-renter tenant base. Strengths: amenities A+, commute A+, housing A+; Watch: health & safety C-, crime F.
- Paradise Valley Unified District (4241) (urban): math 39% / reading 46% proficiency, ranked #56 of 249 in AZ (top 22%) — families likely to look elsewhere, expect single-tenant / working-renter base with shorter leases.
- Market conditions: Rents rising (+2.0%/yr); 218 active listings in the ZIP; 5 comparable units currently listed for rent nearby; rentals at typical pace (median 19d on market — plan ~3-4 weeks tenant-placement turnaround); 40% of comp listings sitting > 30 days — soft ceiling on asking rent; high-income renter base; 36,011 units permitted in Maricopa County in 2024 (12,801 in 5+ unit buildings).
- This rent runs 35% of the median local income ($140k/yr) — at the standard rent-burdened threshold; future hikes will face affordability resistance.
Forward outlook
- Local home prices are declining (-3.0%/yr); year-one equity from $890 of loan paydown is wiped out by about $4k of value loss. Plan a longer hold.
- Maricopa County population projected at +38% by 2050 — long-run rental-demand tailwind backs the buy-and-hold thesis.
- At projected returns (-3.0% appreciation + 2.0% rent growth), your $36k cash investment doubles in ~2 years — after that, you're playing with house money.
Negotiation context
- It's been on market 43 days — a 3% lower offer ($125k) is reasonable based on typical stale-listing flexibility.
Risks & watch-outs
- Climate carrying-cost: moderate wildfire risk; extreme-heat days projected 7→17/yr by 2055 (HVAC capex compounding) — expect insurance premiums to compound above CPI over the hold.
Questions for the listing agent
- It's been on market 43 days. Have you received any prior offers? Is the seller open to a 3% concession, seller financing, or rate buy-down credit?
- Is there a deadline driving the sale (1031 exchange, divorce, estate, relocation)? That informs how much negotiation room exists.
- Crime grade is F in this area — have there been break-ins, vandalism, or insurance claims at this property in the last 3 years? What carrier currently insures it and at what premium?
- What's the average days-on-market for RENTAL listings here right now (not sales)? A rising rental-DOM trend means longer vacancies and softer asking-rent achievability than the comps imply.
- What's the recent tenant-quality profile in this submarket — average credit score on applications, eviction rate, late-payment / NSF rate, and stable-employment percentage? A property-management company in the area should have these aggregated.
- How much new for-sale + rental construction is in the pipeline within 1–3 miles? Heavy new supply typically softens prices + rents 12–24 months out; constrained supply supports both.
Investment metrics
- 1% rule
- 3.21% ✓
- Cap rate
- 28.42%
- Cash-on-cash
- 79.02%
- DSCR
- 4.52
- GRM
- 2.6
CMA / ARV
- ARV (median comp)
- $152,120
- List price
- $128,800
- Delta
- -15.33%
- Verdict
- UNDERPRICED
- Comps
- 20 within 1.0 mi
Show comp detail 12 sales within ~0.75 mi
| Address | Dist | Beds/Ba | Sqft | Sold | Price | $/sf | Match |
|---|---|---|---|---|---|---|---|
| 3901 E Pinnacle Peak Rd #108 | 0.00mi | 3/2.0 | 1,248 (0%) | 1mo | $132,000 | $106 | 99 |
| 3901 E Pinnacle Peak Rd #250 | 0.07mi | 2/2.0 (-1) | 1,248 (0%) | 3mo | $152,000 | $122 | 90 |
| 3901 E Pinnacle Peak Rd #39 | 0.07mi | 3/2.0 | 1,250 (+0%) | 10mo | $158,000 | $126 | 88 |
| 3901 E Pinnacle Peak Rd #149 | 0.07mi | 3/2.0 | 1,248 (0%) | 14mo | $152,900 | $123 | 85 |
| 3901 E Pinnacle Peak Rd #323 | 0.07mi | 2/2.0 (-1) | 1,296 (+4%) | 4mo | $159,000 | $123 | 82 |
| 3901 E Pinnacle Peak Rd #158 | 0.07mi | 2/2.0 (-1) | 1,222 (-2%) | 12mo | $150,000 | $123 | 78 |
| 3901 E Pinnacle Peak Rd #67 | 0.07mi | 2/2.0 (-1) | 1,316 (+5%) | 8mo | $172,000 | $131 | 76 |
| 3901 E Pinnacle Peak Rd #230 | 0.07mi | 2/2.0 (-1) | 1,248 (0%) | 19mo | $167,000 | $134 | 76 |
| 3901 E Pinnacle Peak Rd #109 | 0.07mi | 2/2.0 (-1) | 1,400 (+12%) | 1mo | $130,000 | $93 | 71 |
| 3901 E Pinnacle Peak Rd #80 | 0.05mi | 2/2.0 (-1) | 1,352 (+8%) | 13mo | $228,500 | $169 | 68 |
| 3901 E Pinnacle Peak Rd #193 | 0.07mi | 2/2.0 (-1) | 1,400 (+12%) | 11mo | $175,000 | $125 | 62 |
| 3901 E Pinnacle Peak Rd #303 | 0.07mi | 3/2.0 | 1,430 (+15%) | 20mo | $181,000 | $127 | 56 |
Match score weights: distance 35% · size 25% · config 20% · recency 20%. Top-matched comps best support the ARV.
Projected returns pro-forma
-3.0% appreciation · 1.98% rent growth · sell at horizon
- IRR
- 78.0%
- Equity multiple
- 4.50×
- Total profit
- $126,251
- Equity at exit
- $19,204
- IRR
- 81.3%
- Equity multiple
- 8.99×
- Total profit
- $288,081
- Equity at exit
- $11,136
Cash invested: $36,064 (down + closing). Projections, not guarantees.
Landlord ↔ Tenant lean methodology
- Overall (STATE)
- 87 Strongly Landlord-Friendly
- State Arizona
- 87 Strongly Landlord-Friendly · R+3
- County
- — inherits STATE
- City
- — inherits STATE
ZIP-level market 85050
- Home prices YoY
- -21.9%
- Rents YoY
- 2.0%
- Active inventory
- 218
- Price-to-rent
- 2.6×
Monthly cashflow live
- Estimated rent
- $4,133 high interval (Pro) →
- Mortgage (P&I)
- −$675
- Tax est. 1.5%
- −$161 /mo · $1,932/yr
- Insurance
- −$54
- HOA
- −$0
- Vacancy / Maint / Mgmt
- −$868
- Net cashflow
- $2,375
Break-even live
Sensitivity live
| Price | -10% $2,464 | -5% $2,419 | +0% $2,375 | +5% $2,330 | +10% $2,286 |
|---|---|---|---|---|---|
| Rent | -10% $2,048 | -5% $2,212 | +0% $2,375 | +5% $2,538 | +10% $2,701 |
| Rate | -1.0pp $2,440 | -0.5pp $2,408 | base $2,375 | +0.5pp $2,342 | +1.0pp $2,308 |
UW: 25.0% down · 7.5% · 30yr · 1.5% tax · 5.0% vac · 8.0% maint · 8.0% mgmt
Financing live
Cash to close
- Down payment
- $32,200
- Closing costs
- $3,864
- Reserves months
- —
- Total cash needed
- —
Loan-product check · same deal, 3 products live
Conventional
25% down · 7.5% · 30yr
- Down + closing
- —
- Monthly P&I
- —
- Monthly cashflow
- —
- DSCR
- —
- Eligible?
- —
Personal DTI + credit; lowest rate.
DSCR
20% down · 8.5% · 30yr
- Down + closing
- —
- Monthly P&I
- —
- Monthly cashflow
- —
- DSCR
- —
- Eligible?
- —
No personal income docs; deal must DSCR.
Hard money
10% down · 12.0% · 12mo
- Down + closing
- —
- Monthly P&I
- —
- Monthly cashflow
- —
- DSCR
- —
- Eligible?
- —
Short-term bridge; refi at stabilization.
Rent comps 5 comps
| Address | Beds | Baths | Sqft | Rent | $/sqft | DOM | Units | Dist |
|---|---|---|---|---|---|---|---|---|
| 3935 E Rough Rider Rd Phoenix, AZ | 2.0 | 2.5–3.0 | 1490 | $4,750 | $3.19 | 44d | 2 | 0.70mi |
| 3935 E Rough Rider Rd Phoenix, AZ | 2.0–3.0 | 2.5 | 1405 | $6,000 | $4.27 | 18d | 3 | 0.70mi |
| 3935 E Rough Rider Rd Phoenix, AZ | 2.0 | 2.5 | 1383 | $4,350 | $3.15 | 18d | 2 | 0.70mi |
| 4066 E Melinda Ln Phoenix, AZ | 3.0 | 2.5 | 1269 | $3,500 | $2.76 | 44d | 1 | 1.02mi |
| 20660 N 40th St Phoenix, AZ | 2.0–3.0 | 2.0 | 1325 | $3,500 | $2.64 | 18d | 4 | 1.49mi |
Listing history 15 events
-
2026-06-18days on market $128,800 Active 43 DOM
-
2026-06-17days on market $128,800 Active 42 DOM
-
2026-06-16days on market $128,800 Active 41 DOM
-
2026-06-15days on market $128,800 Active 40 DOM
-
2026-06-13days on market $128,800 Active 38 DOM
-
2026-06-13days on market $128,800 Active 37 DOM
-
2026-06-09days on market $128,800 Active 34 DOM
-
2026-06-08days on market $128,800 Active 33 DOM
-
2026-06-07days on market $128,800 Active 32 DOM
-
2026-06-04days on market $128,800 Active 29 DOM
-
2026-06-03days on market $128,800 Active 28 DOM
-
2026-06-02pricedays on market $128,800 Active 27 DOM
-
2026-06-01days on market $138,800 Active 26 DOM
-
2026-05-31days on market $138,800 Active 25 DOM
-
2026-05-06$138,800 Active 504-char remark
ⓘ Source: listings_history table (triggers on properties + properties_extension) + one-shot
backfill from property_details.listing_events for pre-trigger history.
Climate risk First Street
- Flood 1/10 Low FEMA zone X (shaded) · 0% chance over 30 yrs
- Wildfire 5/10 Major
- Heat 8/10 Severe 7 d/yr ≥110°F today · 17 d/yr by 30 yrs out
- Wind 1/10 Low
- Air quality 3/10 Moderate 3 unhealthy d/yr today · 5 by 30 yrs out
Nearby sold comps map
Loading sold comps map…
Walkable amenities ~0.75 mi
Loading nearby amenities…
Taxation est. · year 1
- Rental income
- $49,595
- − Mortgage interest
- −$7,215
- − Property taxes
- −$1,932
- − Insurance
- −$644
- − Repairs & maintenance
- −$3,968
- − Management
- −$3,968
- − Depreciation
- −$3,747
- Taxable income
- $28,122
- Est. tax owed @ 24.0%
- −$6,749
- After-tax cash flow
- $21,750/yr
For passive investors: Depreciation is non-cash, so a rental often shows a tax loss while cash-flowing — sheltering income. Rental losses are passive: they offset passive income freely, and up to $25,000/yr can offset ordinary (W-2) income if you actively participate and your MAGI is under $100k (phasing out to $0 by $150k); unused losses carry forward. On sale, claimed depreciation is recaptured at up to 25%, and gains may owe capital-gains tax (a 1031 exchange can defer both). Figures are a year-1 estimate at your 24.0% rate — not tax advice; consult a CPA.
Condition & rehab AI · 30 photos
This 3-bedroom, 2-bathroom home in a gated 55+ community is in good condition with fresh paint and updated flooring. It offers a comfortable living space with a golf course and community amenities nearby.
Value-add opportunities
- Both Paint exterior — Fresh paint enhances curb appeal and value
- Both Replace carpet with hardwood — Hardwood flooring is more durable and adds value
- Both Install smart home devices — Smart home devices improve convenience and add value
Renovation cost estimate screening
Value-add ROI direction
- Both Paint exterior — Fresh paint enhances curb appeal and value ↑
- Both Replace carpet with hardwood — Hardwood flooring is more durable and adds value ↑
- Both Install smart home devices — Smart home devices improve convenience and add value ↑
ⓘ Cost ranges are severity-bucket heuristics (US national rule-of-thumb). Get contractor quotes + a written scope before underwriting a rehab budget.
Schools (NCES district)
- District
- Paradise Valley Unified District (4241)
- NCES district ID
- 0405930
- Math proficiency
- 39% ▼ -11.00%
- Reading proficiency
- 46% ▼ -7.00%
- Median HH income
- $64,106
- Composite
- 37.89/100
- National rank
- #4316
- State rank
- #56 of 249 in AZ
Livability — Phoenix
- Score
- 75/100
- State rank
- #16
- US rank
- #3924
Category grades
Schools grade is shown separately in the Schools card above.
Census & demographics
- Census place
- Phoenix, AZ
- County
- Maricopa County · 4,537,380 people
- City population
- 1,500,198
- Metro
- Phoenix-Mesa-Chandler, AZ
- Population (ZIP)
- 33,118
- Household income
- $139,836
- Rent vs Own
- Severe rent burden
- 432.0
Population outlook (Maricopa County) Hauer SSP2
- Today (2025)
- 4,979,203 people
- By 2030
- 5,378,229 · +8.0%
- By 2040
- 6,156,598 · +23.6%
- By 2050
- 6,872,376 · +38.0%
- By 2075
- 8,401,270 · +68.7%
- By 2100
- 9,247,439 · +85.7%
Race, ethnicity, and origin ACS 2023
- Neighborhood character
- Predominantly White (71%)
- Race & ethnicity
- White 71% Hispanic / Latino 11% Two or more races 11% Asian 9% Black 2%
- Hispanic origin (detail)
- Mexican 8%
- Common ancestry
- Romanian 5% Italian 4% Lithuanian 3%
- Foreign-born
- 15% · Canada, China, Vietnam
- Languages at home
- 82% English-only · Spanish 6% Other Indo-European 5% Other Asian/Pacific 2%
Political lean MEDSL · Maricopa
- 2024 margin
- Toss-up / Even · D 47.7% · R 51.2% · Other 1.1%
- 2008→2024 swing
- +7.1pp toward D · 2008: -10.6pp · 2024: -3.5pp
- All cycles
- 2024: R+3.5 2020: D+2.2 2016: R+3.5 2012: R+12.0 2008: R+10.6
Not yet ingested
- Civics
- —
Market trends
- HPI YoY
- ▼ -86.38%
- Current HPI
- 308.7483
- Rent YoY
- ▲ 1.98%
- Metro
- Phoenix-Mesa-Chandler, AZ
- State GDP YoY
- ▲ 4.54%
- F500 in state
- 20
Industry mix (Fortune 500 HQ in AZ)
| Industry | F500 HQs | Revenue |
|---|---|---|
| Technology | 2 | $13B |
|
||
| Mining / Metals | 1 | $23B |
|
||
| Environmental Services | 1 | $16B |
|
||
| Metals / Steel | 1 | $14B |
|
||
| Technology Distribution | 1 | $9B |
|
||
| Homebuilding | 1 | $8B |
|
||
Price history
-7.2% since first listed2 events — show timeline
- 2026-06-02 Price Changed $128,800 ARMLS
- 2026-05-06 Listed $138,800 ARMLS
Cash-flow waterfall
monthlySold comps — $/sqft
last 12 mo · ≤1 miLoading sold comps…