 🏷️ Likely Rental
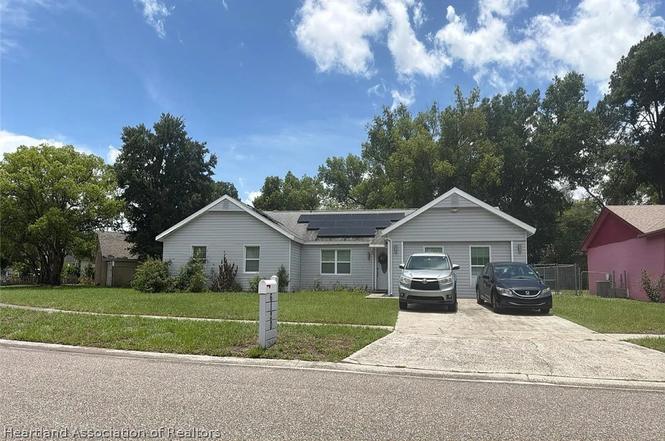
6120 Centennial Dr · Pine Hills, FL
Flood risk 1/10 · Minimal
- FEMA flood zone
- X (unshaded)
- Chance of flooding over 30 yrs
- 0.0%
- Est. flood insurance / yr
- $507 – $1,088
Fire risk 1/10 · Minimal
- Est. fire insurance / yr
- $947 – $1,759
Heat risk 9/10 · Severe
- Hot days now (above 108°F)
- 7 days/yr
- Hot days in 30 yrs
- 22 days/yr
Wind risk 9/10 · Severe
- Chance of severe wind over 30 yrs
- 99.0%
Air-quality risk 1/10 · Minimal
- Unhealthy air days now
- 0 days/yr
- Unhealthy air days in 30 yrs
- 0 days/yr
Risk factors via First Street. Map © Google.
Why this score? — see what drove the D+ grade
The composite is a weighted blend of 9 inputs, each scored 0–100. Each bar is that input's sub-score; the figure is the points it added to the 100-point composite (weight × sub-score).
- Cash flow +15.0/30.0
- ARV discount +7.5/15.0
- 1% rule +5.0/10.0
- DSCR +5.0/10.0
- Schools +4.1/10.0
- Livability +3.7/5.0
- Condition / age +2.5/5.0
- Rent growth +2.4/5.0
- Appreciation +0.0/10.0
$5,000
🖨 Deal sheet 📄 Offer letter ✓ Due diligence
Listing remarks MLS
One or more photo(s) has been virtually staged. Welcome to your dream home nestled in the heart of Orlando, Florida. This stunning modern oasis offers the perfect blend of comfort, convenience, and luxury living. This immaculately luxurious corner lot property with 2,000 square feet of living space sits on over a quarter acre with an enclosed private pool in the tranquil Lake Sparkling Heights subdivision in Orlando, FL. Walk in and experience the airyness of the vaulted ceilings and the breeze from the oversized ceiling fan. Boasting an open floor plan with continuous LVP floors that lead you through the living room to a gourmet kitchen with extensive cabinetry, recessed lighting, a solid piece quartz slab featuring an island and floating range hood, stone backsplash, and stainless steel appliances, and walk-in pantry. Throughout the home, you’ll notice the attention to detail with nickel finishes, oversized baseboards, and freshly textured and painted walls and ceilings. The home features a traditional owner’s suite with its own full restroom and natural lighting. Also, this property is equipped with an attached mother-in-law ensuite with its own full restroom, kitchenette, and for added privacy, a secondary, separate entrance. The lot is completely fenced in, and the pool enclosure re-screened and the pool and deck repainted, and the roof was recently replaced in 2022. For those outdoor enthusiasts, the home also features a large shed that can be used for storage or even as a workshop. This opportunity will not last because it combines not only a home that was redesigned to blend modern finishes and functionality, but a desirable corner lot and pool. Contact us to schedule your private showing while it's available!
Key facts
- 0.26 acre lot
- Garage
- Built 1979
Property features AI
Finance
- Other: Zoning: R-1A; Lot size approximately 0.26 acres; Directions: Continue on N Hiawassee Rd. Take N Powers Dr to Centennial Dr.
Exterior
- Parking: Garage (1 car)
- Utilities: Other water source; Other sewer
- Home design: Single family residence; One level; Residential property
- Construction: Construction materials: See remarks
- Exterior features: Front porch; Other roof
Interior
- Bedrooms: 1 total room
- Flooring: Other flooring
- Bathrooms: 2 full bathrooms
- Heating & cooling: No heating; No cooling
- Interior features: Other flooring
Neighborhood map
What this means for you Summary
Snapshot
- This is a 4-bed/2.0-bath single-family listed at $5k.
Deal economics
- At list price, monthly cash flow is $2k ($22k/yr) — positive.
- The deal already cash-flows at list — no discount required.
- Meets the 1% rule at list price ($2k rent vs $5k).
- Cap rate 447.1% vs local median 4.9% in Pine Hills — top-decile yield for the area; either an underpriced asset or a hidden risk that comps aren't pricing in. Stress-test before assuming the spread holds.
Location & tenants
- Location reads 73/100 on livability (#317 in FL) — a middle-class / working-renter tenant base. Strengths: commute A+, cost of living A+, housing A+; Watch: crime D+, employment D, amenities F.
- Orange (suburban): math 46% / reading 51% proficiency, ranked #43 of 73 in FL (top 59%) — families likely to look elsewhere, expect single-tenant / working-renter base with shorter leases.
- Market conditions: Rents soft (-0.3%/yr); 246 active listings in the ZIP; 16 comparable units currently listed for rent nearby; rentals at typical pace (median 22d on market — plan ~3-4 weeks tenant-placement turnaround); 8,053 units permitted in Orange County in 2024 (3,133 in 5+ unit buildings).
- At $2,369/mo this rent would consume 57% of the median local household income ($50k/yr) (locally 4039% of renters already pay >50% of income on rent) — very limited rent-growth headroom before tenants either downsize or default.
Forward outlook
- Local home prices are declining (-3.0%/yr); year-one equity from $35 of loan paydown is wiped out by about $150 of value loss. Plan a longer hold.
- Orange County population projected at +52% by 2050 — long-run rental-demand tailwind backs the buy-and-hold thesis.
- At projected returns (-3.0% appreciation + 0.0% rent growth), your $1k cash investment doubles in ~1 year — after that, you're playing with house money.
Negotiation context
- Only 2 days on market — expect competitive offers; lowballing is unlikely to land.
- 3 sale attempts since 2y ago with the ask held roughly flat each time — persistent listings suggest the price (not the market) is what's stuck; bring a comps-based counter.
Risks & watch-outs
- Climate carrying-cost: severe wind risk, 99% chance of damaging wind over 30y; extreme-heat days projected 7→22/yr by 2055 (HVAC capex compounding) — expect insurance premiums to compound above CPI over the hold.
Questions for the listing agent
- Built in 1979 — when were the roof, HVAC, electrical panel, plumbing, and water heater last replaced?
- Is there a deadline driving the sale (1031 exchange, divorce, estate, relocation)? That informs how much negotiation room exists.
- Schools are B-rated — typically a magnet for longer-tenancy family renters. What's the average tenant stay here, and is there a school-zone premium baked into asking?
- Crime grade is D in this area — have there been break-ins, vandalism, or insurance claims at this property in the last 3 years? What carrier currently insures it and at what premium?
- The area grade is low — what's the realistic commute time and amenity access for the typical tenant pool here? Any planned neighborhood developments (good or bad) we should know about?
- What's the average days-on-market for RENTAL listings here right now (not sales)? A rising rental-DOM trend means longer vacancies and softer asking-rent achievability than the comps imply.
- What's the recent tenant-quality profile in this submarket — average credit score on applications, eviction rate, late-payment / NSF rate, and stable-employment percentage? A property-management company in the area should have these aggregated.
- How much new for-sale + rental construction is in the pipeline within 1–3 miles? Heavy new supply typically softens prices + rents 12–24 months out; constrained supply supports both.
Investment metrics
- 1% rule
- 47.38% ✓
- Cap rate
- 447.14%
- Cash-on-cash
- 1574.46%
- DSCR
- 71.05
- GRM
- 0.2
CMA / ARV
- ARV (on-the-fly)
- $356,364
- Comps found
- 3
Show comp detail 3 sales within ~0.75 mi
| Address | Dist | Beds/Ba | Sqft | Sold | Price | $/sf | Match |
|---|---|---|---|---|---|---|---|
| 4003 Wendy Dr | 0.25mi | 4/2.0 | 2,022 (-3%) | 23mo | $345,000 | $171 | 64 |
| 5027 Scarsdale Manor Ln | 0.60mi | 4/3.0 | 1,964 (-6%) | 15mo | $354,990 | $181 | 46 |
| 5240 N Powers Dr | 0.75mi | 3/3.0 (-1) | 2,040 (-2%) | 16mo | $225,000 | $110 | 40 |
Match score weights: distance 35% · size 25% · config 20% · recency 20%. Top-matched comps best support the ARV.
Projected returns pro-forma
-3.0% appreciation · 0.0% rent growth · sell at horizon
- IRR
- —
- Equity multiple
- 79.05×
- Total profit
- $109,274
- Equity at exit
- $746
- IRR
- —
- Equity multiple
- 157.51×
- Total profit
- $219,115
- Equity at exit
- $432
Cash invested: $1,400 (down + closing). Projections, not guarantees.
Landlord ↔ Tenant lean methodology
- Overall (STATE)
- 87 Strongly Landlord-Friendly
- State Florida
- 87 Strongly Landlord-Friendly · R+3
- County
- — inherits STATE
- City
- — inherits STATE
ZIP-level market 32808
- Home prices YoY
- -22.6%
- Rents YoY
- -0.3%
- Active inventory
- 246
- Price-to-rent
- 0.2×
Monthly cashflow live
- Estimated rent
- $2,369 high interval (Pro) →
- Mortgage (P&I)
- −$26
- Tax est. 1.5%
- −$6 /mo · $75/yr
- Insurance
- −$2
- HOA
- −$0
- Vacancy / Maint / Mgmt
- −$497
- Net cashflow
- $1,837
Break-even live
UW: 25.0% down · 7.5% · 30yr · 1.5% tax · 5.0% vac · 8.0% maint · 8.0% mgmt
Financing live
Cash to close
- Down payment
- $1,250
- Closing costs
- $150
- Reserves months
- —
- Total cash needed
- —
Loan-product check · same deal, 3 products live
Conventional
25% down · 7.5% · 30yr
- Down + closing
- —
- Monthly P&I
- —
- Monthly cashflow
- —
- DSCR
- —
- Eligible?
- —
Personal DTI + credit; lowest rate.
DSCR
20% down · 8.5% · 30yr
- Down + closing
- —
- Monthly P&I
- —
- Monthly cashflow
- —
- DSCR
- —
- Eligible?
- —
No personal income docs; deal must DSCR.
Hard money
10% down · 12.0% · 12mo
- Down + closing
- —
- Monthly P&I
- —
- Monthly cashflow
- —
- DSCR
- —
- Eligible?
- —
Short-term bridge; refi at stabilization.
Rent comps 16 comps
| Address | Beds | Baths | Sqft | Rent | $/sqft | DOM | Units | Dist |
|---|---|---|---|---|---|---|---|---|
| 4006 Luan Dr Orlando, FL | 3.0 | 2.0 | 1717 | $2,095 | $1.22 | 23d | 1 | 0.20mi |
| 6560 Whirlaway Cir Unit -1 Orlando, FL | 3.0 | 2.0 | 1530 | $2,150 | $1.41 | 4d | 1 | 0.50mi |
| 6433 Sardina Blvd Orlando, FL | 3.0 | 2.0 | 1590 | $2,230 | $1.40 | 23d | 1 | 0.51mi |
| 6926 Thousand Oaks Rd Orlando, FL | 4.0 | 2.5 | 1916 | $2,950 | $1.54 | 21d | 1 | 0.73mi |
| 3402 Bretwood Dr Orlando, FL | 4.0 | 2.0 | 1936 | $2,500 | $1.29 | 21d | 1 | 0.82mi |
| 3903 Pine Ridge Rd Orlando, FL | 4.0 | 1.5 | 1450 | $1,949 | $1.34 | 23d | 1 | 0.83mi |
| 5717 Fernhill Dr Orlando, FL | 3.0 | 1.0 | 1619 | $1,700 | $1.05 | 3d | 1 | 0.86mi |
| 6933 Rembrandt Dr Orlando, FL | 4.0 | 2.0 | 1628 | $2,500 | $1.54 | 17d | 1 | 0.98mi |
| 6018 Brookhill Cir Orlando, FL | 4.0 | 2.5 | 2252 | $2,800 | $1.24 | 21d | 1 | 1.12mi |
| 6517 Spring Glade Ct Orlando, FL | 3.0 | 2.0 | 1425 | $1,320 | $0.93 | 23d | 1 | 1.13mi |
| 6724 Callie Rd Orlando, FL | 3.0 | 2.0 | 1730 | $2,500 | $1.45 | 14d | 1 | 1.21mi |
| 4547 Ashtubula Ct Orlando, FL | 4.0 | 2.5 | 2620 | $2,600 | $0.99 | 4d | 1 | 1.22mi |
| 4545 Malvern Hill Dr Orlando, FL | 3.0 | 2.0 | 1994 | $2,200 | $1.10 | 21d | 1 | 1.26mi |
| 4751 Beacon St Orlando, FL | 4.0 | 2.0 | 1624 | $2,500 | $1.54 | 7d | 1 | 1.28mi |
| 5061 Barnegat Point Rd Orlando, FL | 4.0 | 2.0 | 1712 | $2,400 | $1.40 | 21d | 1 | 1.29mi |
| 3152 Pell Mell Dr Orlando, FL | 3.0 | 2.0 | 1744 | $2,000 | $1.15 | 10d | 1 | 1.32mi |
Listing history 3 events
-
2026-06-18days on market $5,000 Active 2 DOM
-
2026-06-17remarks 295-char remark
-
2026-06-17$5,000 Active 1 DOM
ⓘ Source: listings_history table (triggers on properties + properties_extension) + one-shot
backfill from property_details.listing_events for pre-trigger history.
Climate risk First Street
- Flood 1/10 Low FEMA zone X (unshaded) · 0% chance over 30 yrs
- Wildfire 1/10 Low
- Heat 9/10 Extreme 7 d/yr ≥108°F today · 22 d/yr by 30 yrs out
- Wind 9/10 Extreme 99% chance of damaging wind over 30 yrs
- Air quality 1/10 Low 0 unhealthy d/yr today · 0 by 30 yrs out
Nearby sold comps map
Loading sold comps map…
Walkable amenities ~0.75 mi
Loading nearby amenities…
Taxation est. · year 1
- Rental income
- $28,427
- − Mortgage interest
- −$280
- − Property taxes
- −$75
- − Insurance
- −$25
- − Repairs & maintenance
- −$2,274
- − Management
- −$2,274
- − Depreciation
- −$145
- Taxable income
- $23,353
- Est. tax owed @ 24.0%
- −$5,605
- After-tax cash flow
- $16,438/yr
For passive investors: Depreciation is non-cash, so a rental often shows a tax loss while cash-flowing — sheltering income. Rental losses are passive: they offset passive income freely, and up to $25,000/yr can offset ordinary (W-2) income if you actively participate and your MAGI is under $100k (phasing out to $0 by $150k); unused losses carry forward. On sale, claimed depreciation is recaptured at up to 25%, and gains may owe capital-gains tax (a 1031 exchange can defer both). Figures are a year-1 estimate at your 24.0% rate — not tax advice; consult a CPA.
Schools (NCES district)
- District
- Orange
- NCES district ID
- 1201440
- Math proficiency
- 46% ▼ -9.00%
- Reading proficiency
- 51% ▼ -2.00%
- Median HH income
- $49,350
- Composite
- 41.47/100
- National rank
- #3461
- State rank
- #43 of 73 in FL
Livability — Pine Hills
- Score
- 73/100
- State rank
- #317
- US rank
- #5362
Category grades
Schools grade is shown separately in the Schools card above.
Census & demographics
- Census place
- Pine Hills, FL
- County
- Orange County · 1,471,359 people
- City population
- 60,203
- Metro
- Orlando-Kissimmee-Sanford, FL
- Population (ZIP)
- 60,203
- Household income
- $49,700
- Rent vs Own
- Severe rent burden
- 4039.0
Population outlook (Orange County) Hauer SSP2
- Today (2025)
- 1,618,226 people
- By 2030
- 1,787,404 · +10.5%
- By 2040
- 2,125,621 · +31.4%
- By 2050
- 2,454,016 · +51.6%
- By 2075
- 3,173,711 · +96.1%
- By 2100
- 3,607,781 · +122.9%
Race, ethnicity, and origin ACS 2023
- Neighborhood character
- Predominantly Black (71%)
- Race & ethnicity
- Black 71% Hispanic / Latino 13% White 10% Two or more races 7% Asian 1%
- Hispanic origin (detail)
- Mexican 2% Puerto Rican 5% Dominican 2%
- Common ancestry
- Hispanic 20% Lithuanian 1% Scandinavian 0%
- Foreign-born
- 25% · Canada, Vietnam, Jamaica
- Languages at home
- 69% English-only · French/Haitian/Cajun 18% Spanish 11% Other Indo-European 1%
Political lean MEDSL · Orange
- 2024 margin
- D (+13.6) · D 56.1% · R 42.5% · Other 1.3%
- 2008→2024 swing
- -5.0pp toward R · 2008: 18.6pp · 2024: 13.6pp
- All cycles
- 2024: D+13.6 2020: D+23.1 2016: D+24.6 2012: D+18.2 2008: D+18.6
Not yet ingested
- Civics
- —
Market trends
- HPI YoY
- ▼ -110.15%
- Current HPI
- 376.3801
- Rent YoY
- ▼ -0.27%
- Metro
- Orlando-Kissimmee-Sanford, FL
- State GDP YoY
- ▲ 3.28%
- F500 in state
- 36
Industry mix (Fortune 500 HQ in FL)
| Industry | F500 HQs | Revenue |
|---|---|---|
| Industrial Technology | 2 | $29B |
|
||
| Insurance | 2 | $17B |
|
||
| Retail | 1 | $60B |
|
||
| Technology Distribution | 1 | $58B |
|
||
| Homebuilding | 1 | $35B |
|
||
| Technology Manufacturing | 1 | $35B |
|
||
Price history
-94.6% since first listed13 events — show timeline
- 2026-06-16 Listed $5,000 HAOR as distributed by MLS GRID
- 2024-07-16 Sold (Public Records) $418,000 Public Records
- 2024-06-21 Sold (MLS) $418,000 Stellar MLS as Distributed by MLS Grid
- 2024-05-06 Pending — Stellar MLS as Distributed by MLS Grid
- 2024-04-06 Price Changed $439,900 Stellar MLS as Distributed by MLS Grid
- 2024-03-25 Relisted — Stellar MLS as Distributed by MLS Grid
- 2024-03-25 Price Changed $449,900 Stellar MLS as Distributed by MLS Grid
- 2024-03-01 Price Changed $459,900 Stellar MLS as Distributed by MLS Grid
- 2024-02-17 Listed $479,900 Stellar MLS as Distributed by MLS Grid
- 2021-08-20 Sold (Public Records) $175,000 Public Records
- 2014-06-30 Sold (Public Records) $70,000 Public Records
- 1999-12-30 Sold (Public Records) $92,500 Public Records
- 1999-03-15 Sold (Public Records) $92,500 Public Records
Property tax history
+11.8%/yrLatest (2025): $4,604 · +12.6% YoY. Source: county tax records.
Cash-flow waterfall
monthlySold comps — $/sqft
last 12 mo · ≤1 miLoading sold comps…