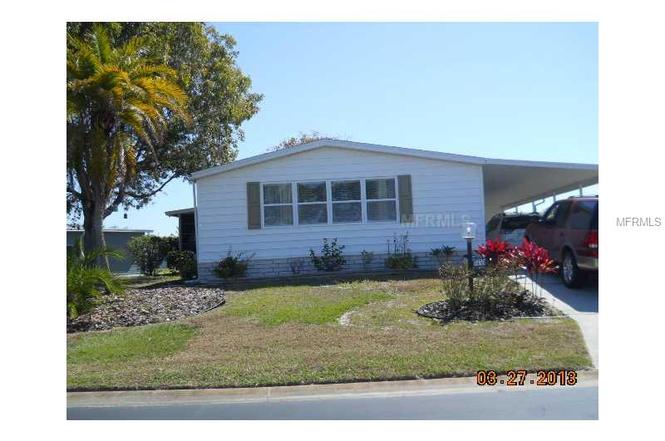
8430 Imperial Lake Cir · Ellenton, FL
Flood risk 1/10 · Minimal
- FEMA flood zone
- X (unshaded)
- Chance of flooding over 30 yrs
- 0.0%
- Est. flood insurance / yr
- $507 – $1,088
Fire risk 3/10 · Minor
- Est. fire insurance / yr
- $947 – $1,759
Heat risk 10/10 · Severe
- Hot days now (above 107°F)
- 7 days/yr
- Hot days in 30 yrs
- 29 days/yr
Wind risk 10/10 · Severe
- Chance of severe wind over 30 yrs
- 99.0%
Air-quality risk 3/10 · Minor
- Unhealthy air days now
- 3 days/yr
- Unhealthy air days in 30 yrs
- 3 days/yr
Risk factors via First Street. Map © Google.
Why this score? — see what drove the B- grade
The composite is a weighted blend of 9 inputs, each scored 0–100. Each bar is that input's sub-score; the figure is the points it added to the 100-point composite (weight × sub-score).
- Cash flow +24.0/30.0
- ARV discount +14.1/15.0
- DSCR +7.7/10.0
- 1% rule +7.3/10.0
- Schools +4.4/10.0
- Livability +3.8/5.0
- Condition / age +2.5/5.0
- Rent growth +1.8/5.0
- Appreciation +0.0/10.0
$185,000
🖨 Deal sheet (PDF) 📄 Offer letter ✓ Due diligence
Listing remarks MLS
Imperial Lakes is a premier 55 + gated community with lots of amenities for residents to enjoy. Pools, tennis courts, bocci ball and horseshoes, clubhouse and social events. Home has many upgrades which seller completed in 2012 including a new roof, new A/C and new blinds. Home sits across the street from the lake so lake views are seen from the home.
Key facts
- Florida sunroom
- Large walk-in closet
- 7,492 sq ft lot
Tags
Property features AI
Finance
- Other: Total acreage: under 1/4 acre (approx. 0.17 acres); South-facing
- Financial info: Lease restrictions apply
- HOA & community: Part of Darcy Branch association; Monthly HOA approximately $181.33 (quarterly fee listed); Association approval required; Senior community; Dogs allowed; Partially furnished
Exterior
- Parking: Carport (1 space)
- Utilities: Public water (also canal/lake irrigation available); Public sewer; Electricity available; Cable available
- Home design: Manufactured double wide home; Single-story
- Construction: Vinyl siding; Shingle roof; Crawlspace foundation; Built in approximately (public records listed)
- Exterior features: Storage; Lake view with lake access; Asphalt road frontage
Interior
- Kitchen: Built-in oven; Cooktop; Dishwasher; Microwave; Refrigerator; Ice maker
- Bedrooms: 2 bedrooms
- Flooring: Ceramic tile; Crawlspace foundation
- Bathrooms: 2 full bathrooms
- Heating & cooling: Electric heating; Central air conditioning
- Interior features: Kitchen and family room combo; Living room and dining room combo; Thermostat; Skylight(s); Storage
- Laundry & utility: Washer; Dryer; Laundry inside
Neighborhood map
What this means for you Summary
Snapshot
- This is a 2-bed/1.0-bath manufactured listed at $185k.
Deal economics
- At list price, monthly cash flow is $363 ($4k/yr) — positive.
- The deal already cash-flows at list — no discount required.
- Meets the 1% rule at list price ($2k rent vs $185k).
- Recommended offer: $163k (12.0% below list) — sets the bar for market timing.
- Cap rate 8.6% vs local median 4.5% in Ellenton — top-decile yield for the area; either an underpriced asset or a hidden risk that comps aren't pricing in. Stress-test before assuming the spread holds.
Location & tenants
- Location reads 76/100 on livability (#232 in FL, #3,666 nationally) — a middle-class / working-renter tenant base. Strengths: cost of living A+, housing A+, health & safety A+; Watch: amenities F, commute F.
- Manatee (suburban): math 54% / reading 50% proficiency, ranked #26 of 73 in FL (top 36%) — acceptable for families but not a draw, mixed tenant base, ~2y average lease.
- Zoned schools: Palmetto Elementary School (math 53% / reading 34%, grade F, #1,345 of 2,144 statewide, top 64%, 570 students, 78% FRL); Buffalo Creek Middle School (math 59% / reading 51%, grade B-, #180 of 571 statewide, top 32%, 1,127 students, 44% FRL); Palmetto High School (math 22% / reading 36%, grade F, #456 of 667 statewide, top 68%, 2,100 students, 61% FRL).
- Market conditions: Rents soft (-3.0%/yr); 1170 active listings in the ZIP; 16 comparable units currently listed for rent nearby; rentals at typical pace (median 23d on market — plan ~3-4 weeks tenant-placement turnaround); solid renter incomes; 7,472 units permitted in Manatee County in 2024 (1,782 in 5+ unit buildings).
- This rent runs 35% of the median local income ($78k/yr) — at the standard rent-burdened threshold; future hikes will face affordability resistance.
Forward outlook
- Local home prices are declining (-3.0%/yr); year-one equity from $1k of loan paydown is wiped out by about $6k of value loss. Plan a longer hold.
- Manatee County population projected at +43% by 2050 — long-run rental-demand tailwind backs the buy-and-hold thesis.
Negotiation context
- It's been on market 123 days — a 12% lower offer ($163k) is reasonable based on typical stale-listing flexibility.
- 6 sale attempts since 15y ago; this cycle's ask has dropped $47k (20%) from the opening price — seller is motivated, your offer sets the floor, not the list.
- Current owner paid $92k; list at $185k implies a 101% gain — meaningful room to come down on a strong offer.
Risks & watch-outs
- Climate carrying-cost: severe wind risk, 99% chance of damaging wind over 30y; extreme-heat days projected 7→29/yr by 2055 (HVAC capex compounding) — expect insurance premiums to compound above CPI over the hold.
Questions for the listing agent
- It's been on market 123 days. Have you received any prior offers? Is the seller open to a 12% concession, seller financing, or rate buy-down credit?
- What does the HOA fee cover, when was the last increase, and are there any pending special assessments or reserve-fund shortfalls?
- Why hasn't it sold? Are there any deal-killer items the seller is aware of (foundation, flood, title, zoning, code violations)?
- Is there a deadline driving the sale (1031 exchange, divorce, estate, relocation)? That informs how much negotiation room exists.
- Schools are D-rated, which usually means shorter tenancies and higher turnover. Who's the typical renter profile here, and what's been the actual vacancy rate?
- What's the average days-on-market for RENTAL listings here right now (not sales)? A rising rental-DOM trend means longer vacancies and softer asking-rent achievability than the comps imply.
- What's the recent tenant-quality profile in this submarket — average credit score on applications, eviction rate, late-payment / NSF rate, and stable-employment percentage? A property-management company in the area should have these aggregated.
- How much new for-sale + rental construction is in the pipeline within 1–3 miles? Heavy new supply typically softens prices + rents 12–24 months out; constrained supply supports both.
Investment metrics
- 1% rule
- 1.23% ✓
- Cap rate
- 8.65%
- Cash-on-cash
- 8.41%
- DSCR
- 1.37
- GRM
- 6.7
CMA / ARV
- ARV (on-the-fly)
- $217,074
- Comps found
- 12
Show comp detail 12 sales within ~0.75 mi
| Address | Dist | Beds/Ba | Sqft | Sold | Price | $/sf | Match |
|---|---|---|---|---|---|---|---|
| 8434 Imperial Cir | 0.03mi | 2/2.0 | 1,536 (+1%) | 7mo | $187,500 | $122 | 87 |
| 8439 Imperial Cir | 0.05mi | 2/2.0 | 1,484 (-2%) | 9mo | $265,000 | $179 | 83 |
| 8466 Imperial Cir | 0.22mi | 2/2.0 | 1,502 (-1%) | 4mo | $180,000 | $120 | 80 |
| 8485 Imperial Cir | 0.20mi | 2/2.0 | 1,592 (+5%) | 3mo | $160,000 | $101 | 76 |
| 8308 Princess Ct | 0.24mi | 2/2.0 | 1,456 (-4%) | 3mo | $180,000 | $124 | 76 |
| 8523 Countess Avenue Cir | 0.27mi | 2/2.0 | 1,431 (-6%) | 5mo | $207,500 | $145 | 70 |
| 8400 Princess Ct | 0.24mi | 3/2.0 (+1) | 1,456 (-4%) | 4mo | $185,000 | $127 | 70 |
| 8521 Countess Avenue Cir | 0.28mi | 3/2.0 (+1) | 1,596 (+5%) | 2mo | $235,000 | $147 | 68 |
| 8402 Imperial Cir | 0.16mi | 2/2.0 | 1,340 (-12%) | 3mo | $198,000 | $148 | 67 |
| 8509 Monarch Pl | 0.25mi | 2/2.0 | 1,352 (-11%) | 3mo | $255,000 | $189 | 63 |
| 8427 Castle Garden Rd | 0.18mi | 2/2.0 | 1,296 (-15%) | 3mo | $185,000 | $143 | 60 |
| 8534 Countess Avenue Cir | 0.29mi | 2/2.0 | 1,696 (+12%) | 4mo | $230,000 | $136 | 60 |
Match score weights: distance 35% · size 25% · config 20% · recency 20%. Top-matched comps best support the ARV.
Projected returns pro-forma
-3.0% appreciation · 0.0% rent growth · sell at horizon
- IRR
- -7.3%
- Equity multiple
- 0.74×
- Total profit
- $-13,414
- Equity at exit
- $27,584
- IRR
- -2.4%
- Equity multiple
- 0.86×
- Total profit
- $-7,230
- Equity at exit
- $15,995
Cash invested: $51,800 (down + closing). Projections, not guarantees.
Landlord ↔ Tenant lean methodology
- Overall (STATE)
- 87 Strongly Landlord-Friendly
- State Florida
- 87 Strongly Landlord-Friendly · R+3
- County
- — inherits STATE
- City
- — inherits STATE
ZIP-level market 34221
- Rents YoY
- -3.0%
- Active inventory
- 1170
- Price-to-rent
- 6.7×
Monthly cashflow live
- Estimated rent
- $2,284 high interval (Pro) →
- Mortgage (P&I)
- −$970
- Tax from tax record
- −$213 /mo · $2,561/yr
- Insurance
- −$77
- HOA
- −$181
- Vacancy / Maint / Mgmt
- −$480
- Net cashflow
- $363
Break-even live
Sensitivity live
| Price | -10% $468 | -5% $415 | +0% $363 | +5% $311 | +10% $258 |
|---|---|---|---|---|---|
| Rent | -10% $183 | -5% $273 | +0% $363 | +5% $453 | +10% $544 |
| Rate | -1.0pp $456 | -0.5pp $410 | base $363 | +0.5pp $315 | +1.0pp $266 |
UW: 25.0% down · 7.5% · 30yr · 1.5% tax · 5.0% vac · 8.0% maint · 8.0% mgmt
Financing live
Cash to close
- Down payment
- $46,250
- Closing costs
- $5,550
- Reserves months
- —
- Total cash needed
- —
Loan-product check · same deal, 3 products live
Conventional
25% down · 7.5% · 30yr
- Down + closing
- —
- Monthly P&I
- —
- Monthly cashflow
- —
- DSCR
- —
- Eligible?
- —
Personal DTI + credit; lowest rate.
DSCR
20% down · 8.5% · 30yr
- Down + closing
- —
- Monthly P&I
- —
- Monthly cashflow
- —
- DSCR
- —
- Eligible?
- —
No personal income docs; deal must DSCR.
Hard money
10% down · 12.0% · 12mo
- Down + closing
- —
- Monthly P&I
- —
- Monthly cashflow
- —
- DSCR
- —
- Eligible?
- —
Short-term bridge; refi at stabilization.
Rent comps 16 comps
| Address | Beds | Baths | Sqft | Rent | $/sqft | DOM | Units | Dist |
|---|---|---|---|---|---|---|---|---|
| 9650 52nd Ave E Palmetto, FL | 1.0–3.0 | 1.0–2.0 | 1050 | $1,958 | $1.87 | 25d | 99 | 0.72mi |
| 4117 84th Ct E Palmetto, FL | 3.0 | 2.0 | 1448 | $2,466 | $1.70 | 23d | 1 | 0.94mi |
| 5871 Bungalow Grove Ct Palmetto, FL | 3.0 | 2.0 | 1492 | $2,185 | $1.46 | 23d | 1 | 0.99mi |
| 9117 Optimist Way Palmetto, FL | 2.0 | 2.0 | 1489 | $2,200 | $1.48 | 25d | 1 | 1.02mi |
| 4014 84th Ct E Palmetto, FL | 3.0 | 2.0 | 1555 | $2,516 | $1.62 | 23d | 1 | 1.04mi |
| 6210 Terra Lago Cir Palmetto, FL | 1.0–3.0 | 1.0–2.0 | 1015 | $1,962 | $1.93 | 5d | 50 | 1.11mi |
| 4816 Heinman Cv Palmetto, FL | 3.0 | 2.0 | 1920 | $3,300 | $1.72 | 13d | 1 | 1.26mi |
| 7562 Sea Oak Ct Palmetto, FL | 3.0 | 2.0 | 1433 | $2,400 | $1.67 | 23d | 1 | 1.33mi |
| 7566 Sea Oak Ct Palmetto, FL | 3.0 | 2.5 | 1807 | $2,700 | $1.49 | 23d | 1 | 1.33mi |
| 6249 Fairmont Ln Palmetto, FL | 2.0 | 2.5 | 1200 | $1,890 | $1.57 | 16d | 1 | 1.34mi |
| 6256 Fairmont Ln Palmetto, FL | 2.0 | 2.5 | 1216 | $1,845 | $1.52 | 16d | 1 | 1.37mi |
| 6334 Fairmont Ln Palmetto, FL | 2.0 | 2.5 | 1235 | $1,795 | $1.45 | 5d | 1 | 1.39mi |
| 6354 Fairmont Ln Palmetto, FL | 2.0 | 2.5 | 1123 | $2,000 | $1.78 | 25d | 1 | 1.39mi |
| 6345 Willowside St Palmetto, FL | 3.0 | 2.5 | 1407 | $2,200 | $1.56 | 25d | 1 | 1.41mi |
| 9262 Gulf Haven Dr Palmetto, FL | 3.0 | 2.5 | 2043 | $2,750 | $1.35 | 16d | 1 | 1.46mi |
| 5331 Rushmere Ct Palmetto, FL | 2.0 | 2.5 | 1582 | $2,600 | $1.64 | 25d | 1 | 1.47mi |
HOA detail
- Monthly dues
- $181 · $2,172/yr
- Likely covers
- poolsecurity
Listing history 32 events
-
2026-06-17days on market $185,000 Active 123 DOM
-
2026-06-16days on market $185,000 Active 122 DOM
-
2026-06-15days on market $185,000 Active 121 DOM
-
2026-06-13days on market $185,000 Active 119 DOM
-
2026-06-13days on market $185,000 Active 118 DOM
-
2026-06-10days on market $185,000 Active 116 DOM
-
2026-06-09days on market $185,000 Active 115 DOM
-
2026-06-08days on market $185,000 Active 114 DOM
-
2026-06-08days on market $185,000 Active 113 DOM
-
2026-06-03days on market $185,000 Active 109 DOM
-
2026-06-02days on market $185,000 Active 108 DOM
-
2026-06-01days on market $185,000 Active 107 DOM
-
2026-05-31days on market $185,000 Active 106 DOM
-
2026-05-06price $185,000
-
2026-04-18price $210,042
-
2026-03-23price $224,042
-
2026-02-14$232,000 Active
-
2014-03-21soldstatus $92,000
-
2014-03-18soldstatus $92,000 Sold 353-char remark
Show marketing remark (353 chars)
Imperial Lakes is a premier 55 + gated community with lots of amenities for residents to enjoy. Pools, tennis courts, bocci ball and horseshoes, clubhouse and social events. Home has many upgrades which seller completed in 2012 including a new roof, new A/C and new blinds. Home sits across the street from the lake so lake views are seen from the home.
-
2014-02-28historical
-
2014-01-26$96,500 353-char remark
Show marketing remark (353 chars)
Imperial Lakes is a premier 55 + gated community with lots of amenities for residents to enjoy. Pools, tennis courts, bocci ball and horseshoes, clubhouse and social events. Home has many upgrades which seller completed in 2012 including a new roof, new A/C and new blinds. Home sits across the street from the lake so lake views are seen from the home.
-
2013-12-04$98,900
-
2012-09-06soldstatus $65,000
-
2012-08-30soldstatus $65,000
-
2012-04-23$79,775
-
2012-03-18historical
-
2011-11-23$75,800
-
2011-05-11historical
-
2011-03-11$96,900
-
1998-10-06soldstatus $70,000
-
1996-08-02soldstatus $70,000
-
1988-09-16soldstatus $84,500
ⓘ Source: listings_history table (triggers on properties + properties_extension) + one-shot
backfill from property_details.listing_events for pre-trigger history.
Tax reassessment forecast FL · Resets to sale price
- Current annual tax
- $2,561 · $213/mo
- Projected year-2 tax
- $2,561 · $213/mo
- Expected delta
- $0/yr ($0/mo · 0.0%)
ⓘ Screening estimate from a state-policy table — verify with the county assessor before closing.
Climate risk First Street
- Flood 1/10 Low FEMA zone X (unshaded) · 0% chance over 30 yrs
- Wildfire 3/10 Moderate
- Heat 10/10 Extreme 7 d/yr ≥107°F today · 29 d/yr by 30 yrs out
- Wind 10/10 Extreme 99% chance of damaging wind over 30 yrs
- Air quality 3/10 Moderate 3 unhealthy d/yr today · 3 by 30 yrs out
Nearby sold comps map
Loading sold comps map…
Walkable amenities ~0.75 mi
Loading nearby amenities…
Taxation est. · year 1
- Rental income
- $27,414
- − Mortgage interest
- −$10,363
- − Property taxes
- −$2,561
- − Insurance
- −$925
- − Repairs & maintenance
- −$2,193
- − Management
- −$2,193
- − HOA
- −$2,172
- − Depreciation
- −$5,382
- Taxable income
- $1,625
- Est. tax owed @ 24.0%
- −$390
- After-tax cash flow
- $3,967/yr
For passive investors: Depreciation is non-cash, so a rental often shows a tax loss while cash-flowing — sheltering income. Rental losses are passive: they offset passive income freely, and up to $25,000/yr can offset ordinary (W-2) income if you actively participate and your MAGI is under $100k (phasing out to $0 by $150k); unused losses carry forward. On sale, claimed depreciation is recaptured at up to 25%, and gains may owe capital-gains tax (a 1031 exchange can defer both). Figures are a year-1 estimate at your 24.0% rate — not tax advice; consult a CPA.
Schools (NCES district)
- District
- Manatee
- NCES district ID
- 1201230
- Math proficiency
- 54% ▼ -6.00%
- Reading proficiency
- 50% ▼ -2.00%
- Median HH income
- $49,607
- Composite
- 44.43/100
- National rank
- #2806
- State rank
- #26 of 73 in FL
Livability — Ellenton
- Score
- 76/100
- State rank
- #232
- US rank
- #3666
Category grades
Schools grade is shown separately in the Schools card above.
Census & demographics
- County
- Manatee County · 416,364 people
- City population
- 14,819
- Metro
- North Port-Sarasota-Bradenton, FL
- Population (ZIP)
- 56,208
- Household income
- $77,712
- Rent vs Own
- Severe rent burden
- 1193.0
Population outlook (Manatee County) Hauer SSP2
- Today (2025)
- 447,342 people
- By 2030
- 488,911 · +9.3%
- By 2040
- 567,934 · +27.0%
- By 2050
- 637,995 · +42.6%
- By 2075
- 781,970 · +74.8%
- By 2100
- 848,272 · +89.6%
Race, ethnicity, and origin ACS 2023
- Neighborhood character
- Diverse neighborhood (Simpson 0.58)
- Race & ethnicity
- White 59% Hispanic / Latino 22% Black 14% Two or more races 11%
- Hispanic origin (detail)
- Mexican 14% Puerto Rican 3%
- Common ancestry
- Romanian 2% Lithuanian 2% Italian 2%
- Foreign-born
- 10% · Canada, Dominican Republic, Jamaica
- Languages at home
- 81% English-only · Spanish 16% Other Indo-European 1%
Political lean MEDSL · Manatee
- 2024 margin
- Strong R (+23.5) · D 37.9% · R 61.4%
- 2008→2024 swing
- -16.5pp toward R · 2008: -7.0pp · 2024: -23.5pp
- All cycles
- 2024: R+23.5 2020: R+16.1 2016: R+17.1 2012: R+12.5 2008: R+7.0
Not yet ingested
- Civics
- —
Market trends
- HPI YoY
- ▼ -383.53%
- Current HPI
- 302.1458
- Rent YoY
- ▼ -2.98%
- Metro
- North Port-Sarasota-Bradenton, FL
- State GDP YoY
- ▲ 3.28%
- F500 in state
- 36
Industry mix (Fortune 500 HQ in FL)
| Industry | F500 HQs | Revenue |
|---|---|---|
| Industrial Technology | 2 | $29B |
|
||
| Insurance | 2 | $17B |
|
||
| Retail | 1 | $60B |
|
||
| Technology Distribution | 1 | $58B |
|
||
| Homebuilding | 1 | $35B |
|
||
| Technology Manufacturing | 1 | $35B |
|
||
Price history
+118.9% since first listed19 events — show timeline
- 2026-05-06 Price Changed $185,000 Stellar MLS as Distributed by MLS Grid
- 2026-04-18 Price Changed $210,042 Stellar MLS as Distributed by MLS Grid
- 2026-03-23 Price Changed $224,042 Stellar MLS as Distributed by MLS Grid
- 2026-02-14 Listed $232,000 Stellar MLS as Distributed by MLS Grid
- 2014-03-21 Sold (Public Records) $92,000 Public Records
- 2014-03-18 Sold (MLS) $92,000 Stellar MLS as Distributed by MLS Grid
- 2014-02-28 Listing Removed — Stellar MLS as Distributed by MLS Grid
- 2014-01-26 Listed $96,500 Stellar MLS as Distributed by MLS Grid
- 2013-12-04 Listed $98,900 Stellar MLS as Distributed by MLS Grid
- 2012-09-06 Sold (Public Records) $65,000 Public Records
- 2012-08-30 Sold (MLS) $65,000 Stellar MLS as Distributed by MLS Grid
- 2012-04-23 Listed $79,775 Stellar MLS as Distributed by MLS Grid
- 2012-03-18 Listing Removed — Stellar MLS as Distributed by MLS Grid
- 2011-11-23 Listed $75,800 Stellar MLS as Distributed by MLS Grid
- 2011-05-11 Listing Removed — Stellar MLS as Distributed by MLS Grid
- 2011-03-11 Listed $96,900 Stellar MLS as Distributed by MLS Grid
- 1998-10-06 Sold (Public Records) $70,000 Public Records
- 1996-08-02 Sold (Public Records) $70,000 Public Records
- 1988-09-16 Sold (Public Records) $84,500 Public Records
Property tax history
+6.9%/yrLatest (2025): $2,561 · +301.6% YoY. Source: county tax records.
Cash-flow waterfall
monthlySold comps — $/sqft
last 12 mo · ≤1 miLoading sold comps…