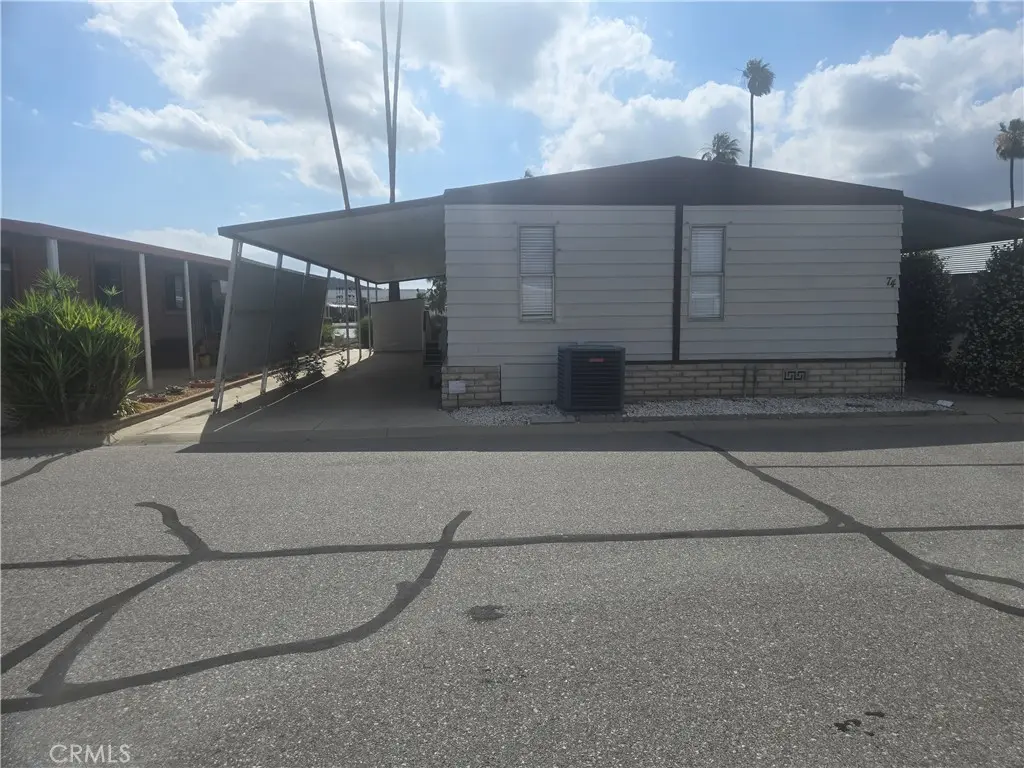
5001 W Florida #74 · Hemet, CA
Flood risk 1/10 · Minimal
- FEMA flood zone
- X (unshaded)
- Chance of flooding over 30 yrs
- 0.0%
- Est. flood insurance / yr
- $507 – $1,088
Fire risk 7/10 · Major
- Est. fire insurance / yr
- $659 – $1,223
Heat risk 7/10 · Major
- Hot days now (above 105°F)
- 3 days/yr
- Hot days in 30 yrs
- 9 days/yr
Wind risk 1/10 · Minimal
- Chance of severe wind over 30 yrs
- —
Air-quality risk 6/10 · Moderate
- Unhealthy air days now
- 9 days/yr
- Unhealthy air days in 30 yrs
- 11 days/yr
Risk factors via First Street. Map © Google.
Why this score? — see what drove the C+ grade
The composite is a weighted blend of 9 inputs, each scored 0–100. Each bar is that input's sub-score; the figure is the points it added to the 100-point composite (weight × sub-score).
- Cash flow +30.0/30.0
- 1% rule +10.0/10.0
- DSCR +10.0/10.0
- Rent growth +3.4/5.0
- Livability +2.6/5.0
- Schools +2.5/10.0
- Condition / age +2.5/5.0
- ARV discount +0.0/15.0
- Appreciation +0.0/10.0
$90,000
🖨 Deal sheet (PDF) 📄 Offer letter ✓ Due diligence
Listing remarks
Welcome to the Lakes at Hemet West, This property is waterfront in a guard gated, 55 + community , Large Clubhouse With Dance Floor, pool, BBQ area, 9-hole golf course dog park, Enjoy an open layout with two built in units and a kitchen island that offers open floors , 2 bedrooms and 2 bathrooms, Master bedrooms futures walk in closets and a bath tub the community has lots of activities
Key facts
- Dog park
- Bbq area
- Large clubhouse
Tags
Property features AI
Finance
- Other: Manager approval required for residency; Pets allowed with breed restrictions
- Financial info: Land lease of $1,235
- HOA & community: Part of an association; Senior community
Exterior
- Parking: Located in The Lake at Hemet park
- Utilities: Public sewer; District/public water
- Home design: Manufactured/mobile home (24' x 60'); Single-story; Mobile home remains on site
- Construction: Year built per public records
- Exterior features: Community pool; Neighborhood amenities include golf course, biking, dog park, hiking, lake, and park
Interior
- Bathrooms: 2 full bathrooms
- Heating & cooling: Central heating (furnace); Central cooling
- Interior features: All bedrooms on the ground floor; Single-level home; Side entry
- Laundry & utility: On-site laundry available; Gas dryer hookup and gas & electric dryer hookup
Neighborhood map
What this means for you Summary
Snapshot
- This is a 2-bed/2.0-bath manufactured listed at $90k.
Deal economics
- At list price, monthly cash flow is $1k ($13k/yr) — positive.
- The deal already cash-flows at list — no discount required.
- Meets the 1% rule at list price ($2k rent vs $90k).
- Recommended offer: $89k (1.5% below list) — sets the bar for market timing.
- Cap rate 21.0% vs local median 4.8% in Hemet — top-decile yield for the area; either an underpriced asset or a hidden risk that comps aren't pricing in. Stress-test before assuming the spread holds.
Location & tenants
- Location reads 51/100 on livability (#1,056 in CA) — a working-class tenant base; expect higher turnover. Strengths: housing A+; Watch: crime D+, amenities F, commute F.
- Hemet Unified (suburban): math 19% / reading 41% proficiency, ranked #360 of 517 in CA (top 70%) — families likely to look elsewhere, expect single-tenant / working-renter base with shorter leases; 66% free/reduced lunch — lower-income household profile, screen leases tightly.
- Zoned schools: Harmony Elementary (684 students, 84% FRL); Diamond Valley Middle (math 10% / reading 10%, grade F, #474 of 498 statewide, top 99%, 1,078 students, 91% FRL); West Valley High (math 18% / reading 40%, grade F, #770 of 1,170 statewide, top 66%, 1,898 students, 88% FRL) — zoned schools average 88% FRL vs 66% district-wide (22 pts higher); higher-poverty schools than district average — tighter screening recommended.
- Market conditions: Rents rising (+3.7%/yr); 292 active listings in the ZIP; 6 comparable units currently listed for rent nearby; rentals at typical pace (median 17d on market — plan ~3-4 weeks tenant-placement turnaround); 9,195 units permitted in Riverside County in 2024 (1,512 in 5+ unit buildings).
- This rent runs 39% of the median local income ($64k/yr) — at the standard rent-burdened threshold; future hikes will face affordability resistance.
Forward outlook
- Local home prices are declining (-3.0%/yr); year-one equity from $622 of loan paydown is wiped out by about $3k of value loss. Plan a longer hold.
- Riverside County population projected at +22% by 2050 — long-run rental-demand tailwind backs the buy-and-hold thesis.
- At projected returns (-3.0% appreciation + 3.7% rent growth), your $25k cash investment doubles in ~3 years — after that, you're playing with house money.
Negotiation context
- It's been on market 25 days — a 2% lower offer ($89k) is reasonable based on typical stale-listing flexibility.
- 5 sale attempts since 5y ago with the ask held roughly flat each time — persistent listings suggest the price (not the market) is what's stuck; bring a comps-based counter.
- Current owner paid $30k; list at $90k implies a 200% gain — meaningful room to come down on a strong offer.
Risks & watch-outs
- Climate carrying-cost: major wildfire risk; extreme-heat days projected 3→9/yr by 2055 (HVAC capex compounding) — expect insurance premiums to compound above CPI over the hold.
Questions for the listing agent
- Built in 1973 — when were the roof, HVAC, electrical panel, plumbing, and water heater last replaced?
- Is there a deadline driving the sale (1031 exchange, divorce, estate, relocation)? That informs how much negotiation room exists.
- Schools are F-rated, which usually means shorter tenancies and higher turnover. Who's the typical renter profile here, and what's been the actual vacancy rate?
- Crime grade is D in this area — have there been break-ins, vandalism, or insurance claims at this property in the last 3 years? What carrier currently insures it and at what premium?
- What's the average days-on-market for RENTAL listings here right now (not sales)? A rising rental-DOM trend means longer vacancies and softer asking-rent achievability than the comps imply.
- What's the recent tenant-quality profile in this submarket — average credit score on applications, eviction rate, late-payment / NSF rate, and stable-employment percentage? A property-management company in the area should have these aggregated.
- How much new for-sale + rental construction is in the pipeline within 1–3 miles? Heavy new supply typically softens prices + rents 12–24 months out; constrained supply supports both.
Investment metrics
- 1% rule
- 2.29% ✓
- Cap rate
- 21.02%
- Cash-on-cash
- 52.61%
- DSCR
- 3.34
- GRM
- 3.6
CMA / ARV
- ARV (on-the-fly)
- $67,680
- Comps found
- 12
Show comp detail 12 sales within ~0.75 mi
| Address | Dist | Beds/Ba | Sqft | Sold | Price | $/sf | Match |
|---|---|---|---|---|---|---|---|
| 5001 W Florida #171 | 0.00mi | 2/2.0 | 1,440 (0%) | 1mo | $67,000 | $47 | 99 |
| 5001 FLORIDA #311 | 0.00mi | 2/2.0 | 1,440 (0%) | 1mo | $73,990 | $51 | 99 |
| 5001 W Florida Ave #305 | 0.00mi | 2/2.0 | 1,440 (0%) | 2mo | $91,000 | $63 | 98 |
| 5001 W Florida #661 | 0.00mi | 2/2.0 | 1,440 (0%) | 3mo | $97,000 | $67 | 97 |
| 5001 W Florida Ave #482 | 0.00mi | 2/2.0 | 1,440 (0%) | 4mo | $55,000 | $38 | 96 |
| 5001 W Florida #524 | 0.00mi | 2/2.0 | 1,488 (+3%) | 3mo | $62,000 | $42 | 92 |
| 5001 W Florida #618 | 0.00mi | 2/2.0 | 1,344 (-7%) | 4mo | $70,000 | $52 | 86 |
| 5001 W Florida Ave W #728 | 0.00mi | 2/2.0 | 1,344 (-7%) | 4mo | $56,000 | $42 | 86 |
| 5001 W Florida Ave #135 | 0.10mi | 2/2.0 | 1,504 (+4%) | 6mo | $55,000 | $37 | 83 |
| 5001 W Florida Ave #139 | 0.00mi | 2/2.0 | 1,560 (+8%) | 5mo | $105,000 | $67 | 82 |
| 5001 W Florida Ave #122 | 0.10mi | 2/2.0 | 1,296 (-10%) | 0mo | $52,500 | $41 | 78 |
| 5001 W Florida #695 | 0.10mi | 2/2.0 | 1,248 (-13%) | 5mo | $45,000 | $36 | 69 |
Match score weights: distance 35% · size 25% · config 20% · recency 20%. Top-matched comps best support the ARV.
Projected returns pro-forma
-3.0% appreciation · 3.74% rent growth · sell at horizon
- IRR
- 51.4%
- Equity multiple
- 3.27×
- Total profit
- $57,298
- Equity at exit
- $13,419
- IRR
- 57.0%
- Equity multiple
- 6.83×
- Total profit
- $146,831
- Equity at exit
- $7,782
Cash invested: $25,200 (down + closing). Projections, not guarantees.
Landlord ↔ Tenant lean methodology
- Overall (STATE)
- 18 Strongly Tenant-Friendly
- State California
- 18 Strongly Tenant-Friendly · D+13
- County
- — inherits STATE
- City
- — inherits STATE
ZIP-level market 92545
- Home prices YoY
- -24.6%
- Rents YoY
- 3.7%
- Active inventory
- 292
- Price-to-rent
- 3.6×
Monthly cashflow live
- Estimated rent
- $2,064 high interval (Pro) →
- Mortgage (P&I)
- −$472
- Tax from tax record
- −$16 /mo · $193/yr
- Insurance
- −$38
- HOA
- −$0
- Vacancy / Maint / Mgmt
- −$433
- Net cashflow
- $1,105
Break-even live
Sensitivity live
| Price | -10% $1,156 | -5% $1,130 | +0% $1,105 | +5% $1,079 | +10% $946 |
|---|---|---|---|---|---|
| Rent | -10% $942 | -5% $1,023 | +0% $1,105 | +5% $1,186 | +10% $1,268 |
| Rate | -1.0pp $1,150 | -0.5pp $1,128 | base $1,105 | +0.5pp $1,081 | +1.0pp $1,058 |
UW: 25.0% down · 7.5% · 30yr · 1.5% tax · 5.0% vac · 8.0% maint · 8.0% mgmt
Financing live
Cash to close
- Down payment
- $22,500
- Closing costs
- $2,700
- Reserves months
- —
- Total cash needed
- —
Loan-product check · same deal, 3 products live
Conventional
25% down · 7.5% · 30yr
- Down + closing
- —
- Monthly P&I
- —
- Monthly cashflow
- —
- DSCR
- —
- Eligible?
- —
Personal DTI + credit; lowest rate.
DSCR
20% down · 8.5% · 30yr
- Down + closing
- —
- Monthly P&I
- —
- Monthly cashflow
- —
- DSCR
- —
- Eligible?
- —
No personal income docs; deal must DSCR.
Hard money
10% down · 12.0% · 12mo
- Down + closing
- —
- Monthly P&I
- —
- Monthly cashflow
- —
- DSCR
- —
- Eligible?
- —
Short-term bridge; refi at stabilization.
Rent comps 6 comps
| Address | Beds | Baths | Sqft | Rent | $/sqft | DOM | Units | Dist |
|---|---|---|---|---|---|---|---|---|
| 4400 W Florida Ave Spc 26 Hemet, CA | 3.0 | 2.0 | 1193 | $1,699 | $1.42 | 16d | 1 | 0.51mi |
| 4400 W Florida Ave Unit 86 Hemet, CA | 3.0 | 2.0 | 1310 | $1,800 | $1.37 | 45d | 1 | 0.54mi |
| 3800 W Devonshire Ave Hemet, CA | 3.0 | 1.0–2.0 | 816 | $2,172 | $2.66 | 0d | 7 | 1.07mi |
| 3030 W Acacia Ave Hemet, CA | 1.0–2.0 | 1.0–2.0 | 807 | $1,780 | $2.20 | 0d | 8 | 1.25mi |
| 2971 Pembroke Ave Hemet, CA | 3.0 | 2.0 | 1572 | $3,000 | $1.91 | 20d | 1 | 1.29mi |
| 3471 Dublin Ct Hemet, CA | 3.0 | 2.0 | 1276 | $2,895 | $2.27 | 5d | 1 | 1.39mi |
Listing history 31 events
-
2026-06-21days on market $90,000 Active 25 DOM
-
2026-06-18days on market $90,000 Active 22 DOM
-
2026-06-17days on market $90,000 Active 21 DOM
-
2026-06-16days on market $90,000 Active 20 DOM
-
2026-06-15days on market $90,000 Active 19 DOM
-
2026-06-13days on market $90,000 Active 17 DOM
-
2026-06-09days on market $90,000 Active 13 DOM
-
2026-06-08days on market $90,000 Active 12 DOM
-
2026-06-07days on market $90,000 Active 11 DOM
-
2026-06-04days on market $90,000 Active 8 DOM
-
2026-06-03days on market $90,000 Active 7 DOM
-
2026-06-02days on market $90,000 Active 6 DOM
-
2026-06-01days on market $90,000 Active 5 DOM
-
2026-05-31days on market $90,000 Active 4 DOM
-
2026-05-27$90,000 Active
-
2024-12-28historical
-
2024-12-13price $40,000
-
2024-12-05price $48,000
-
2024-12-01price $58,000
-
2024-11-28price $65,000
-
2024-11-20price $80,000
-
2024-11-15price $99,000
-
2024-11-06$105,000 Active
-
2024-11-03historical
-
2024-11-02price $120,000
-
2024-10-23$139,000 Active
-
2024-10-21historical
-
2021-04-29soldstatus $30,000 Closed Sale
-
2021-04-13status Pending Sale
-
2021-04-13status Active
-
2021-03-30$30,000 Active
ⓘ Source: listings_history table (triggers on properties + properties_extension) + one-shot
backfill from property_details.listing_events for pre-trigger history.
Tax reassessment forecast CA · Resets to sale price
- Current annual tax
- $193 · $16/mo
- Projected year-2 tax
- $684 · $57/mo
- Expected delta
- +$491/yr (+$41/mo · 254.1%)
ⓘ Screening estimate from a state-policy table — verify with the county assessor before closing.
Climate risk First Street
- Flood 1/10 Low FEMA zone X (unshaded) · 0% chance over 30 yrs
- Wildfire 7/10 Severe
- Heat 7/10 Severe 3 d/yr ≥105°F today · 9 d/yr by 30 yrs out
- Wind 1/10 Low
- Air quality 6/10 Major 9 unhealthy d/yr today · 11 by 30 yrs out
Nearby sold comps map
Loading sold comps map…
Walkable amenities ~0.75 mi
Loading nearby amenities…
Taxation est. · year 1
- Rental income
- $24,764
- − Mortgage interest
- −$5,041
- − Property taxes
- −$193
- − Insurance
- −$450
- − Repairs & maintenance
- −$1,981
- − Management
- −$1,981
- − Depreciation
- −$2,618
- Taxable income
- $12,499
- Est. tax owed @ 24.0%
- −$3,000
- After-tax cash flow
- $10,257/yr
For passive investors: Depreciation is non-cash, so a rental often shows a tax loss while cash-flowing — sheltering income. Rental losses are passive: they offset passive income freely, and up to $25,000/yr can offset ordinary (W-2) income if you actively participate and your MAGI is under $100k (phasing out to $0 by $150k); unused losses carry forward. On sale, claimed depreciation is recaptured at up to 25%, and gains may owe capital-gains tax (a 1031 exchange can defer both). Figures are a year-1 estimate at your 24.0% rate — not tax advice; consult a CPA.
Schools (NCES district)
- District
- Hemet Unified
- NCES district ID
- 0616920
- Math proficiency
- 19% ▼ -3.00%
- Reading proficiency
- 41% ▲ 4.00%
- Median HH income
- $39,962
- Composite
- 25.16/100
- National rank
- #7517
- State rank
- #360 of 517 in CA
Livability — Hemet
- Score
- 51/100
- State rank
- #1056
- US rank
- #25208
Category grades
Schools grade is shown separately in the Schools card above.
Census & demographics
- Census place
- Hemet, CA
- County
- Riverside County · 2,287,001 people
- City population
- 137,670
- Metro
- Riverside-San Bernardino-Ontario, CA
- Population (ZIP)
- 45,982
- Household income
- $63,770
- Rent vs Own
- Severe rent burden
- 1813.0
Population outlook (Riverside County) Hauer SSP2
- Today (2025)
- 2,664,475 people
- By 2030
- 2,802,692 · +5.2%
- By 2040
- 3,050,904 · +14.5%
- By 2050
- 3,256,783 · +22.2%
- By 2075
- 3,655,058 · +37.2%
- By 2100
- 3,766,594 · +41.4%
Race, ethnicity, and origin ACS 2023
- Neighborhood character
- Diverse neighborhood (Simpson 0.65)
- Race & ethnicity
- Hispanic / Latino 46% White 35% Two or more races 17% Black 8% Asian 5% Native American 1%
- Hispanic origin (detail)
- Mexican 40%
- Common ancestry
- Slovak 2% Lithuanian 2% Portuguese 1%
- Foreign-born
- 19% · Canada, Vietnam, Jamaica
- Languages at home
- 69% English-only · Spanish 27% Tagalog/Filipino 1% Other Indo-European 1%
Political lean MEDSL · Riverside
- 2024 margin
- Toss-up / Even · D 48.0% · R 49.3% · Other 2.6%
- 2008→2024 swing
- -3.6pp toward R · 2008: 2.3pp · 2024: -1.3pp
- All cycles
- 2024: R+1.3 2020: D+8.0 2016: D+4.3 2012: R+0.4 2008: D+2.3
Not yet ingested
- Civics
- —
Market trends
- HPI YoY
- ▼ -116.25%
- Current HPI
- 356.9414
- Rent YoY
- ▲ 3.74%
- Metro
- Riverside-San Bernardino-Ontario, CA
- State GDP YoY
- ▲ 3.21%
- F500 in state
- 116
Industry mix (Fortune 500 HQ in CA)
| Industry | F500 HQs | Revenue |
|---|---|---|
| Technology | 27 | $1,492B |
|
||
| Financial Services | 3 | $174B |
|
||
| Retail | 3 | $44B |
|
||
| Insurance | 3 | $26B |
|
||
| Media / Entertainment | 2 | $115B |
|
||
| Pharmaceuticals / Biotech | 2 | $62B |
|
||
Price history
+200.0% since first listed17 events — show timeline
- 2026-05-27 Listed $90,000 CRMLS
- 2024-12-28 Listing Removed — CRMLS
- 2024-12-13 Price Changed $40,000 CRMLS
- 2024-12-05 Price Changed $48,000 CRMLS
- 2024-12-01 Price Changed $58,000 CRMLS
- 2024-11-28 Price Changed $65,000 CRMLS
- 2024-11-20 Price Changed $80,000 CRMLS
- 2024-11-15 Price Changed $99,000 CRMLS
- 2024-11-06 Listed $105,000 CRMLS
- 2024-11-03 Listing Removed — CRMLS
- 2024-11-02 Price Changed $120,000 CRMLS
- 2024-10-23 Listed $139,000 CRMLS
- 2024-10-21 Coming Soon — CRMLS
- 2021-04-29 Sold (MLS) $30,000 CRMLS
- 2021-04-13 Pending — CRMLS
- 2021-04-13 Relisted — CRMLS
- 2021-03-30 Listed $30,000 CRMLS
Property tax history
-1.6%/yrLatest (2025): $193 · +2.0% YoY. Source: county tax records.
Cash-flow waterfall
monthlySold comps — $/sqft
last 12 mo · ≤1 miLoading sold comps…