21 Camellia Dr · Jackson, TN
Flood risk 1/10 · Minimal
- FEMA flood zone
- X (unshaded)
- Chance of flooding over 30 yrs
- 0.0%
- Est. flood insurance / yr
- $507 – $1,088
Fire risk 4/10 · Minor
- Est. fire insurance / yr
- $949 – $1,763
Heat risk 6/10 · Moderate
- Hot days now (above 108°F)
- 7 days/yr
- Hot days in 30 yrs
- 21 days/yr
Wind risk 4/10 · Minor
- Chance of severe wind over 30 yrs
- 16.0%
Air-quality risk 1/10 · Minimal
- Unhealthy air days now
- 0 days/yr
- Unhealthy air days in 30 yrs
- 0 days/yr
Risk factors via First Street. Map © Google.
Why this score? — see what drove the D+ grade
The composite is a weighted blend of 9 inputs, each scored 0–100. Each bar is that input's sub-score; the figure is the points it added to the 100-point composite (weight × sub-score).
- ARV discount +15.0/15.0
- Cash flow +14.7/30.0
- DSCR +4.5/10.0
- Rent growth +3.8/5.0
- 1% rule +3.3/10.0
- Livability +3.1/5.0
- Condition / age +2.5/5.0
- Schools +1.2/10.0
- Appreciation +0.0/10.0
$199,000
🖨 Deal sheet 📄 Offer letter ✓ Due diligence
Listing remarks
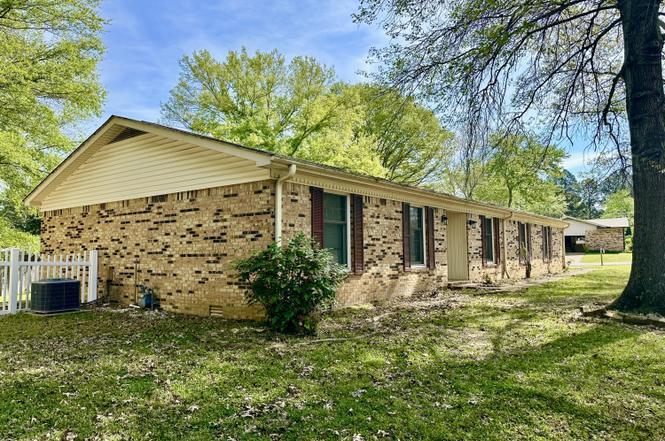
THIS NICE 4 BR 2 BA brick home in South Jackson off of Hart's Bridge Rd features a large living room and a den with a fireplace. Separated by a breakfast bar, the open kitchen contains stainless steel appliances and ample cabinetry. The covered patio and privacy fence allow for entertaining. A two-car garage, storage building and attic provide plenty of storage space. Call today to schedule an appointment. All information deemed accurate but is not warranted by the seller, company or REALTOR. This document is to be used for reference only and is not a valid part of the listing agreement between the buyer and seller. Square footage to be determined by appraiser.
Key facts
- Ample cabinetry
- Large living room
- Covered patio
Tags
Property features AI
Exterior
- Parking: Total of 6 parking spaces; Attached 2-car garage with side-facing garage door and garage door opener
- Utilities: Public water; Public sewer; Electric service; Natural gas for heating and water heater
- Home design: Single-family residence; One level / single-story; Raised foundation; Brick exterior; Shingle roof; Located on a city street (publicly maintained road) in the Southside Garden subdivision; Lot dimensions approximately 105 x 150.5
- Construction: Brick construction; Raised foundation; Shingle roof
- Exterior features: Covered patio/porch; Rain gutters; Back yard fencing; On-site storage structure
Interior
- Kitchen: Dishwasher; Electric range; Refrigerator; Exhaust fan
- Bedrooms: Four main-level bedrooms
- Flooring: Vinyl flooring
- Bathrooms: Two full bathrooms (both on the main level)
- Heating & cooling: Central heating (natural gas); Central air conditioning (electric); Ceiling fans
- Interior features: Ceiling fans throughout; Blinds and wood-framed windows; Gas log fireplace; Exhaust fan
- Laundry & utility: Laundry room with washer and electric dryer hookups; Gas water heater
Neighborhood map
What this means for you Summary
Snapshot
- This is a 4-bed/2.0-bath single-family listed at $199k.
Deal economics
- At list price, monthly cash flow is $52 ($626/yr) — positive.
- The deal already cash-flows at list — no discount required.
- To meet the 1% rule (rent ≥ 1% of price), the offer needs to be $165k (16.9% below list).
- Recommended offer: $165k (16.9% below list) — sets the bar for 1% rule.
- Cap rate 6.6% vs local median 3.5% in Jackson — top-decile yield for the area; either an underpriced asset or a hidden risk that comps aren't pricing in. Stress-test before assuming the spread holds.
Location & tenants
- Location reads 62/100 on livability (#216 in TN) — a middle-class / working-renter tenant base. Strengths: cost of living A+, housing A+; Watch: health & safety C-, schools F, crime F.
- Madison County (urban): math 10% / reading 17% proficiency, ranked #131 of 139 in TN (top 94%) — low school quality limits family demand, transient renter base, plan for 1-2y turnover; 68% free/reduced lunch — lower-income household profile, screen leases tightly.
- Market conditions: Rents rising fast (+5.2%/yr); 253 active listings in the ZIP; lower-income renter base — watch delinquency; 247 units permitted in Madison County in 2024 (0 in 5+ unit buildings).
- At $1,654/mo this rent would consume 46% of the median local household income ($43k/yr) (locally 1701% of renters already pay >50% of income on rent) — very limited rent-growth headroom before tenants either downsize or default.
Forward outlook
- Local home prices are declining (-3.0%/yr); year-one equity from $1k of loan paydown is wiped out by about $6k of value loss. Plan a longer hold.
- Madison County population projected at -12% by 2050 — secular population decline; favor cash flow + early exit over multi-decade hold.
Negotiation context
- It's been on market 141 days — a 12% lower offer ($175k) is reasonable based on typical stale-listing flexibility.
- Current owner paid $90k; list at $199k implies a 121% gain — meaningful room to come down on a strong offer.
Risks & watch-outs
- Climate carrying-cost: extreme-heat days projected 7→21/yr by 2055 (HVAC capex compounding) — expect insurance premiums to compound above CPI over the hold.
Questions for the listing agent
- It's been on market 141 days. Have you received any prior offers? Is the seller open to a 17% concession, seller financing, or rate buy-down credit?
- Built in 1970 — when were the roof, HVAC, electrical panel, plumbing, and water heater last replaced?
- Why hasn't it sold? Are there any deal-killer items the seller is aware of (foundation, flood, title, zoning, code violations)?
- Is there a deadline driving the sale (1031 exchange, divorce, estate, relocation)? That informs how much negotiation room exists.
- Schools are F-rated, which usually means shorter tenancies and higher turnover. Who's the typical renter profile here, and what's been the actual vacancy rate?
- Crime grade is F in this area — have there been break-ins, vandalism, or insurance claims at this property in the last 3 years? What carrier currently insures it and at what premium?
- The area grade is low — what's the realistic commute time and amenity access for the typical tenant pool here? Any planned neighborhood developments (good or bad) we should know about?
- What's the average days-on-market for RENTAL listings here right now (not sales)? A rising rental-DOM trend means longer vacancies and softer asking-rent achievability than the comps imply.
- What's the recent tenant-quality profile in this submarket — average credit score on applications, eviction rate, late-payment / NSF rate, and stable-employment percentage? A property-management company in the area should have these aggregated.
- How much new for-sale + rental construction is in the pipeline within 1–3 miles? Heavy new supply typically softens prices + rents 12–24 months out; constrained supply supports both.
Investment metrics
- 1% rule
- 0.83% ✗
- Cap rate
- 6.61%
- Cash-on-cash
- 1.12%
- DSCR
- 1.05
- GRM
- 10.0
CMA / ARV
- ARV (on-the-fly)
- $272,072
- Comps found
- 10
Show comp detail 10 sales within ~0.75 mi
| Address | Dist | Beds/Ba | Sqft | Sold | Price | $/sf | Match |
|---|---|---|---|---|---|---|---|
| 46 Brenda Ln | 0.11mi | 4/2.0 | 1,819 (-5%) | 4mo | $249,900 | $137 | 83 |
| 74 Brenda Ln | 0.12mi | 4/2.0 | 1,764 (-8%) | 16mo | $270,000 | $153 | 68 |
| 66 Brenda Ln | 0.11mi | 4/2.0 | 2,198 (+15%) | 9mo | $230,000 | $105 | 63 |
| 260 Harts Bridge Rd | 0.47mi | 3/2.5 (-1) | 1,799 (-6%) | 1mo | $282,900 | $157 | 60 |
| 23 Penny Cv | 0.22mi | 4/1.5 | 1,652 (-14%) | 6mo | $208,000 | $126 | 59 |
| 61 Scottland Dr | 0.35mi | 4/3.0 | 2,128 (+11%) | 11mo | $195,800 | $92 | 52 |
| 475 Harts Bridge Rd | 0.58mi | 3/2.0 (-1) | 1,760 (-8%) | 24mo | $249,900 | $142 | 35 |
| 32 Lake Cv | 0.73mi | 3/2.5 (-1) | 2,035 (+6%) | 20mo | $337,500 | $166 | 32 |
| 106 Old Pinson Rd | 0.50mi | 3/1.5 (-1) | 1,669 (-13%) | 20mo | $247,000 | $148 | 31 |
| 520 Chester Levee Rd | 0.74mi | 3/2.0 (-1) | 1,714 (-10%) | 20mo | $170,000 | $99 | 27 |
Match score weights: distance 35% · size 25% · config 20% · recency 20%. Top-matched comps best support the ARV.
Projected returns pro-forma
-3.0% appreciation · 5.19% rent growth · sell at horizon
- IRR
- -12.3%
- Equity multiple
- 0.55×
- Total profit
- $-25,248
- Equity at exit
- $29,672
- IRR
- -0.5%
- Equity multiple
- 0.97×
- Total profit
- $-1,923
- Equity at exit
- $17,206
Cash invested: $55,720 (down + closing). Projections, not guarantees.
Landlord ↔ Tenant lean methodology
- Overall (STATE)
- 87 Strongly Landlord-Friendly
- State Tennessee
- 87 Strongly Landlord-Friendly · R+13
- County
- — inherits STATE
- City
- — inherits STATE
ZIP-level market 38301
- Rents YoY
- 5.2%
- Active inventory
- 253
- Price-to-rent
- 10.0×
Monthly cashflow live
- Estimated rent
- $1,654 medium interval (Pro) →
- Mortgage (P&I)
- −$1,044
- Tax from tax record
- −$128 /mo · $1,537/yr
- Insurance
- −$83
- HOA
- −$0
- Vacancy / Maint / Mgmt
- −$347
- Net cashflow
- $52
Break-even live
UW: 25.0% down · 7.5% · 30yr · 1.5% tax · 5.0% vac · 8.0% maint · 8.0% mgmt
Financing live
Cash to close
- Down payment
- $49,750
- Closing costs
- $5,970
- Reserves months
- —
- Total cash needed
- —
Loan-product check · same deal, 3 products live
Conventional
25% down · 7.5% · 30yr
- Down + closing
- —
- Monthly P&I
- —
- Monthly cashflow
- —
- DSCR
- —
- Eligible?
- —
Personal DTI + credit; lowest rate.
DSCR
20% down · 8.5% · 30yr
- Down + closing
- —
- Monthly P&I
- —
- Monthly cashflow
- —
- DSCR
- —
- Eligible?
- —
No personal income docs; deal must DSCR.
Hard money
10% down · 12.0% · 12mo
- Down + closing
- —
- Monthly P&I
- —
- Monthly cashflow
- —
- DSCR
- —
- Eligible?
- —
Short-term bridge; refi at stabilization.
Listing history 15 events
-
2026-06-07statusdays on market $199,000 Pending 141 DOM
-
2026-06-05days on market $199,000 Active 140 DOM
-
2026-06-03days on market $199,000 Active 139 DOM
-
2026-06-02days on market $199,000 Active 138 DOM
-
2026-06-01days on market $199,000 Active 137 DOM
-
2026-05-31days on market $199,000 Active 136 DOM
-
2026-05-30days on market $199,000 Active 135 DOM
-
2026-05-01price $224,900
-
2026-04-10price $229,900
-
2026-03-13price $239,000
-
2026-01-14$250,000 Active
-
2025-11-19price $264,900
-
2025-08-19price $279,900
-
2025-07-18price $284,900
-
2021-04-12soldstatus $90,000
ⓘ Source: listings_history table (triggers on properties + properties_extension) + one-shot
backfill from property_details.listing_events for pre-trigger history.
Tax reassessment forecast TN · Resets to sale price
- Current annual tax
- $1,537 · $128/mo
- Projected year-2 tax
- $1,537 · $128/mo
- Expected delta
- $0/yr ($0/mo · 0.0%)
ⓘ Screening estimate from a state-policy table — verify with the county assessor before closing.
Climate risk First Street
- Flood 1/10 Low FEMA zone X (unshaded) · 0% chance over 30 yrs
- Wildfire 4/10 Moderate
- Heat 6/10 Major 7 d/yr ≥108°F today · 21 d/yr by 30 yrs out
- Wind 4/10 Moderate 16% chance of damaging wind over 30 yrs
- Air quality 1/10 Low 0 unhealthy d/yr today · 0 by 30 yrs out
Nearby sold comps map
Loading sold comps map…
Walkable amenities ~0.75 mi
Loading nearby amenities…
Taxation est. · year 1
- Rental income
- $19,849
- − Mortgage interest
- −$11,147
- − Property taxes
- −$1,537
- − Insurance
- −$995
- − Repairs & maintenance
- −$1,588
- − Management
- −$1,588
- − Depreciation
- −$5,789
- Taxable loss
- −$2,795
- Est. tax savings @ 24.0%
- +$671
- After-tax cash flow
- $1,297/yr
For passive investors: Depreciation is non-cash, so a rental often shows a tax loss while cash-flowing — sheltering income. Rental losses are passive: they offset passive income freely, and up to $25,000/yr can offset ordinary (W-2) income if you actively participate and your MAGI is under $100k (phasing out to $0 by $150k); unused losses carry forward. On sale, claimed depreciation is recaptured at up to 25%, and gains may owe capital-gains tax (a 1031 exchange can defer both). Figures are a year-1 estimate at your 24.0% rate — not tax advice; consult a CPA.
Schools (NCES district)
- District
- Madison County
- NCES district ID
- 4702580
- Math proficiency
- 10% ▼ -11.00%
- Reading proficiency
- 17% ▼ -4.00%
- Median HH income
- $42,015
- Composite
- 11.74/100
- National rank
- #9687
- State rank
- #131 of 139 in TN
Livability — Jackson
- Score
- 62/100
- State rank
- #216
- US rank
- #16488
Category grades
Schools grade is shown separately in the Schools card above.
Census & demographics
- Census place
- Jackson, TN
- County
- Madison County · 87,024 people
- City population
- 87,024
- Metro
- Jackson, TN
- Population (ZIP)
- 33,536
- Household income
- $43,227
- Rent vs Own
- Severe rent burden
- 1701.0
Population outlook (Madison County) Hauer SSP2
- Today (2025)
- 95,952 people
- By 2030
- 94,264 · -1.8%
- By 2040
- 89,607 · -6.6%
- By 2050
- 84,133 · -12.3%
- By 2075
- 72,215 · -24.7%
- By 2100
- 62,062 · -35.3%
Race, ethnicity, and origin ACS 2023
- Neighborhood character
- Diverse neighborhood (Simpson 0.57)
- Race & ethnicity
- Black 50% White 42% Two or more races 5% Hispanic / Latino 4%
- Common ancestry
- Slovak 1% Serbian 1% Portuguese 1%
- Foreign-born
- 3% · Canada
- Languages at home
- 96% English-only · Spanish 3%
Political lean MEDSL · Madison
- 2024 margin
- R (+18.2) · D 40.3% · R 58.5% · Other 1.2%
- 2008→2024 swing
- +3.4pp toward D · 2008: -21.6pp · 2024: -18.2pp
- All cycles
- 2024: R+18.2 2020: R+12.9 2016: R+15.6 2012: R+8.9 2008: R+21.6
Not yet ingested
- Civics
- —
Market trends
- HPI YoY
- ▼ -112.26%
- Current HPI
- 162.2273
- Rent YoY
- ▲ 5.19%
- Metro
- Jackson, TN
- State GDP YoY
- ▲ 2.78%
- F500 in state
- 22
Industry mix (Fortune 500 HQ in TN)
| Industry | F500 HQs | Revenue |
|---|---|---|
| Healthcare | 3 | $91B |
|
||
| Retail | 3 | $72B |
|
||
| Transportation / Logistics | 1 | $88B |
|
||
| Paper / Packaging | 1 | $19B |
|
||
| Insurance | 1 | $13B |
|
||
| Energy | 1 | $12B |
|
||
Price history
+149.9% since first listed8 events — show timeline
- 2026-05-01 Price Changed $224,900 CWTAR
- 2026-04-10 Price Changed $229,900 CWTAR
- 2026-03-13 Price Changed $239,000 CWTAR
- 2026-01-14 Listed $250,000 CWTAR
- 2025-11-19 Price Changed $264,900 CWTAR
- 2025-08-19 Price Changed $279,900 CWTAR
- 2025-07-18 Price Changed $284,900 CWTAR
- 2021-04-12 Sold (Public Records) $90,000 Public Records
Property tax history
+5.4%/yrLatest (2025): $1,537 · +0.0% YoY. Source: county tax records.
Cash-flow waterfall
monthlySold comps — $/sqft
last 12 mo · ≤1 miLoading sold comps…