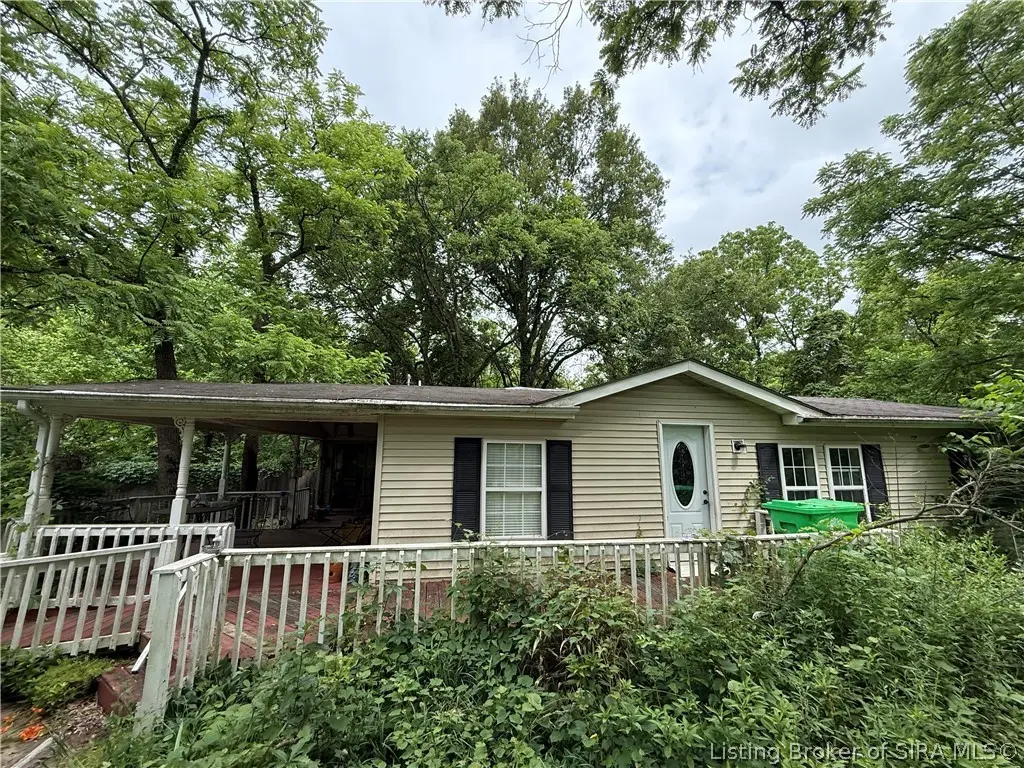
9085 Cedar Ln NE · New Salisbury, IN
Flood risk 1/10 · Minimal
- FEMA flood zone
- X (unshaded)
- Chance of flooding over 30 yrs
- 0.0%
- Est. flood insurance / yr
- $507 – $1,088
Fire risk 1/10 · Minimal
- Est. fire insurance / yr
- $717 – $1,331
Heat risk 4/10 · Minor
- Hot days now (above 104°F)
- 7 days/yr
- Hot days in 30 yrs
- 19 days/yr
Wind risk 2/10 · Minimal
- Chance of severe wind over 30 yrs
- 1.0%
Air-quality risk 2/10 · Minimal
- Unhealthy air days now
- 1 days/yr
- Unhealthy air days in 30 yrs
- 1 days/yr
Risk factors via First Street. Map © Google.
Why this score? — see what drove the B- grade
The composite is a weighted blend of 9 inputs, each scored 0–100. Each bar is that input's sub-score; the figure is the points it added to the 100-point composite (weight × sub-score).
- Cash flow +30.0/30.0
- 1% rule +10.0/10.0
- DSCR +10.0/10.0
- ARV discount +7.5/15.0
- Schools +3.7/10.0
- Livability +2.8/5.0
- Rent growth +2.5/5.0
- Condition / age +2.5/5.0
- Appreciation +0.0/10.0
$99,900
🖨 Deal sheet 📄 Offer letter ✓ Due diligence
Listing remarks
Escape the hustle and bustle! Nestled on a gorgeous, sprawling 7-acre lot, this property offers ultimate peace, quiet, and privacy. The grounds feature a beautiful, expansive yard with plenty of room to roam, garden, or expand. The existing 3-bedroom, 2-bath manufactured home requires a complete renovation, giving you the unique opportunity to customize your dream country escape from top to bottom. (Sellers will remove all personal contents before closing). A spectacular, solid garage that is in excellent shape and ready for your projects, hobbies, or recreational vehicles. Cash-only, AS-IS sale. If you've been searching for acreage, privacy, and a project with massive upside, this is the o
Key facts
- Expansive yard
- Complete renovation
- 7 acre lot
Tags
Property features AI
Finance
- Other: Zoned Agri/Residential
Exterior
- Parking: Detached garage facing front; 2-car garage
- Utilities: Public water connected; Septic tank
- Home design: Double wide mobile home; Single-story; Shingle roof; Vinyl siding; Above-grade living space present
- Construction: Built with vinyl siding; Shingle roof; Double wide body type
- Exterior features: Deck; Covered porch; Porch; Handicap accessible; Pole barn; Shed(s); Has a view; Located on a dead-end road; Road access is paved and gravel
Interior
- Kitchen: Dishwasher; Disposal; Microwave; Oven; Range; Water softener
- Bathrooms: 2 full bathrooms
- Heating & cooling: Heat pump heating; Central air conditioning
- Interior features: Main level primary suite; Split bedroom floorplan; Utility room; Walk-in closet(s); Family room
- Laundry & utility: Laundry closet on the main level
Neighborhood map
What this means for you Summary
Snapshot
- This is a 3-bed/2.0-bath single-family listed at $100k.
Deal economics
- At list price, monthly cash flow is $884 ($11k/yr) — positive.
- The deal already cash-flows at list — no discount required.
- Meets the 1% rule at list price ($2k rent vs $100k).
- Cap rate 16.9% vs local median 4.7% in New Salisbury — top-decile yield for the area; either an underpriced asset or a hidden risk that comps aren't pricing in. Stress-test before assuming the spread holds.
Location & tenants
- Location reads 56/100 on livability (#624 in IN) — a working-class tenant base; expect higher turnover. Strengths: cost of living A+; Watch: schools D, amenities F, commute F.
- North Harrison Community School Corporation (rural): math 40% / reading 46% proficiency, ranked #110 of 301 in IN (top 36%) — families likely to look elsewhere, expect single-tenant / working-renter base with shorter leases.
- Market conditions: 44 active listings in the ZIP; 2 comparable units currently listed for rent nearby; 158 units permitted in Harrison County in 2024 (0 in 5+ unit buildings).
Forward outlook
- Local home prices are declining (-3.0%/yr); year-one equity from $691 of loan paydown is wiped out by about $3k of value loss. Plan a longer hold.
- Harrison County population projected to shrink 6% by 2050 — rents likely to lag national; underwrite the cash flow, not the appreciation.
- At projected returns (-3.0% appreciation + 3.0% rent growth), your $28k cash investment doubles in ~4 years — after that, you're playing with house money.
Negotiation context
- Only 1 days on market — expect competitive offers; lowballing is unlikely to land.
Risks & watch-outs
- Watch-outs: built in 1885 — expect roof / HVAC / electrical / plumbing capex.
Questions for the listing agent
- Built in 1885 — when were the roof, HVAC, electrical panel, plumbing, and water heater last replaced?
- Is there a deadline driving the sale (1031 exchange, divorce, estate, relocation)? That informs how much negotiation room exists.
- Schools are D-rated, which usually means shorter tenancies and higher turnover. Who's the typical renter profile here, and what's been the actual vacancy rate?
- What's the average days-on-market for RENTAL listings here right now (not sales)? A rising rental-DOM trend means longer vacancies and softer asking-rent achievability than the comps imply.
- What's the recent tenant-quality profile in this submarket — average credit score on applications, eviction rate, late-payment / NSF rate, and stable-employment percentage? A property-management company in the area should have these aggregated.
- How much new for-sale + rental construction is in the pipeline within 1–3 miles? Heavy new supply typically softens prices + rents 12–24 months out; constrained supply supports both.
Investment metrics
- 1% rule
- 1.90% ✓
- Cap rate
- 16.91%
- Cash-on-cash
- 37.92%
- DSCR
- 2.69
- GRM
- 4.4
CMA / ARV
- ARV (on-the-fly)
- $250,344
- Comps found
- 1
Show comp detail 1 sale within ~0.75 mi
| Address | Dist | Beds/Ba | Sqft | Sold | Price | $/sf | Match |
|---|---|---|---|---|---|---|---|
| 9255 Highway 135 NE | 0.66mi | 3/2.0 | 1,344 (-8%) | 13mo | $230,000 | $171 | 45 |
Match score weights: distance 35% · size 25% · config 20% · recency 20%. Top-matched comps best support the ARV.
Projected returns pro-forma
-3.0% appreciation · 3.0% rent growth · sell at horizon
- IRR
- 33.9%
- Equity multiple
- 2.43×
- Total profit
- $40,099
- Equity at exit
- $14,895
- IRR
- 40.8%
- Equity multiple
- 4.84×
- Total profit
- $107,349
- Equity at exit
- $8,638
Cash invested: $27,972 (down + closing). Projections, not guarantees.
Landlord ↔ Tenant lean methodology
- Overall (STATE)
- 90 Strongly Landlord-Friendly
- State Indiana
- 90 Strongly Landlord-Friendly · R+11
- County
- — inherits STATE
- City
- — inherits STATE
ZIP-level market 47161
- Home prices YoY
- -10.5%
- Active inventory
- 44
- Price-to-rent
- 4.4×
Monthly cashflow live
- Estimated rent
- $1,899 medium interval (Pro) →
- Mortgage (P&I)
- −$524
- Tax from tax record
- −$51 /mo · $608/yr
- Insurance
- −$42
- HOA
- −$0
- Vacancy / Maint / Mgmt
- −$399
- Net cashflow
- $884
Break-even live
UW: 25.0% down · 7.5% · 30yr · 1.5% tax · 5.0% vac · 8.0% maint · 8.0% mgmt
Financing live
Cash to close
- Down payment
- $24,975
- Closing costs
- $2,997
- Reserves months
- —
- Total cash needed
- —
Loan-product check · same deal, 3 products live
Conventional
25% down · 7.5% · 30yr
- Down + closing
- —
- Monthly P&I
- —
- Monthly cashflow
- —
- DSCR
- —
- Eligible?
- —
Personal DTI + credit; lowest rate.
DSCR
20% down · 8.5% · 30yr
- Down + closing
- —
- Monthly P&I
- —
- Monthly cashflow
- —
- DSCR
- —
- Eligible?
- —
No personal income docs; deal must DSCR.
Hard money
10% down · 12.0% · 12mo
- Down + closing
- —
- Monthly P&I
- —
- Monthly cashflow
- —
- DSCR
- —
- Eligible?
- —
Short-term bridge; refi at stabilization.
Rent comps 2 comps
| Address | Beds | Baths | Sqft | Rent | $/sqft | DOM | Units | Dist |
|---|---|---|---|---|---|---|---|---|
| 8206 Wagner Ave NE New Salisbury, IN | 3.0 | 2.0 | 1383 | $1,899 | $1.37 | 23d | 1 | 1.39mi |
| 8206 Wagner Ave NE New Salisbury, IN | 3.0 | 2.0 | 1385 | $1,899 | $1.37 | 14d | 1 | 1.39mi |
Listing history 2 events
-
2026-06-09remarks 699-char remark
-
2026-06-09$99,900 Active 1 DOM
ⓘ Source: listings_history table (triggers on properties + properties_extension) + one-shot
backfill from property_details.listing_events for pre-trigger history.
Tax reassessment forecast IN · Partial reset (capped growth)
- Current annual tax
- $608 · $51/mo
- Projected year-2 tax
- $729 · $61/mo
- Expected delta
- +$121/yr (+$10/mo · 19.8%)
ⓘ Screening estimate from a state-policy table — verify with the county assessor before closing.
Climate risk First Street
- Flood 1/10 Low FEMA zone X (unshaded) · 0% chance over 30 yrs
- Wildfire 1/10 Low
- Heat 4/10 Moderate 7 d/yr ≥104°F today · 19 d/yr by 30 yrs out
- Wind 2/10 Low 100% chance of damaging wind over 30 yrs
- Air quality 2/10 Low 1 unhealthy d/yr today · 1 by 30 yrs out
Nearby sold comps map
Loading sold comps map…
Walkable amenities ~0.75 mi
Loading nearby amenities…
Taxation est. · year 1
- Rental income
- $22,788
- − Mortgage interest
- −$5,596
- − Property taxes
- −$608
- − Insurance
- −$500
- − Repairs & maintenance
- −$1,823
- − Management
- −$1,823
- − Depreciation
- −$2,906
- Taxable income
- $9,532
- Est. tax owed @ 24.0%
- −$2,288
- After-tax cash flow
- $8,321/yr
For passive investors: Depreciation is non-cash, so a rental often shows a tax loss while cash-flowing — sheltering income. Rental losses are passive: they offset passive income freely, and up to $25,000/yr can offset ordinary (W-2) income if you actively participate and your MAGI is under $100k (phasing out to $0 by $150k); unused losses carry forward. On sale, claimed depreciation is recaptured at up to 25%, and gains may owe capital-gains tax (a 1031 exchange can defer both). Figures are a year-1 estimate at your 24.0% rate — not tax advice; consult a CPA.
Schools (NCES district)
- District
- North Harrison Community School Corporation
- NCES district ID
- 1800690
- Math proficiency
- 40% ▼ -16.00%
- Reading proficiency
- 46% ▼ -13.00%
- Median HH income
- $51,643
- Composite
- 37.12/100
- National rank
- #4493
- State rank
- #110 of 301 in IN
Livability — New Salisbury
- Score
- 56/100
- State rank
- #624
- US rank
- #23062
Category grades
Schools grade is shown separately in the Schools card above.
Census & demographics
- City population
- 3,362
- Population (ZIP)
- 3,362
Population outlook (Harrison County) Hauer SSP2
- Today (2025)
- 40,288 people
- By 2030
- 40,265 · -0.1%
- By 2040
- 39,538 · -1.9%
- By 2050
- 37,781 · -6.2%
- By 2075
- 33,200 · -17.6%
- By 2100
- 26,668 · -33.8%
Race, ethnicity, and origin ACS 2023
- Neighborhood character
- Predominantly White (100%)
- Race & ethnicity
- White 100%
- Common ancestry
- Portuguese 2% Lithuanian 2% Italian 2%
- Foreign-born
- 0%
Political lean MEDSL · Harrison
- 2024 margin
- Solid R (+47.0) · D 25.6% · R 72.5% · Other 1.8%
- 2008→2024 swing
- -28.9pp toward R · 2008: -18.0pp · 2024: -47.0pp
- All cycles
- 2024: R+47.0 2020: R+45.6 2016: R+44.4 2012: R+22.8 2008: R+18.0
Not yet ingested
- Civics
- —
Market trends
- HPI YoY
- ▼ -25.82%
- Current HPI
- 221.0899
- Rent YoY
- —
- Metro
- —
- State GDP YoY
- ▲ 2.90%
- F500 in state
- 18
Industry mix (Fortune 500 HQ in IN)
| Industry | F500 HQs | Revenue |
|---|---|---|
| Industrial Machinery | 2 | $37B |
|
||
| Healthcare | 1 | $177B |
|
||
| Pharmaceuticals | 1 | $45B |
|
||
| Metals / Steel | 1 | $18B |
|
||
| Agriculture | 1 | $17B |
|
||
| Packaging | 1 | $12B |
|
||
Price history
1 event — show timeline
- 2026-06-08 Listed $99,900 SIRA
Property tax history
+9.3%/yrLatest (2024): $608 · +11.4% YoY. Source: county tax records.
Cash-flow waterfall
monthlySold comps — $/sqft
last 12 mo · ≤1 miLoading sold comps…