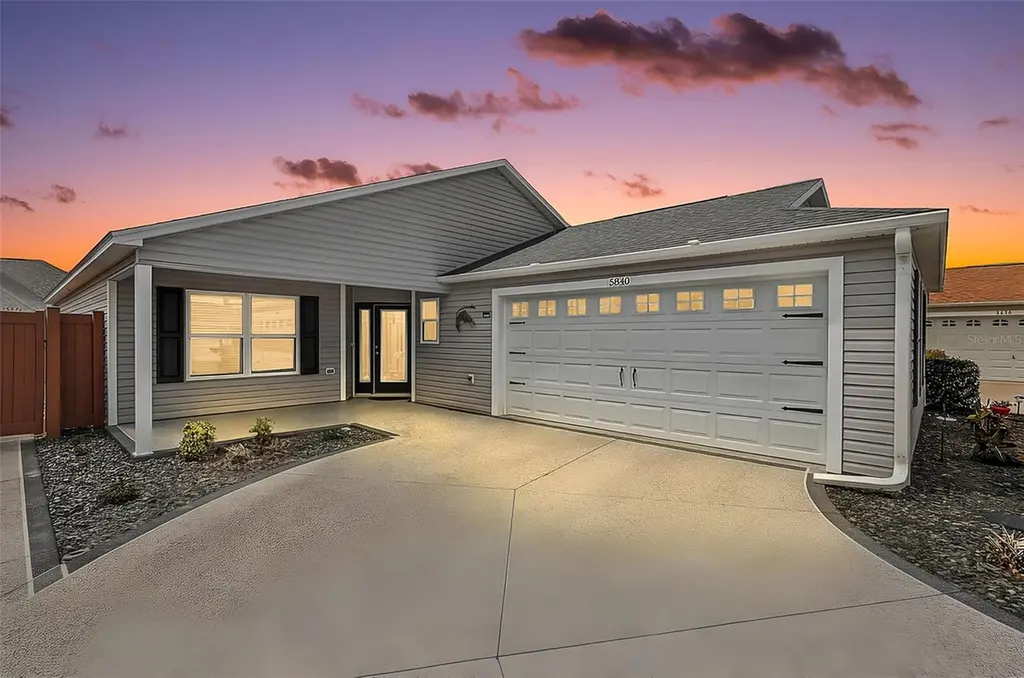
5840 Unger Ct · Wildwood, FL
Flood risk 1/10 · Minimal
- FEMA flood zone
- X (unshaded)
- Chance of flooding over 30 yrs
- 0.0%
- Est. flood insurance / yr
- $507 – $1,088
Fire risk 4/10 · Minor
- Est. fire insurance / yr
- $947 – $1,759
Heat risk 9/10 · Severe
- Hot days now (above 108°F)
- 7 days/yr
- Hot days in 30 yrs
- 23 days/yr
Wind risk 9/10 · Severe
- Chance of severe wind over 30 yrs
- 99.0%
Air-quality risk 2/10 · Minimal
- Unhealthy air days now
- 1 days/yr
- Unhealthy air days in 30 yrs
- 2 days/yr
Risk factors via First Street. Map © Google.
Why this score? — see what drove the C grade
The composite is a weighted blend of 9 inputs, each scored 0–100. Each bar is that input's sub-score; the figure is the points it added to the 100-point composite (weight × sub-score).
- Cash flow +13.8/30.0
- ARV discount +12.1/15.0
- Appreciation +10.0/10.0
- Schools +5.2/10.0
- DSCR +4.2/10.0
- Livability +3.5/5.0
- 1% rule +3.4/10.0
- Rent growth +2.5/5.0
- Condition / age +2.5/5.0
$414,900
🖨 Deal sheet 📄 Offer letter ✓ Due diligence
Listing remarks
Virtually Staged. This STUNNING, PRIVATE 3/2 Melrose Courtyard Villa with 24’x20’ FULL TWO-CAR GARAGE and LOW-MAINTENANCE STONED LANDSCAPING in the contemporary village of DeSoto is the essence of MODERN comfort and style! JUST MINUTES to BROWNWOOD and the new EASTPORT TOWN SQUARE! DECORATIVELY PAINTED drive and walkway, CHARMING front porch, and entry with CONTEMPORARY LEADED-GLASS side-lite welcome you into this INCREDIBLE villa. The SPECTACULAR, EXPANSIVE kitchen is a chef’s dream boasting gorgeous STAGGERED LIGHT GRAY shaker cabinetry, QUARTZ countertops, TILE backsplash, STAINLESS appliances with GAS cooking, CENTER ISLAND, DOUBLE built-in PANTRY with PULL-OUTS, UNDER
Key facts
- Quartz countertops
- Full two-car garage
- Expansive kitchen
Tags
Property features AI
Finance
- Other: Other annual assessment approximately $841; Furnished: negotiable
- Financial info: CDD present; Lease restrictions apply
- HOA & community: Association amenities: pool, recreational facilities, tennis courts, pickleball courts, shuffleboard, playground, trails, dog park, community mailbox, sidewalks; Golf course and golf carts allowed in community; Deed restrictions and special community restrictions; Vehicle restrictions; Senior community; Pets allowed; Total monthly association fees approximately $204 (total annual fees approximately $2,448); Association fee includes pool and recreational facilities
Exterior
- Parking: Attached 2-car garage (24 x 20); Driveway; Garage door opener; Garage faces side; Golf cart parking; Ground level parking
- Utilities: Public water; Public sewer; Electricity connected; Natural gas connected
- Home design: Residential villa; One story; Faces east; Builder model: MELROSE
- Construction: Vinyl siding over frame construction; Shingle roof; Slab foundation; Built by builder (living area source: Builder)
- Exterior features: Front porch; Rear screened porch; Sliding doors; Masonry and vinyl fencing; Landscaped yard; Near golf course; Private lot; Paved access
Interior
- Kitchen: Dishwasher; Range; Microwave; Refrigerator; Solid surface counters; Eat-in kitchen
- Bedrooms: 3 bedrooms
- Flooring: Tile
- Bathrooms: 2 full bathrooms
- Heating & cooling: Central heating; Central air conditioning
- Interior features: Ceiling fans; Crown molding; Eat-in kitchen; High ceilings; Living room/dining room combo; Open floorplan; Solid surface counters; Split bedroom design; Vaulted ceilings; Walk-in closets
- Laundry & utility: Washer; Dryer; Inside laundry room
Neighborhood map
What this means for you Summary
Snapshot
- This is a 3-bed/2.0-bath single-family listed at $415k.
Deal economics
- At list price, monthly cash flow is $36 ($437/yr) — positive.
- The deal already cash-flows at list — no discount required.
- To meet the 1% rule (rent ≥ 1% of price), the offer needs to be $348k (16.1% below list).
- Recommended offer: $348k (16.1% below list) — sets the bar for 1% rule.
- Cap rate 6.4% vs local median 3.9% in Wildwood — top-decile yield for the area; either an underpriced asset or a hidden risk that comps aren't pricing in. Stress-test before assuming the spread holds.
Location & tenants
- Location reads 69/100 on livability (#471 in FL) — a middle-class / working-renter tenant base. Strengths: health & safety A+, cost of living A, crime A-; Watch: schools C-, amenities F, commute F.
- Sumter (rural): math 61% / reading 61% proficiency, ranked #11 of 73 in FL (top 15%) — acceptable for families but not a draw, mixed tenant base, ~2y average lease.
- Market conditions: 265 active listings in the ZIP; 3 comparable units currently listed for rent nearby; rentals at typical pace (median 21d on market — plan ~3-4 weeks tenant-placement turnaround); solid renter incomes; 3,961 units permitted in Sumter County in 2024 (248 in 5+ unit buildings).
- This rent runs 43% of the median local income ($97k/yr) — at the standard rent-burdened threshold; future hikes will face affordability resistance.
Forward outlook
- In year one you build about $44k of equity ($3k loan paydown + $41k appreciation (10.0% local appreciation)).
- Sumter County population projected at +45% by 2050 — long-run rental-demand tailwind backs the buy-and-hold thesis.
- At projected returns (10.0% appreciation + 3.0% rent growth), your $116k cash investment doubles in ~3 years — after that, you're playing with house money.
- By year 2, paydown + projected appreciation supports a ~$71k cash-out refi (75% LTV) — recoverable capital for the next deal without selling this one.
Negotiation context
- It's been on market 64 days — a 6% lower offer ($390k) is reasonable based on typical stale-listing flexibility.
- 2 sale attempts with the ask held roughly flat each time — persistent listings suggest the price (not the market) is what's stuck; bring a comps-based counter.
Risks & watch-outs
- Climate carrying-cost: severe wind risk, 99% chance of damaging wind over 30y; extreme-heat days projected 7→23/yr by 2055 (HVAC capex compounding) — expect insurance premiums to compound above CPI over the hold.
Questions for the listing agent
- It's been on market 64 days. Have you received any prior offers? Is the seller open to a 16% concession, seller financing, or rate buy-down credit?
- What does the HOA fee cover, when was the last increase, and are there any pending special assessments or reserve-fund shortfalls?
- Why hasn't it sold? Are there any deal-killer items the seller is aware of (foundation, flood, title, zoning, code violations)?
- Is there a deadline driving the sale (1031 exchange, divorce, estate, relocation)? That informs how much negotiation room exists.
- What's the average days-on-market for RENTAL listings here right now (not sales)? A rising rental-DOM trend means longer vacancies and softer asking-rent achievability than the comps imply.
- What's the recent tenant-quality profile in this submarket — average credit score on applications, eviction rate, late-payment / NSF rate, and stable-employment percentage? A property-management company in the area should have these aggregated.
- How much new for-sale + rental construction is in the pipeline within 1–3 miles? Heavy new supply typically softens prices + rents 12–24 months out; constrained supply supports both.
Investment metrics
- 1% rule
- 0.84% ✗
- Cap rate
- 6.40%
- Cash-on-cash
- 0.38%
- DSCR
- 1.02
- GRM
- 9.9
CMA / ARV
- ARV (on-the-fly)
- $462,000
- Comps found
- 12
Show comp detail 12 sales within ~0.75 mi
| Address | Dist | Beds/Ba | Sqft | Sold | Price | $/sf | Match |
|---|---|---|---|---|---|---|---|
| 5511 Head Way | 0.47mi | 3/2.0 | 1,708 (+2%) | 1mo | $390,000 | $228 | 75 |
| 2184 Locklin Ln | 0.46mi | 3/2.0 | 1,673 (-0%) | 14mo | $465,000 | $278 | 66 |
| 2188 Gordon Path | 0.41mi | 3/2.0 | 1,539 (-8%) | 8mo | $390,000 | $253 | 61 |
| 2155 Schulz Way | 0.49mi | 3/2.0 | 1,743 (+4%) | 18mo | $480,000 | $275 | 56 |
| 2160 Biller Cir | 0.59mi | 3/2.0 | 1,791 (+7%) | 7mo | $455,000 | $254 | 55 |
| 2530 Cainsworth Pl | 0.22mi | 3/2.0 | 1,896 (+13%) | 19mo | $660,000 | $348 | 53 |
| 2170 Biller Cir | 0.56mi | 3/2.0 | 1,539 (-8%) | 12mo | $403,000 | $262 | 50 |
| 2061 Biller Cir | 0.52mi | 3/2.0 | 1,459 (-13%) | 10mo | $322,000 | $221 | 46 |
| 5681 Henry Loop | 0.70mi | 3/2.0 | 1,914 (+14%) | 0mo | $589,000 | $308 | 44 |
| 5409 Samuel St | 0.75mi | 3/2.0 | 1,806 (+8%) | 14mo | $579,000 | $321 | 41 |
| 1968 Stella St | 0.75mi | 3/2.0 | 1,918 (+14%) | 1mo | $505,000 | $263 | 41 |
| 5446 Alfredson Ter | 0.66mi | 3/2.0 | 1,918 (+14%) | 6mo | $570,000 | $297 | 41 |
Match score weights: distance 35% · size 25% · config 20% · recency 20%. Top-matched comps best support the ARV.
Projected returns pro-forma
10.0% appreciation · 3.0% rent growth · sell at horizon
- IRR
- 24.5%
- Equity multiple
- 2.96×
- Total profit
- $228,246
- Equity at exit
- $373,775
- IRR
- 21.7%
- Equity multiple
- 6.77×
- Total profit
- $670,239
- Equity at exit
- $806,059
Cash invested: $116,172 (down + closing). Projections, not guarantees.
Landlord ↔ Tenant lean methodology
- Overall (STATE)
- 87 Strongly Landlord-Friendly
- State Florida
- 87 Strongly Landlord-Friendly · R+3
- County
- — inherits STATE
- City
- — inherits STATE
ZIP-level market 32163
- Home prices YoY
- 9.8%
- Active inventory
- 265
- Price-to-rent
- 9.9×
Monthly cashflow live
- Estimated rent
- $3,482 medium interval (Pro) →
- Mortgage (P&I)
- −$2,176
- Tax from tax record
- −$162 /mo · $1,943/yr
- Insurance
- −$173
- HOA
- −$204
- Vacancy / Maint / Mgmt
- −$731
- Net cashflow
- $36
Break-even live
UW: 25.0% down · 7.5% · 30yr · 1.5% tax · 5.0% vac · 8.0% maint · 8.0% mgmt
Financing live
Cash to close
- Down payment
- $103,725
- Closing costs
- $12,447
- Reserves months
- —
- Total cash needed
- —
Loan-product check · same deal, 3 products live
Conventional
25% down · 7.5% · 30yr
- Down + closing
- —
- Monthly P&I
- —
- Monthly cashflow
- —
- DSCR
- —
- Eligible?
- —
Personal DTI + credit; lowest rate.
DSCR
20% down · 8.5% · 30yr
- Down + closing
- —
- Monthly P&I
- —
- Monthly cashflow
- —
- DSCR
- —
- Eligible?
- —
No personal income docs; deal must DSCR.
Hard money
10% down · 12.0% · 12mo
- Down + closing
- —
- Monthly P&I
- —
- Monthly cashflow
- —
- DSCR
- —
- Eligible?
- —
Short-term bridge; refi at stabilization.
Rent comps 3 comps
| Address | Beds | Baths | Sqft | Rent | $/sqft | DOM | Units | Dist |
|---|---|---|---|---|---|---|---|---|
| 2408 Woods Way The Villages, FL | 3.0 | 2.0 | 1419 | $2,900 | $2.04 | 21d | 1 | 0.06mi |
| 5828 Tupelo Ter Unit Posted to Internet Wildwood, FL | 2.0 | 2.0 | 1147 | $4,500 | $3.92 | 21d | 1 | 0.06mi |
| 1750 Debellis Ln Unit Posted To Internet Sumterville, FL | 3.0 | 2.0 | 1505 | $4,250 | $2.82 | 21d | 1 | 1.22mi |
HOA detail
- Monthly dues
- $204 · $2,448/yr
- Likely covers
- gaslandscaping
Listing history 13 events
-
2026-06-17status $414,900 Pending 64 DOM
-
2026-06-16days on market $414,900 Active 64 DOM
-
2026-06-15days on market $414,900 Active 63 DOM
-
2026-06-14days on market $414,900 Active 61 DOM
-
2026-06-13days on market $414,900 Active 60 DOM
-
2026-06-10days on market $414,900 Active 58 DOM
-
2026-06-09days on market $414,900 Active 57 DOM
-
2026-06-08days on market $414,900 Active 56 DOM
-
2026-06-07days on market $414,900 Active 55 DOM
-
2026-06-02days on market $414,900 Active 50 DOM
-
2026-04-07$414,900 Active
-
2026-03-25historical
-
2026-03-10$410,000 Active
ⓘ Source: listings_history table (triggers on properties + properties_extension) + one-shot
backfill from property_details.listing_events for pre-trigger history.
Tax reassessment forecast FL · Resets to sale price
- Current annual tax
- $1,943 · $162/mo
- Projected year-2 tax
- $3,444 · $287/mo
- Expected delta
- +$1,501/yr (+$125/mo · 77.3%)
ⓘ Screening estimate from a state-policy table — verify with the county assessor before closing.
Climate risk First Street
- Flood 1/10 Low FEMA zone X (unshaded) · 0% chance over 30 yrs
- Wildfire 4/10 Moderate
- Heat 9/10 Extreme 7 d/yr ≥108°F today · 23 d/yr by 30 yrs out
- Wind 9/10 Extreme 99% chance of damaging wind over 30 yrs
- Air quality 2/10 Low 1 unhealthy d/yr today · 2 by 30 yrs out
Nearby sold comps map
Loading sold comps map…
Walkable amenities ~0.75 mi
Loading nearby amenities…
Taxation est. · year 1
- Rental income
- $41,787
- − Mortgage interest
- −$23,241
- − Property taxes
- −$1,943
- − Insurance
- −$2,074
- − Repairs & maintenance
- −$3,343
- − Management
- −$3,343
- − HOA
- −$2,448
- − Depreciation
- −$12,070
- Taxable loss
- −$6,674
- Est. tax savings @ 24.0%
- +$1,602
- After-tax cash flow
- $2,039/yr
For passive investors: Depreciation is non-cash, so a rental often shows a tax loss while cash-flowing — sheltering income. Rental losses are passive: they offset passive income freely, and up to $25,000/yr can offset ordinary (W-2) income if you actively participate and your MAGI is under $100k (phasing out to $0 by $150k); unused losses carry forward. On sale, claimed depreciation is recaptured at up to 25%, and gains may owe capital-gains tax (a 1031 exchange can defer both). Figures are a year-1 estimate at your 24.0% rate — not tax advice; consult a CPA.
Schools (NCES district)
- District
- Sumter
- NCES district ID
- 1201800
- Math proficiency
- 61% ▼ -4.00%
- Reading proficiency
- 61% ▼ -2.00%
- Median HH income
- $48,240
- Composite
- 51.74/100
- National rank
- #1682
- State rank
- #11 of 73 in FL
Livability — Wildwood
- Score
- 69/100
- State rank
- #471
- US rank
- #8500
Category grades
Schools grade is shown separately in the Schools card above.
Census & demographics
- Census place
- Wildwood, FL
- County
- Sumter County · 110,591 people
- City population
- 21,568
- Metro
- The Villages, FL
- Population (ZIP)
- 28,549
- Household income
- $96,775
- Rent vs Own
- Severe rent burden
- 307.0
Population outlook (Sumter County) Hauer SSP2
- Today (2025)
- 161,172 people
- By 2030
- 180,083 · +11.7%
- By 2040
- 209,892 · +30.2%
- By 2050
- 234,186 · +45.3%
- By 2075
- 284,602 · +76.6%
- By 2100
- 317,039 · +96.7%
Race, ethnicity, and origin ACS 2023
- Neighborhood character
- Predominantly White (95%)
- Race & ethnicity
- White 95% Two or more races 2% Hispanic / Latino 2% Asian 1%
- Common ancestry
- Romanian 6% Lithuanian 3% Iranian 3%
- Foreign-born
- 6% · Canada, Vietnam
- Languages at home
- 96% English-only · Spanish 2% Vietnamese 1% Other Indo-European 0%
Political lean MEDSL · Sumter
- 2024 margin
- Solid R (+37.6) · D 30.9% · R 68.6%
- 2008→2024 swing
- -10.6pp toward R · 2008: -27.0pp · 2024: -37.6pp
- All cycles
- 2024: R+37.6 2020: R+36.1 2016: R+39.2 2012: R+34.9 2008: R+27.0
Not yet ingested
- Civics
- —
Market trends
- HPI YoY
- ▲ 20.47%
- Current HPI
- 229.0075
- Rent YoY
- —
- Metro
- The Villages, FL
- State GDP YoY
- ▲ 3.28%
- F500 in state
- 36
Industry mix (Fortune 500 HQ in FL)
| Industry | F500 HQs | Revenue |
|---|---|---|
| Industrial Technology | 2 | $29B |
|
||
| Insurance | 2 | $17B |
|
||
| Retail | 1 | $60B |
|
||
| Technology Distribution | 1 | $58B |
|
||
| Homebuilding | 1 | $35B |
|
||
| Technology Manufacturing | 1 | $35B |
|
||
Price history
+1.2% since first listed3 events — show timeline
- 2026-04-07 Listed $414,900 Stellar MLS as Distributed by MLS Grid
- 2026-03-25 Listing Removed — Stellar MLS as Distributed by MLS Grid
- 2026-03-10 Listed $410,000 Stellar MLS as Distributed by MLS Grid
Property tax history
+1.2%/yrLatest (2025): $1,943 · +1.0% YoY. Source: county tax records.
Cash-flow waterfall
monthlySold comps — $/sqft
last 12 mo · ≤1 miLoading sold comps…