 🏷️ Likely Rental
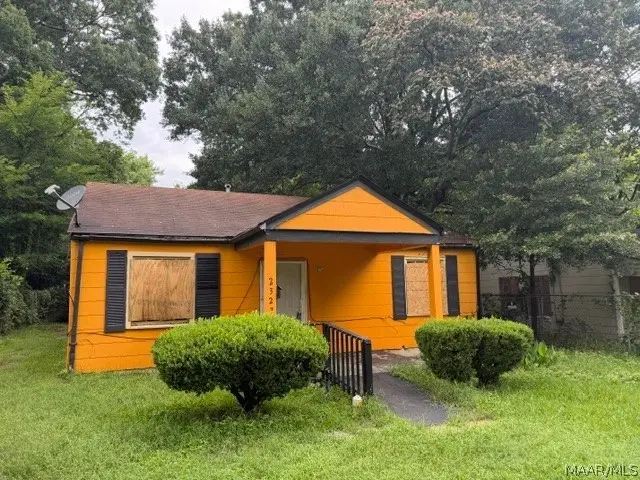
2327 E 6th St · Montgomery, AL
Flood risk 6/10 · Moderate
- FEMA flood zone
- X (unshaded)
- Chance of flooding over 30 yrs
- 0.72%
- Est. flood insurance / yr
- $507 – $1,088
Fire risk 1/10 · Minimal
- Est. fire insurance / yr
- $916 – $1,700
Heat risk 7/10 · Major
- Hot days now (above 107°F)
- 7 days/yr
- Hot days in 30 yrs
- 19 days/yr
Wind risk 8/10 · Major
- Chance of severe wind over 30 yrs
- 80.0%
Air-quality risk 3/10 · Minor
- Unhealthy air days now
- 4 days/yr
- Unhealthy air days in 30 yrs
- 4 days/yr
Risk factors via First Street. Map © Google.
Why this score? — see what drove the B+ grade
The composite is a weighted blend of 9 inputs, each scored 0–100. Each bar is that input's sub-score; the figure is the points it added to the 100-point composite (weight × sub-score).
- Cash flow +30.0/30.0
- ARV discount +15.0/15.0
- 1% rule +10.0/10.0
- DSCR +10.0/10.0
- Rent growth +4.1/5.0
- Livability +3.2/5.0
- Condition / age +2.5/5.0
- Schools +1.7/10.0
- Appreciation +0.0/10.0
$64,900
🖨 Deal sheet 📄 Offer letter ✓ Due diligence
Listing remarks MLS
GREAT INVESTMENT FOR A FIRST TIME INVESTOR or first time homebuyer!! ALL THE WORK IS COMPLETED AND READY FOR A TENANT. NEW ROOF, KITCHEN, CARPET AND PAINT inside and out. AC TO BE INSTALLED AFTER CLOSING CALL TODAY FOR AN APPT. TO TAKE A PEAK AT THIS GREAT FIND!
Key facts
- 7,405 sq ft lot
- Parking
- Built 1945
Property features AI
Exterior
- Parking: Driveway
- Utilities: Public water; Public sewer; Other utilities: Unknown
- Home design: Single-story home; Wood siding construction
- Construction: Wood siding; Built per public records
- Exterior features: City lot; Mature trees
Interior
- Kitchen: Kitchen on the first floor
- Bedrooms: Two bedrooms on the first floor
- Flooring: Laminate flooring; Tile flooring; Vinyl flooring
- Bathrooms: 1 full bathroom
- Interior features: Bonus room on the first floor; Family room on the first floor; Total of 5 rooms
- Laundry & utility: Water heater
Neighborhood map
What this means for you Summary
Snapshot
- This is a 2-bed/1.0-bath single-family listed at $65k.
Deal economics
- At list price, monthly cash flow is $649 ($8k/yr) — positive.
- The deal already cash-flows at list — no discount required.
- Meets the 1% rule at list price ($1k rent vs $65k).
- Cap rate 18.3% vs local median 6.0% in Montgomery — top-decile yield for the area; either an underpriced asset or a hidden risk that comps aren't pricing in. Stress-test before assuming the spread holds.
Location & tenants
- Location reads 65/100 on livability (#138 in AL) — a middle-class / working-renter tenant base. Strengths: cost of living A+, housing A+; Watch: schools C-, employment D, crime F.
- Montgomery County (urban): math 9% / reading 31% proficiency, ranked #106 of 129 in AL (top 82%) — low school quality limits family demand, transient renter base, plan for 1-2y turnover; 70% free/reduced lunch — lower-income household profile, screen leases tightly.
- Market conditions: Rents rising fast (+6.3%/yr); 137 active listings in the ZIP; 40 comparable units currently listed for rent nearby; rentals lingering (median 44d on market — plan ~5-8 weeks vacancy on turnover, expect pricing pressure); 50% of comp listings sitting > 30 days — soft ceiling on asking rent; 460 units permitted in Montgomery County in 2024 (37 in 5+ unit buildings).
Forward outlook
- Local home prices are declining (-3.0%/yr); year-one equity from $449 of loan paydown is wiped out by about $2k of value loss. Plan a longer hold.
- Montgomery County population projected to shrink 8% by 2050 — rents likely to lag national; underwrite the cash flow, not the appreciation.
- At projected returns (-3.0% appreciation + 6.3% rent growth), your $18k cash investment doubles in ~3 years — after that, you're playing with house money.
Negotiation context
- Only 12 days on market — expect competitive offers; lowballing is unlikely to land.
- 3 sale attempts since 24y ago with the ask held roughly flat each time — persistent listings suggest the price (not the market) is what's stuck; bring a comps-based counter.
- Current owner paid $45k; 44% above their basis — modest negotiation headroom, anchor on the comps not their cost.
Risks & watch-outs
- Watch-outs: built in 1945 — expect roof / HVAC / electrical / plumbing capex.
- Climate carrying-cost: major flood risk; severe wind risk, 80% chance of damaging wind over 30y; extreme-heat days projected 7→19/yr by 2055 (HVAC capex compounding) — expect insurance premiums to compound above CPI over the hold.
Questions for the listing agent
- Built in 1945 — when were the roof, HVAC, electrical panel, plumbing, and water heater last replaced?
- Is there a deadline driving the sale (1031 exchange, divorce, estate, relocation)? That informs how much negotiation room exists.
- Crime grade is F in this area — have there been break-ins, vandalism, or insurance claims at this property in the last 3 years? What carrier currently insures it and at what premium?
- What's the average days-on-market for RENTAL listings here right now (not sales)? A rising rental-DOM trend means longer vacancies and softer asking-rent achievability than the comps imply.
- What's the recent tenant-quality profile in this submarket — average credit score on applications, eviction rate, late-payment / NSF rate, and stable-employment percentage? A property-management company in the area should have these aggregated.
- How much new for-sale + rental construction is in the pipeline within 1–3 miles? Heavy new supply typically softens prices + rents 12–24 months out; constrained supply supports both.
Investment metrics
- 1% rule
- 2.01% ✓
- Cap rate
- 18.30%
- Cash-on-cash
- 42.87%
- DSCR
- 2.91
- GRM
- 4.2
CMA / ARV
- ARV (on-the-fly)
- $116,800
- Comps found
- 12
Show comp detail 12 sales within ~0.75 mi
| Address | Dist | Beds/Ba | Sqft | Sold | Price | $/sf | Match |
|---|---|---|---|---|---|---|---|
| 1955 Gorgas St | 0.13mi | 2/2.0 | 1,536 (-4%) | 2mo | $150,000 | $98 | 82 |
| 2121 E 3rd St | 0.31mi | 3/1.0 (+1) | 1,600 (0%) | 4mo | $15,000 | $9 | 77 |
| 2009 Commodore St | 0.21mi | 3/2.0 (+1) | 1,661 (+4%) | 4mo | $65,000 | $39 | 71 |
| 1728 Robison Hill Rd | 0.43mi | 3/2.0 (+1) | 1,574 (-2%) | 1mo | $65,500 | $42 | 67 |
| 1474 Watson Ave | 0.47mi | 3/2.0 (+1) | 1,472 (-8%) | 7mo | $107,000 | $73 | 50 |
| 1738 W 3rd St | 0.51mi | 3/2.0 (+1) | 1,720 (+8%) | 6mo | $37,500 | $22 | 50 |
| 1605 West St | 0.35mi | 3/1.0 (+1) | 1,836 (+15%) | 7mo | $60,000 | $33 | 48 |
| 1458 Watson Ave | 0.48mi | 3/2.0 (+1) | 1,412 (-12%) | 1mo | $160,000 | $113 | 48 |
| 1364 Felder Ave | 0.57mi | 3/2.0 (+1) | 1,722 (+8%) | 6mo | $197,000 | $114 | 46 |
| 1820 Robison Hill Rd | 0.51mi | 3/2.0 (+1) | 1,423 (-11%) | 9mo | $115,000 | $81 | 42 |
| 2412 College St | 0.66mi | 3/2.0 (+1) | 1,776 (+11%) | 7mo | $265,000 | $149 | 36 |
| 2430 Plum St | 0.73mi | 3/2.0 (+1) | 1,388 (-13%) | 6mo | $89,000 | $64 | 30 |
Match score weights: distance 35% · size 25% · config 20% · recency 20%. Top-matched comps best support the ARV.
Projected returns pro-forma
-3.0% appreciation · 6.29% rent growth · sell at horizon
- IRR
- 43.1%
- Equity multiple
- 2.94×
- Total profit
- $35,261
- Equity at exit
- $9,677
- IRR
- 50.6%
- Equity multiple
- 6.69×
- Total profit
- $103,406
- Equity at exit
- $5,611
Cash invested: $18,172 (down + closing). Projections, not guarantees.
Landlord ↔ Tenant lean methodology
- Overall (STATE)
- 90 Strongly Landlord-Friendly
- State Alabama
- 90 Strongly Landlord-Friendly · R+15
- County
- — inherits STATE
- City
- — inherits STATE
ZIP-level market 36106
- Home prices YoY
- -13.1%
- Rents YoY
- 6.3%
- Active inventory
- 137
- Price-to-rent
- 4.2×
Monthly cashflow live
- Estimated rent
- $1,302 high interval (Pro) →
- Mortgage (P&I)
- −$340
- Tax from tax record
- −$12 /mo · $147/yr
- Insurance
- −$27
- HOA
- −$0
- Vacancy / Maint / Mgmt
- −$273
- Net cashflow
- $649
Break-even live
UW: 25.0% down · 7.5% · 30yr · 1.5% tax · 5.0% vac · 8.0% maint · 8.0% mgmt
Financing live
Cash to close
- Down payment
- $16,225
- Closing costs
- $1,947
- Reserves months
- —
- Total cash needed
- —
Loan-product check · same deal, 3 products live
Conventional
25% down · 7.5% · 30yr
- Down + closing
- —
- Monthly P&I
- —
- Monthly cashflow
- —
- DSCR
- —
- Eligible?
- —
Personal DTI + credit; lowest rate.
DSCR
20% down · 8.5% · 30yr
- Down + closing
- —
- Monthly P&I
- —
- Monthly cashflow
- —
- DSCR
- —
- Eligible?
- —
No personal income docs; deal must DSCR.
Hard money
10% down · 12.0% · 12mo
- Down + closing
- —
- Monthly P&I
- —
- Monthly cashflow
- —
- DSCR
- —
- Eligible?
- —
Short-term bridge; refi at stabilization.
Rent comps 40 comps
| Address | Beds | Baths | Sqft | Rent | $/sqft | DOM | Units | Dist |
|---|---|---|---|---|---|---|---|---|
| 2014 Commodore St Montgomery, AL | 3.0 | 2.0 | 1613 | $1,450 | $0.90 | 13d | 1 | 0.19mi |
| 2045 Bullard St Unit 1043526P Montgomery, AL | 3.0 | 2.0 | 1797 | $2,198 | $1.22 | 43d | 1 | 0.21mi |
| 2053 Gorgas St Montgomery, AL | 3.0 | 1.0 | 1955 | $1,200 | $0.61 | 21d | 1 | 0.24mi |
| 2226 Carter Hill Rd Montgomery, AL | 2.0 | 1.0 | 1506 | $905 | $0.60 | 43d | 1 | 0.27mi |
| 2020 E 3rd St Montgomery, AL | 2.0 | 1.0 | 1186 | $750 | $0.63 | 21d | 1 | 0.36mi |
| 1493 Watson St Montgomery, AL | 1.0 | 1.0 | 1066 | $900 | $0.84 | 21d | 1 | 0.40mi |
| 1491 Watson St Montgomery, AL | 1.0 | 1.0 | 1066 | $900 | $0.84 | 21d | 1 | 0.40mi |
| 1487 Watson St Montgomery, AL | 1.0 | 1.0 | 1066 | $875 | $0.82 | 21d | 1 | 0.40mi |
| 1814 Pinecrest Dr Montgomery, AL | 3.0 | 1.0 | 1053 | $990 | $0.94 | 43d | 1 | 0.51mi |
| 1425 Blairwood Montgomery, AL | 3.0 | 2.0 | 1700 | $1,850 | $1.09 | 13d | 1 | 0.53mi |
| 1450 Crenshaw Pl S Montgomery, AL | 3.0 | 2.0 | 1641 | $1,775 | $1.08 | 43d | 1 | 0.59mi |
| 2736 Chevy Chase Dr Montgomery, AL | 3.0 | 1.0 | 1100 | $1,300 | $1.18 | 43d | 1 | 0.60mi |
| 2000 Cherry St Montgomery, AL | 2.0 | 1.0 | 1106 | $950 | $0.86 | 43d | 1 | 0.73mi |
| 1814 Sylvan Dr Montgomery, AL | 3.0 | 2.0 | 1785 | $1,400 | $0.78 | 21d | 1 | 0.76mi |
| 3136 Harrison Rd Montgomery, AL | 3.0 | 1.5 | 1355 | $1,025 | $0.76 | 43d | 1 | 0.84mi |
| 2727 Boultier St Montgomery, AL | 1.0–3.0 | 1.0–2.0 | 1070 | $1,508 | $1.41 | 13d | 3 | 0.90mi |
| 2983 Old Farm Rd Montgomery, AL | 3.0 | 2.0 | 2000 | $1,725 | $0.86 | 21d | 1 | 0.94mi |
| 2009 Palmetto St Montgomery, AL | 3.0 | 1.0 | 1487 | $1,050 | $0.71 | 43d | 1 | 0.97mi |
| 3318 Habersham Rd Montgomery, AL | 3.0 | 2.0 | 1134 | $1,250 | $1.10 | 13d | 1 | 1.03mi |
| 3323 Bedford Ln Montgomery, AL | 3.0 | 2.0 | 1134 | $1,200 | $1.06 | 21d | 1 | 1.13mi |
| 906 E Fairview Ave Unit 902 Montgomery, AL | 2.0 | 1.0 | 1100 | $995 | $0.90 | 21d | 1 | 1.15mi |
| 3346 Bedford Ln Montgomery, AL | 3.0 | 1.0 | 1134 | $1,295 | $1.14 | 13d | 1 | 1.17mi |
| 311 Bradley Dr Montgomery, AL | 3.0 | 1.0 | 1104 | $825 | $0.75 | 43d | 1 | 1.20mi |
| 2113 Brewton St Montgomery, AL | 3.0 | 1.0 | 1363 | $1,150 | $0.84 | 43d | 1 | 1.23mi |
| 519 Thorn Pl Montgomery, AL | 2.0 | 1.0 | 1632 | $650 | $0.40 | 21d | 1 | 1.30mi |
| 128 S Capitol Pkwy Montgomery, AL | 3.0 | 1.0 | 1550 | $1,500 | $0.97 | 43d | 1 | 1.30mi |
| 1216 Karen Rd Montgomery, AL | 3.0 | 2.0 | 1620 | $1,350 | $0.83 | 13d | 1 | 1.31mi |
| 3356 Audubon Rd Montgomery, AL | 2.0 | 1.5 | 1340 | $950 | $0.71 | 43d | 1 | 1.31mi |
| 428 Thorn Pl Montgomery, AL | 2.0 | 1.0 | 1549 | $1,450 | $0.94 | 43d | 1 | 1.36mi |
| 926 Green Ridge Ct Montgomery, AL | 3.0 | 2.0 | 1665 | $1,381 | $0.83 | 13d | 1 | 1.37mi |
| 1827 Capitol Ave Montgomery, AL | 2.0 | 1.0 | 1068 | $1,600 | $1.50 | 43d | 1 | 1.37mi |
| 1827 Capitol Ave Montgomery, AL | 2.0 | 1.0 | 1068 | $1,600 | $1.50 | 13d | 1 | 1.37mi |
| 3256 Montezuma Rd Montgomery, AL | 3.0 | 2.0 | 1515 | $1,450 | $0.96 | 43d | 1 | 1.37mi |
| 1117 Karen Rd Montgomery, AL | 3.0 | 1.0 | 1308 | $1,195 | $0.91 | 43d | 1 | 1.38mi |
| 122 Oak Forest Dr Montgomery, AL | 3.0 | 1.0 | 1092 | $975 | $0.89 | 21d | 1 | 1.39mi |
| 1154 Lakewood Dr Montgomery, AL | 3.0 | 2.0 | 1066 | $1,350 | $1.27 | 43d | 1 | 1.40mi |
| 39 S Lewis St Montgomery, AL | 2.0 | 1.0 | 1209 | $950 | $0.79 | 43d | 1 | 1.42mi |
| 3352 Ridgefield Dr Montgomery, AL | 3.0 | 2.0 | 1932 | $1,761 | $0.91 | 21d | 1 | 1.44mi |
| 2229 Madison Ave Montgomery, AL | 2.0 | 1.0 | 1100 | $625 | $0.57 | 43d | 1 | 1.44mi |
| 334 Felder Ave Montgomery, AL | 3.0 | 2.0 | 2223 | $2,395 | $1.08 | 43d | 1 | 1.47mi |
Listing history 11 events
-
2026-06-18days on market $64,900 Active 12 DOM
-
2026-06-17days on market $64,900 Active 11 DOM
-
2026-06-16days on market $64,900 Active 10 DOM
-
2026-06-15days on market $64,900 Active 9 DOM
-
2026-06-14days on market $64,900 Active 7 DOM
-
2026-06-13days on market $64,900 Active 6 DOM
-
2026-06-10days on market $64,900 Active 4 DOM
-
2026-06-09days on market $64,900 Active 3 DOM
-
2026-06-08days on market $64,900 Active 2 DOM
-
2026-06-07remarks 674-char remark
-
2026-06-07$64,900 Active 1 DOM
ⓘ Source: listings_history table (triggers on properties + properties_extension) + one-shot
backfill from property_details.listing_events for pre-trigger history.
Tax reassessment forecast AL · Resets to sale price
- Current annual tax
- $147 · $12/mo
- Projected year-2 tax
- $266 · $22/mo
- Expected delta
- +$119/yr (+$10/mo · 80.9%)
ⓘ Screening estimate from a state-policy table — verify with the county assessor before closing.
Climate risk First Street
- Flood 6/10 Major FEMA zone X (unshaded) · 72% chance over 30 yrs
- Wildfire 1/10 Low
- Heat 7/10 Severe 7 d/yr ≥107°F today · 19 d/yr by 30 yrs out
- Wind 8/10 Severe 80% chance of damaging wind over 30 yrs
- Air quality 3/10 Moderate 4 unhealthy d/yr today · 4 by 30 yrs out
Nearby sold comps map
Loading sold comps map…
Walkable amenities ~0.75 mi
Loading nearby amenities…
Taxation est. · year 1
- Rental income
- $15,628
- − Mortgage interest
- −$3,635
- − Property taxes
- −$147
- − Insurance
- −$324
- − Repairs & maintenance
- −$1,250
- − Management
- −$1,250
- − Depreciation
- −$1,888
- Taxable income
- $7,132
- Est. tax owed @ 24.0%
- −$1,712
- After-tax cash flow
- $6,078/yr
For passive investors: Depreciation is non-cash, so a rental often shows a tax loss while cash-flowing — sheltering income. Rental losses are passive: they offset passive income freely, and up to $25,000/yr can offset ordinary (W-2) income if you actively participate and your MAGI is under $100k (phasing out to $0 by $150k); unused losses carry forward. On sale, claimed depreciation is recaptured at up to 25%, and gains may owe capital-gains tax (a 1031 exchange can defer both). Figures are a year-1 estimate at your 24.0% rate — not tax advice; consult a CPA.
Schools (NCES district)
- District
- Montgomery County
- NCES district ID
- 0102430
- Math proficiency
- 9% ▼ -21.00%
- Reading proficiency
- 31% ▼ -1.00%
- Median HH income
- $43,902
- Composite
- 17.24/100
- National rank
- #9093
- State rank
- #106 of 129 in AL
Livability — Montgomery
- Score
- 65/100
- State rank
- #138
- US rank
- #13416
Category grades
Schools grade is shown separately in the Schools card above.
Census & demographics
- Census place
- Montgomery, AL
- County
- Montgomery County · 190,016 people
- City population
- 175,913
- Metro
- Montgomery, AL
- Population (ZIP)
- 14,065
- Household income
- $69,087
- Rent vs Own
- Severe rent burden
- 876.0
Population outlook (Montgomery County) Hauer SSP2
- Today (2025)
- 224,008 people
- By 2030
- 221,460 · -1.1%
- By 2040
- 214,179 · -4.4%
- By 2050
- 204,912 · -8.5%
- By 2075
- 177,821 · -20.6%
- By 2100
- 145,134 · -35.2%
Race, ethnicity, and origin ACS 2023
- Neighborhood character
- Diverse neighborhood (Simpson 0.58)
- Race & ethnicity
- White 47% Black 43% Hispanic / Latino 5% Two or more races 4% Asian 1%
- Hispanic origin (detail)
- Mexican 3%
- Common ancestry
- Serbian 2% Slovak 2% Italian 1%
- Foreign-born
- 4% · Canada, China, South Korea
- Languages at home
- 94% English-only · Spanish 3%
Political lean MEDSL · Montgomery
- 2024 margin
- Solid D (+30.7) · D 64.8% · R 34.1% · Other 1.1%
- 2008→2024 swing
- +11.5pp toward D · 2008: 19.2pp · 2024: 30.7pp
- All cycles
- 2024: D+30.7 2020: D+31.5 2016: D+26.2 2012: D+24.3 2008: D+19.2
Not yet ingested
- Civics
- —
Market trends
- HPI YoY
- ▼ -22.82%
- Current HPI
- 151.1822
- Rent YoY
- ▲ 6.29%
- Metro
- Montgomery, AL
- State GDP YoY
- ▲ 2.94%
- F500 in state
- 4
Industry mix (Fortune 500 HQ in AL)
| Industry | F500 HQs | Revenue |
|---|---|---|
| Financial Services | 1 | $8B |
|
||
| Healthcare | 1 | $5B |
|
||
Price history
+73.1% since first listed5 events — show timeline
- 2026-06-05 Listed $64,900 MAAR
- 2008-02-05 Sold (Public Records) $45,122 Public Records
- 2008-01-31 Sold (MLS) $45,000 MAAR
- 2007-12-13 Listed $45,500 MAAR
- 2002-03-18 Listed $37,500 MAAR
Property tax history
-1.9%/yrLatest (2025): $147 · -3.3% YoY. Source: county tax records.
Cash-flow waterfall
monthlySold comps — $/sqft
last 12 mo · ≤1 miLoading sold comps…