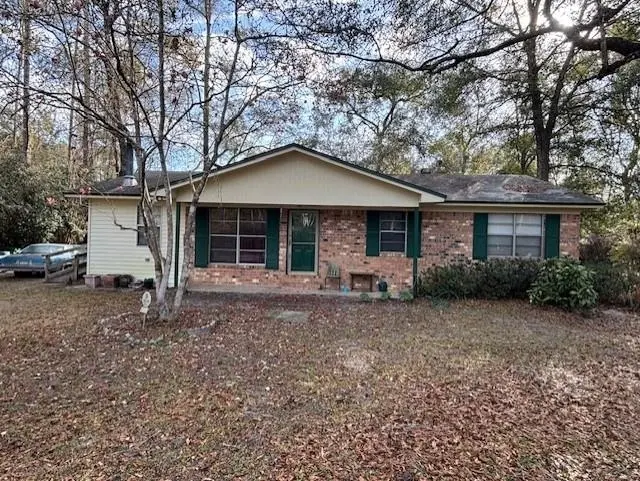
8515 Forest Wood Dr · Woodville, FL
Flood risk 4/10 · Minor
- FEMA flood zone
- X (unshaded)
- Chance of flooding over 30 yrs
- 0.22%
- Est. flood insurance / yr
- $507 – $1,088
Fire risk 6/10 · Moderate
- Est. fire insurance / yr
- $947 – $1,759
Heat risk 9/10 · Severe
- Hot days now (above 109°F)
- 7 days/yr
- Hot days in 30 yrs
- 20 days/yr
Wind risk 9/10 · Severe
- Chance of severe wind over 30 yrs
- 99.0%
Air-quality risk 4/10 · Minor
- Unhealthy air days now
- 5 days/yr
- Unhealthy air days in 30 yrs
- 7 days/yr
Risk factors via First Street. Map © Google.
Why this score? — see what drove the C- grade
The composite is a weighted blend of 9 inputs, each scored 0–100. Each bar is that input's sub-score; the figure is the points it added to the 100-point composite (weight × sub-score).
- ARV discount +15.0/15.0
- Cash flow +14.4/30.0
- DSCR +4.4/10.0
- Schools +4.3/10.0
- 1% rule +4.0/10.0
- Livability +3.4/5.0
- Rent growth +2.5/5.0
- Condition / age +2.5/5.0
- Appreciation +0.0/10.0
$175,000
🖨 Deal sheet (PDF) 📄 Offer letter ✓ Due diligence
Listing remarks
Great opportunity for a handyman or investor on this recently foreclosed home! Solid 3/2 starter home on a large lot! Open floorplan, screen porch, enclosed laundry area, Franklin stove, and more! Home has been cleared out and needs some TLC to make it a great first home or rental property. Sold AS-IS. Cash only.
Key facts
- Large lot
- Franklin stove
- Screen porch
Tags
Property features AI
Finance
- Financial info: For sale
- HOA & community: Street lights in the community
Exterior
- Parking: Driveway
- Utilities: Public water (implied by public road and typical connections); Public sewer (implied); Electric service
- Home design: Single-story; Brick and wood siding exterior; Crawlspace foundation
- Construction: Brick and wood siding construction
- Exterior features: Covered patio/porch; Deck; Porch; Screened porch; Partial fencing; Public maintained paved road
Interior
- Kitchen: Oven; Range; Pantry
- Bedrooms: Bedroom 2 (12x11); Bedroom 3 (11x11)
- Flooring: Carpet; Tile; Vinyl
- Bathrooms: 2 full bathrooms
- Heating & cooling: Central heating; Electric heating; Heat pump; Wood stove; Central air; Ceiling fans; Electric cooling; Heat pump cooling
- Interior features: Stall shower; Window treatments; Pantry
- Laundry & utility: Utility room; Garage (listed as a room type)
Neighborhood map
What this means for you Summary
Snapshot
- This is a 3-bed/2.0-bath single-family listed at $175k.
Deal economics
- At list price, monthly cash flow is $35 ($421/yr) — positive.
- The deal already cash-flows at list — no discount required.
- To meet the 1% rule (rent ≥ 1% of price), the offer needs to be $158k (9.5% below list).
- Recommended offer: $158k (9.5% below list) — sets the bar for 1% rule.
- Cap rate 6.5% vs local median 4.5% in Woodville — top-decile yield for the area; either an underpriced asset or a hidden risk that comps aren't pricing in. Stress-test before assuming the spread holds.
Location & tenants
- Location reads 67/100 on livability (#581 in FL) — a middle-class / working-renter tenant base. Strengths: cost of living A+, housing A+, crime A-; Watch: employment D, amenities F, commute F.
- Leon (urban): math 48% / reading 53% proficiency, ranked #33 of 73 in FL (top 45%) — acceptable for families but not a draw, mixed tenant base, ~2y average lease.
- Zoned schools: Woodville School (math 31% / reading 34%, grade F, #1,787 of 2,144 statewide, top 84%, 492 students, 70% FRL); R. Frank Nims Middle School (math 20% / reading 24%, grade F, #549 of 571 statewide, top 97%, 609 students, 82% FRL); James Rickards High School (math 23% / reading 37%, grade F, #441 of 667 statewide, top 67%, 1,581 students, 57% FRL) — zoned schools average 70% FRL vs 45% district-wide (25 pts higher); higher-poverty schools than district average — tighter screening recommended.
- Zoned-school proficiency averages 28% at this address vs 50% district-wide (-22 pts) — the specific schools serving this property underperform the Leon average; the district grade overstates school quality for this exact location.
- Market conditions: 105 active listings in the ZIP; 1,765 units permitted in Leon County in 2024 (975 in 5+ unit buildings).
- This rent runs 40% of the median local income ($48k/yr) — at the standard rent-burdened threshold; future hikes will face affordability resistance.
Forward outlook
- Local home prices are declining (-3.0%/yr); year-one equity from $1k of loan paydown is wiped out by about $5k of value loss. Plan a longer hold.
- Leon County population projected at +23% by 2050 — long-run rental-demand tailwind backs the buy-and-hold thesis.
Negotiation context
- It's been on market 76 days — a 6% lower offer ($164k) is reasonable based on typical stale-listing flexibility.
- Current owner paid $88k; list at $175k implies a 99% gain — meaningful room to come down on a strong offer.
Risks & watch-outs
- Climate carrying-cost: severe wind risk, 99% chance of damaging wind over 30y; major wildfire risk; extreme-heat days projected 7→20/yr by 2055 (HVAC capex compounding) — expect insurance premiums to compound above CPI over the hold.
Questions for the listing agent
- It's been on market 76 days. Have you received any prior offers? Is the seller open to a 10% concession, seller financing, or rate buy-down credit?
- Built in 1973 — when were the roof, HVAC, electrical panel, plumbing, and water heater last replaced?
- Why hasn't it sold? Are there any deal-killer items the seller is aware of (foundation, flood, title, zoning, code violations)?
- Is there a deadline driving the sale (1031 exchange, divorce, estate, relocation)? That informs how much negotiation room exists.
- Schools are F-rated, which usually means shorter tenancies and higher turnover. Who's the typical renter profile here, and what's been the actual vacancy rate?
- What's the average days-on-market for RENTAL listings here right now (not sales)? A rising rental-DOM trend means longer vacancies and softer asking-rent achievability than the comps imply.
- What's the recent tenant-quality profile in this submarket — average credit score on applications, eviction rate, late-payment / NSF rate, and stable-employment percentage? A property-management company in the area should have these aggregated.
- How much new for-sale + rental construction is in the pipeline within 1–3 miles? Heavy new supply typically softens prices + rents 12–24 months out; constrained supply supports both.
Investment metrics
- 1% rule
- 0.90% ✗
- Cap rate
- 6.53%
- Cash-on-cash
- 0.86%
- DSCR
- 1.04
- GRM
- 9.2
CMA / ARV
- ARV (on-the-fly)
- $222,272
- Comps found
- 1
Show comp detail 1 sale within ~0.75 mi
| Address | Dist | Beds/Ba | Sqft | Sold | Price | $/sf | Match |
|---|---|---|---|---|---|---|---|
| 8519 Forest Wood Dr | 0.03mi | 3/1.5 | 1,208 (0%) | 3mo | $222,000 | $184 | 94 |
Match score weights: distance 35% · size 25% · config 20% · recency 20%. Top-matched comps best support the ARV.
Projected returns pro-forma
-3.0% appreciation · 3.0% rent growth · sell at horizon
- IRR
- -14.9%
- Equity multiple
- 0.47×
- Total profit
- $-26,097
- Equity at exit
- $26,093
- IRR
- -6.3%
- Equity multiple
- 0.60×
- Total profit
- $-19,737
- Equity at exit
- $15,131
Cash invested: $49,000 (down + closing). Projections, not guarantees.
Landlord ↔ Tenant lean methodology
- Overall (STATE)
- 87 Strongly Landlord-Friendly
- State Florida
- 87 Strongly Landlord-Friendly · R+3
- County
- — inherits STATE
- City
- — inherits STATE
ZIP-level market 32305
- Home prices YoY
- -22.5%
- Active inventory
- 105
- Price-to-rent
- 9.2×
Monthly cashflow live
- Estimated rent
- $1,583 medium interval (Pro) →
- Mortgage (P&I)
- −$918
- Tax from tax record
- −$225 /mo · $2,698/yr
- Insurance
- −$73
- HOA
- −$0
- Vacancy / Maint / Mgmt
- −$332
- Net cashflow
- $35
Break-even live
Sensitivity live
| Price | -10% $134 | -5% $85 | +0% $35 | +5% $-14 | +10% $-64 |
|---|---|---|---|---|---|
| Rent | -10% $-90 | -5% $-27 | +0% $35 | +5% $98 | +10% $160 |
| Rate | -1.0pp $123 | -0.5pp $80 | base $35 | +0.5pp $-10 | +1.0pp $-56 |
UW: 25.0% down · 7.5% · 30yr · 1.5% tax · 5.0% vac · 8.0% maint · 8.0% mgmt
Financing live
Cash to close
- Down payment
- $43,750
- Closing costs
- $5,250
- Reserves months
- —
- Total cash needed
- —
Loan-product check · same deal, 3 products live
Conventional
25% down · 7.5% · 30yr
- Down + closing
- —
- Monthly P&I
- —
- Monthly cashflow
- —
- DSCR
- —
- Eligible?
- —
Personal DTI + credit; lowest rate.
DSCR
20% down · 8.5% · 30yr
- Down + closing
- —
- Monthly P&I
- —
- Monthly cashflow
- —
- DSCR
- —
- Eligible?
- —
No personal income docs; deal must DSCR.
Hard money
10% down · 12.0% · 12mo
- Down + closing
- —
- Monthly P&I
- —
- Monthly cashflow
- —
- DSCR
- —
- Eligible?
- —
Short-term bridge; refi at stabilization.
Listing history 21 events
-
2026-06-22days on market $175,000 Active 76 DOM
-
2026-06-18days on market $175,000 Active 73 DOM
-
2026-06-17days on market $175,000 Active 72 DOM
-
2026-06-16days on market $175,000 Active 71 DOM
-
2026-06-15days on market $175,000 Active 70 DOM
-
2026-06-14days on market $175,000 Active 68 DOM
-
2026-06-10days on market $175,000 Active 65 DOM
-
2026-06-09days on market $175,000 Active 64 DOM
-
2026-06-08remarks 316-char remark
-
2026-06-08days on market $175,000 Active 63 DOM
-
2026-06-07days on market $175,000 Active 62 DOM
-
2026-06-05days on market $175,000 Active 59 DOM
-
2026-06-03days on market $175,000 Active 58 DOM
-
2026-06-02days on market $175,000 Active 57 DOM
-
2026-06-01days on market $175,000 Active 56 DOM
-
2026-05-31days on market $175,000 Active 55 DOM
-
2026-05-30days on market $175,000 Active 54 DOM
-
2026-04-06$175,000 Active
-
2026-03-05soldstatus $88,100
-
2003-10-17soldstatus $95,000
-
1999-06-01soldstatus $69,900
ⓘ Source: listings_history table (triggers on properties + properties_extension) + one-shot
backfill from property_details.listing_events for pre-trigger history.
Tax reassessment forecast FL · Resets to sale price
- Current annual tax
- $2,698 · $225/mo
- Projected year-2 tax
- $2,698 · $225/mo
- Expected delta
- $0/yr ($0/mo · 0.0%)
ⓘ Screening estimate from a state-policy table — verify with the county assessor before closing.
Climate risk First Street
- Flood 4/10 Moderate FEMA zone X (unshaded) · 22% chance over 30 yrs
- Wildfire 6/10 Major
- Heat 9/10 Extreme 7 d/yr ≥109°F today · 20 d/yr by 30 yrs out
- Wind 9/10 Extreme 99% chance of damaging wind over 30 yrs
- Air quality 4/10 Moderate 5 unhealthy d/yr today · 7 by 30 yrs out
Nearby sold comps map
Loading sold comps map…
Walkable amenities ~0.75 mi
Loading nearby amenities…
Taxation est. · year 1
- Rental income
- $18,996
- − Mortgage interest
- −$9,803
- − Property taxes
- −$2,698
- − Insurance
- −$875
- − Repairs & maintenance
- −$1,520
- − Management
- −$1,520
- − Depreciation
- −$5,091
- Taxable loss
- −$2,511
- Est. tax savings @ 24.0%
- +$603
- After-tax cash flow
- $1,023/yr
For passive investors: Depreciation is non-cash, so a rental often shows a tax loss while cash-flowing — sheltering income. Rental losses are passive: they offset passive income freely, and up to $25,000/yr can offset ordinary (W-2) income if you actively participate and your MAGI is under $100k (phasing out to $0 by $150k); unused losses carry forward. On sale, claimed depreciation is recaptured at up to 25%, and gains may owe capital-gains tax (a 1031 exchange can defer both). Figures are a year-1 estimate at your 24.0% rate — not tax advice; consult a CPA.
Schools (NCES district)
- District
- Leon
- NCES district ID
- 1201110
- Math proficiency
- 48% ▼ -13.00%
- Reading proficiency
- 53% ▼ -5.00%
- Median HH income
- $46,339
- Composite
- 42.84/100
- National rank
- #3131
- State rank
- #33 of 73 in FL
Livability — Woodville
- Score
- 67/100
- State rank
- #581
- US rank
- #10723
Category grades
Schools grade is shown separately in the Schools card above.
Census & demographics
- Census place
- Woodville, FL
- County
- Leon County · 294,472 people
- Metro
- Tallahassee, FL
- Population (ZIP)
- 19,384
- Household income
- $48,045
- Rent vs Own
- Severe rent burden
- 654.0
Population outlook (Leon County) Hauer SSP2
- Today (2025)
- 315,507 people
- By 2030
- 330,677 · +4.8%
- By 2040
- 358,465 · +13.6%
- By 2050
- 386,804 · +22.6%
- By 2075
- 465,480 · +47.5%
- By 2100
- 519,959 · +64.8%
Race, ethnicity, and origin ACS 2023
- Neighborhood character
- Diverse neighborhood (Simpson 0.57)
- Race & ethnicity
- Black 57% White 33% Two or more races 5% Hispanic / Latino 5% Asian 1%
- Common ancestry
- Serbian 1% Hispanic 1% Iranian 1%
- Foreign-born
- 3% · Canada
- Languages at home
- 94% English-only · Spanish 5% Other Indo-European 1%
Political lean MEDSL · Leon
- 2024 margin
- Strong D (+21.8) · D 60.3% · R 38.5% · Other 1.2%
- 2008→2024 swing
- -2.5pp toward R · 2008: 24.3pp · 2024: 21.8pp
- All cycles
- 2024: D+21.8 2020: D+28.3 2016: D+25.1 2012: D+23.6 2008: D+24.3
Not yet ingested
- Civics
- —
Market trends
- HPI YoY
- ▼ -63.40%
- Current HPI
- 218.4834
- Rent YoY
- —
- Metro
- Tallahassee, FL
- State GDP YoY
- ▲ 3.28%
- F500 in state
- 36
Industry mix (Fortune 500 HQ in FL)
| Industry | F500 HQs | Revenue |
|---|---|---|
| Industrial Technology | 2 | $29B |
|
||
| Insurance | 2 | $17B |
|
||
| Retail | 1 | $60B |
|
||
| Technology Distribution | 1 | $58B |
|
||
| Homebuilding | 1 | $35B |
|
||
| Technology Manufacturing | 1 | $35B |
|
||
Price history
+150.4% since first listed4 events — show timeline
- 2026-04-06 Listed $175,000 CATRS
- 2026-03-05 Sold (Public Records) $88,100 Public Records
- 2003-10-17 Sold (Public Records) $95,000 Public Records
- 1999-06-01 Sold (Public Records) $69,900 Public Records
Property tax history
+17.8%/yrLatest (2025): $2,698 · +13.2% YoY. Source: county tax records.
Cash-flow waterfall
monthlySold comps — $/sqft
last 12 mo · ≤1 miLoading sold comps…