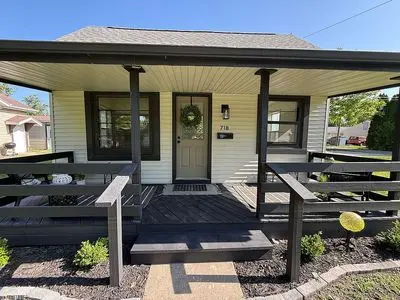
718 W Roane St · Sullivan, IL
Flood risk 1/10 · Minimal
- FEMA flood zone
- X (unshaded)
- Chance of flooding over 30 yrs
- 0.0%
- Est. flood insurance / yr
- $507 – $1,088
Fire risk 1/10 · Minimal
- Est. fire insurance / yr
- $804 – $1,492
Heat risk 3/10 · Minor
- Hot days now (above 104°F)
- 7 days/yr
- Hot days in 30 yrs
- 20 days/yr
Wind risk 2/10 · Minimal
- Chance of severe wind over 30 yrs
- 1.0%
Air-quality risk 2/10 · Minimal
- Unhealthy air days now
- 1 days/yr
- Unhealthy air days in 30 yrs
- 1 days/yr
Risk factors via First Street. Map © Google.
Why this score? — see what drove the D- grade
The composite is a weighted blend of 9 inputs, each scored 0–100. Each bar is that input's sub-score; the figure is the points it added to the 100-point composite (weight × sub-score).
- Cash flow +16.4/30.0
- DSCR +5.1/10.0
- 1% rule +3.3/10.0
- Livability +3.2/5.0
- Rent growth +2.5/5.0
- Condition / age +2.5/5.0
- Schools +2.1/10.0
- ARV discount +1.2/15.0
- Appreciation +0.0/10.0
$149,900
🖨 Deal sheet 📄 Offer letter ✓ Due diligence
Listing remarks MLS
Opportunity to be in Sullivan School District. Older 1 story home has had some remodeling, exterior is cute, has newer roof, vinyl siding and central air. Needs TLC, but located with 5 miles of Lake Shelbyville. Lots of possibilities--could possibly have 3 bedrooms-does have 1 1/2 baths-Selling as-is, proof of funds must accompany all offers
Key facts
- Remodeled
- New modern fixtures
- Newer roof
Tags
Neighborhood map
What this means for you Summary
Snapshot
- This is a 2-bed/1.5-bath single-family listed at $150k.
Deal economics
- At list price, monthly cash flow is $84 ($1k/yr) — positive.
- The deal already cash-flows at list — no discount required.
- To meet the 1% rule (rent ≥ 1% of price), the offer needs to be $125k (16.6% below list).
- Recommended offer: $125k (16.6% below list) — sets the bar for 1% rule.
Location & tenants
- Location reads 65/100 on livability (#647 in IL) — a middle-class / working-renter tenant base. Strengths: crime A+, cost of living A+, housing A+; Watch: employment C-, schools F, amenities F.
- Sullivan CUSD 300 (town): math 21% / reading 28% proficiency, ranked #338 of 620 in IL (top 54%) — low school quality limits family demand, transient renter base, plan for 1-2y turnover.
- Market conditions: 42 active listings in the ZIP; 1 comparable units currently listed for rent nearby; 42 units permitted in Moultrie County in 2024 (20 in 5+ unit buildings).
Forward outlook
- Local home prices are declining (-3.0%/yr); year-one equity from $1k of loan paydown is wiped out by about $4k of value loss. Plan a longer hold.
- Moultrie County population projected at -12% by 2050 — secular population decline; favor cash flow + early exit over multi-decade hold.
Negotiation context
- It's been on market 27 days — a 2% lower offer ($148k) is reasonable based on typical stale-listing flexibility.
- 5 sale attempts since 13y ago with the ask held roughly flat each time — persistent listings suggest the price (not the market) is what's stuck; bring a comps-based counter.
- Current owner paid $10k; list at $150k implies a 1384% gain — meaningful room to come down on a strong offer.
Risks & watch-outs
- Watch-outs: built in 1890 — expect roof / HVAC / electrical / plumbing capex.
Questions for the listing agent
- Built in 1890 — when were the roof, HVAC, electrical panel, plumbing, and water heater last replaced?
- Is there a deadline driving the sale (1031 exchange, divorce, estate, relocation)? That informs how much negotiation room exists.
- Schools are F-rated, which usually means shorter tenancies and higher turnover. Who's the typical renter profile here, and what's been the actual vacancy rate?
- The area grade is low — what's the realistic commute time and amenity access for the typical tenant pool here? Any planned neighborhood developments (good or bad) we should know about?
- What's the average days-on-market for RENTAL listings here right now (not sales)? A rising rental-DOM trend means longer vacancies and softer asking-rent achievability than the comps imply.
- What's the recent tenant-quality profile in this submarket — average credit score on applications, eviction rate, late-payment / NSF rate, and stable-employment percentage? A property-management company in the area should have these aggregated.
- How much new for-sale + rental construction is in the pipeline within 1–3 miles? Heavy new supply typically softens prices + rents 12–24 months out; constrained supply supports both.
Investment metrics
- 1% rule
- 0.83% ✗
- Cap rate
- 6.97%
- Cash-on-cash
- 2.41%
- DSCR
- 1.11
- GRM
- 10.0
CMA / ARV
- ARV (on-the-fly)
- $131,452
- Comps found
- 12
Show comp detail 12 sales within ~0.75 mi
| Address | Dist | Beds/Ba | Sqft | Sold | Price | $/sf | Match |
|---|---|---|---|---|---|---|---|
| 508 S Grant St | 0.09mi | 2/1.0 | 1,008 (-10%) | 4mo | $107,000 | $106 | 75 |
| 607 S Faith Ln | 0.15mi | 3/1.5 (+1) | 1,008 (-10%) | 2mo | $130,000 | $129 | 71 |
| 203 E Louis St | 0.56mi | 2/1.0 | 1,152 (+3%) | 0mo | $138,000 | $120 | 66 |
| 804 S Washington St | 0.51mi | 3/1.0 (+1) | 1,127 (+1%) | 2mo | $118,000 | $105 | 66 |
| 15 E Louis St | 0.49mi | 3/1.5 (+1) | 1,056 (-5%) | 0mo | $132,500 | $125 | 63 |
| 612 S Hope Ln | 0.20mi | 3/2.0 (+1) | 1,247 (+12%) | 3mo | $160,000 | $128 | 61 |
| 817 S Madison St | 0.55mi | 3/1.0 (+1) | 1,092 (-2%) | 6mo | $129,000 | $118 | 59 |
| 1004 Cr 1300n Rd | 0.47mi | 2/1.0 | 1,015 (-9%) | 6mo | $35,000 | $34 | 56 |
| 425 S Polk St | 0.59mi | 3/1.0 (+1) | 1,056 (-5%) | 6mo | $95,000 | $90 | 52 |
| 922 S Washington St | 0.57mi | 3/1.0 (+1) | 1,058 (-5%) | 7mo | $145,000 | $137 | 52 |
| 310 Wright St | 0.58mi | 3/1.0 (+1) | 1,000 (-10%) | 7mo | $117,000 | $117 | 43 |
| 215 E Mattox St | 0.65mi | 3/2.0 (+1) | 1,259 (+13%) | 1mo | $149,000 | $118 | 40 |
Match score weights: distance 35% · size 25% · config 20% · recency 20%. Top-matched comps best support the ARV.
Projected returns pro-forma
-3.0% appreciation · 3.0% rent growth · sell at horizon
- IRR
- -12.5%
- Equity multiple
- 0.55×
- Total profit
- $-18,993
- Equity at exit
- $22,351
- IRR
- -3.5%
- Equity multiple
- 0.76×
- Total profit
- $-9,891
- Equity at exit
- $12,961
Cash invested: $41,972 (down + closing). Projections, not guarantees.
Landlord ↔ Tenant lean methodology
- Overall (STATE)
- 43 Moderately Tenant-Leaning
- State Illinois
- 43 Moderately Tenant-Leaning · D+7
- County
- — inherits STATE
- City
- — inherits STATE
ZIP-level market 61951
- Home prices YoY
- -7.6%
- Active inventory
- 42
- Price-to-rent
- 10.0×
Monthly cashflow live
- Estimated rent
- $1,250 medium interval (Pro) →
- Mortgage (P&I)
- −$786
- Tax from tax record
- −$55 /mo · $658/yr
- Insurance
- −$62
- HOA
- −$0
- Vacancy / Maint / Mgmt
- −$262
- Net cashflow
- $84
Break-even live
UW: 25.0% down · 7.5% · 30yr · 1.5% tax · 5.0% vac · 8.0% maint · 8.0% mgmt
Financing live
Cash to close
- Down payment
- $37,475
- Closing costs
- $4,497
- Reserves months
- —
- Total cash needed
- —
Loan-product check · same deal, 3 products live
Conventional
25% down · 7.5% · 30yr
- Down + closing
- —
- Monthly P&I
- —
- Monthly cashflow
- —
- DSCR
- —
- Eligible?
- —
Personal DTI + credit; lowest rate.
DSCR
20% down · 8.5% · 30yr
- Down + closing
- —
- Monthly P&I
- —
- Monthly cashflow
- —
- DSCR
- —
- Eligible?
- —
No personal income docs; deal must DSCR.
Hard money
10% down · 12.0% · 12mo
- Down + closing
- —
- Monthly P&I
- —
- Monthly cashflow
- —
- DSCR
- —
- Eligible?
- —
Short-term bridge; refi at stabilization.
Rent comps 1 comps
| Address | Beds | Baths | Sqft | Rent | $/sqft | DOM | Units | Dist |
|---|---|---|---|---|---|---|---|---|
| 1612 S Hamilton St Sullivan, IL | 2.0–3.0 | 2.0 | 1057 | $1,250 | $1.18 | 13d | 3 | 0.98mi |
Listing history 24 events
-
2026-06-19days on market $149,900 Active 27 DOM
-
2026-06-18days on market $149,900 Active 26 DOM
-
2026-06-17days on market $149,900 Active 25 DOM
-
2026-06-16days on market $149,900 Active 24 DOM
-
2026-06-15days on market $149,900 Active 23 DOM
-
2026-06-14days on market $149,900 Active 21 DOM
-
2026-06-12days on market $149,900 Active 20 DOM
-
2026-06-09days on market $149,900 Active 17 DOM
-
2026-06-08days on market $149,900 Active 16 DOM
-
2026-06-07days on market $149,900 Active 15 DOM
-
2026-06-05days on market $149,900 Active 12 DOM
-
2026-06-03days on market $149,900 Active 11 DOM
-
2026-06-02days on market $149,900 Active 10 DOM
-
2026-06-01days on market $149,900 Active 9 DOM
-
2026-05-31days on market $149,900 Active 8 DOM
-
2026-05-30days on market $149,900 Active 7 DOM
-
2026-05-24$149,900 Active
-
2025-06-17status Active
-
2025-06-11price $45,900
-
2025-04-16$49,900 Active
-
2013-05-15soldstatus $10,100 343-char remark
Show marketing remark (343 chars)
Opportunity to be in Sullivan School District. Older 1 story home has had some remodeling, exterior is cute, has newer roof, vinyl siding and central air. Needs TLC, but located with 5 miles of Lake Shelbyville. Lots of possibilities--could possibly have 3 bedrooms-does have 1 1/2 baths-Selling as-is, proof of funds must accompany all offers
-
2013-05-15soldstatus $10,100
Show marketing remark (343 chars)
Opportunity to be in Sullivan School District. Older 1 story home has had some remodeling, exterior is cute, has newer roof, vinyl siding and central air. Needs TLC, but located with 5 miles of Lake Shelbyville. Lots of possibilities--could possibly have 3 bedrooms-does have 1 1/2 baths-Selling as-is, proof of funds must accompany all offers
-
2013-01-25$14,900 343-char remark
Show marketing remark (343 chars)
Opportunity to be in Sullivan School District. Older 1 story home has had some remodeling, exterior is cute, has newer roof, vinyl siding and central air. Needs TLC, but located with 5 miles of Lake Shelbyville. Lots of possibilities--could possibly have 3 bedrooms-does have 1 1/2 baths-Selling as-is, proof of funds must accompany all offers
-
2013-01-25$14,900
Show marketing remark (343 chars)
Opportunity to be in Sullivan School District. Older 1 story home has had some remodeling, exterior is cute, has newer roof, vinyl siding and central air. Needs TLC, but located with 5 miles of Lake Shelbyville. Lots of possibilities--could possibly have 3 bedrooms-does have 1 1/2 baths-Selling as-is, proof of funds must accompany all offers
ⓘ Source: listings_history table (triggers on properties + properties_extension) + one-shot
backfill from property_details.listing_events for pre-trigger history.
Tax reassessment forecast IL · Partial reset (capped growth)
- Current annual tax
- $658 · $55/mo
- Projected year-2 tax
- $2,030 · $169/mo
- Expected delta
- +$1,373/yr (+$114/mo · 208.7%)
ⓘ Screening estimate from a state-policy table — verify with the county assessor before closing.
Climate risk First Street
- Flood 1/10 Low FEMA zone X (unshaded) · 0% chance over 30 yrs
- Wildfire 1/10 Low
- Heat 3/10 Moderate 7 d/yr ≥104°F today · 20 d/yr by 30 yrs out
- Wind 2/10 Low 100% chance of damaging wind over 30 yrs
- Air quality 2/10 Low 1 unhealthy d/yr today · 1 by 30 yrs out
Nearby sold comps map
Loading sold comps map…
Walkable amenities ~0.75 mi
Loading nearby amenities…
Taxation est. · year 1
- Rental income
- $15,000
- − Mortgage interest
- −$8,397
- − Property taxes
- −$658
- − Insurance
- −$750
- − Repairs & maintenance
- −$1,200
- − Management
- −$1,200
- − Depreciation
- −$4,361
- Taxable loss
- −$1,564
- Est. tax savings @ 24.0%
- +$375
- After-tax cash flow
- $1,385/yr
For passive investors: Depreciation is non-cash, so a rental often shows a tax loss while cash-flowing — sheltering income. Rental losses are passive: they offset passive income freely, and up to $25,000/yr can offset ordinary (W-2) income if you actively participate and your MAGI is under $100k (phasing out to $0 by $150k); unused losses carry forward. On sale, claimed depreciation is recaptured at up to 25%, and gains may owe capital-gains tax (a 1031 exchange can defer both). Figures are a year-1 estimate at your 24.0% rate — not tax advice; consult a CPA.
Schools (NCES district)
- District
- Sullivan CUSD 300
- NCES district ID
- 1738130
- Math proficiency
- 21% ▬ 0.00%
- Reading proficiency
- 28% ▼ -10.00%
- Median HH income
- $47,763
- Composite
- 21.41/100
- National rank
- #8346
- State rank
- #338 of 620 in IL
Livability — Sullivan
- Score
- 65/100
- State rank
- #647
- US rank
- #13204
Category grades
Schools grade is shown separately in the Schools card above.
Census & demographics
- Census place
- Sullivan, IL
- Population (ZIP)
- 7,654
Population outlook (Moultrie County) Hauer SSP2
- Today (2025)
- 14,766 people
- By 2030
- 14,490 · -1.9%
- By 2040
- 13,848 · -6.2%
- By 2050
- 13,063 · -11.5%
- By 2075
- 10,862 · -26.4%
- By 2100
- 7,963 · -46.1%
Race, ethnicity, and origin ACS 2023
- Neighborhood character
- Predominantly White (97%)
- Race & ethnicity
- White 97% Two or more races 2% Black 1%
- Common ancestry
- Lithuanian 1% Italian 1% Slovak 1%
- Foreign-born
- 1%
- Languages at home
- 90% English-only · German/W. Germanic 8% Other Indo-European 1% Spanish 1%
Political lean MEDSL · Moultrie
- 2024 margin
- Solid R (+49.1) · D 24.8% · R 73.8% · Other 1.4%
- 2008→2024 swing
- -36.2pp toward R · 2008: -12.8pp · 2024: -49.1pp
- All cycles
- 2024: R+49.1 2020: R+49.0 2016: R+48.0 2012: R+27.1 2008: R+12.8
Not yet ingested
- Civics
- —
Market trends
- HPI YoY
- ▼ -17.15%
- Current HPI
- 208.2808
- Rent YoY
- —
- Metro
- —
- State GDP YoY
- ▲ 1.59%
- F500 in state
- 60
Industry mix (Fortune 500 HQ in IL)
| Industry | F500 HQs | Revenue |
|---|---|---|
| Insurance | 4 | $201B |
|
||
| Consumer Goods | 4 | $87B |
|
||
| Industrial Machinery | 3 | $64B |
|
||
| Healthcare | 2 | $55B |
|
||
| Retail / Pharmacy | 1 | $148B |
|
||
| Agriculture / Food | 1 | $86B |
|
||
Price history
+906.0% since first listed8 events — show timeline
- 2026-05-24 Listed $149,900 FSBO.com
- 2025-06-17 Relisted — CIBR
- 2025-06-11 Price Changed $45,900 CIBR
- 2025-04-16 Listed $49,900 CIBR
- 2013-05-15 Sold (MLS) $10,100 MRED as Distributed by MLS Grid
- 2013-05-15 Sold (MLS) $10,100 CIBR
- 2013-01-25 Listed $14,900 MRED as Distributed by MLS Grid
- 2013-01-25 Listed $14,900 CIBR
Property tax history
-6.7%/yrLatest (2024): $658 · +6.8% YoY. Source: county tax records.
Cash-flow waterfall
monthlySold comps — $/sqft
last 12 mo · ≤1 miLoading sold comps…