 Duplex
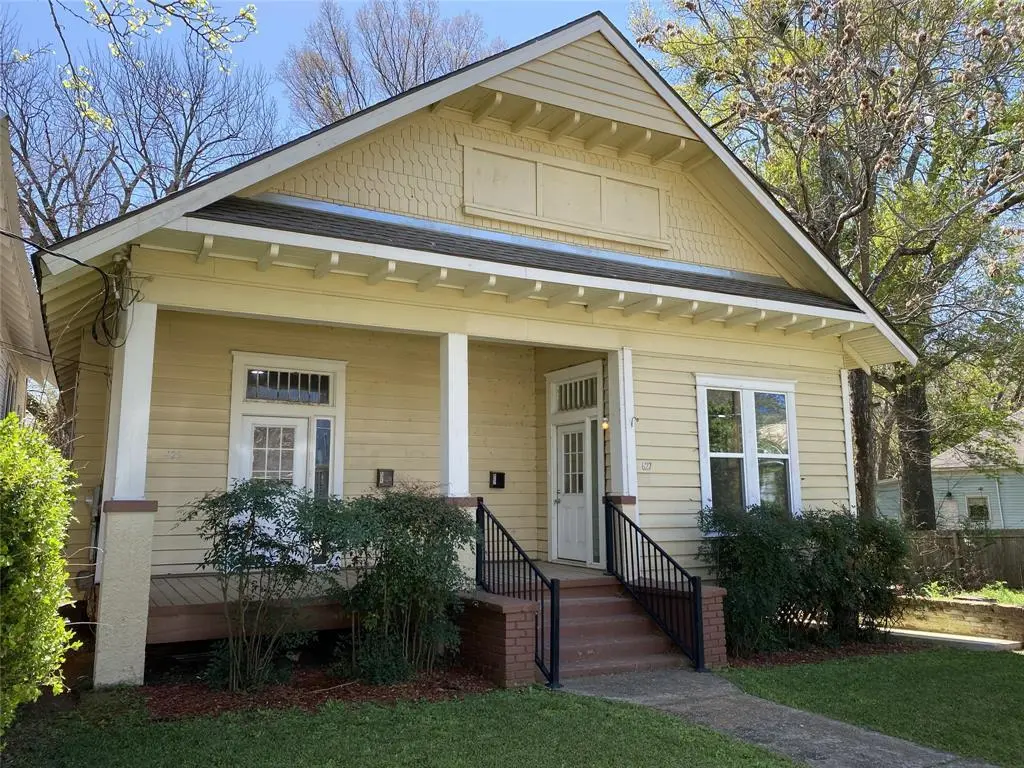
625 Wichita St · Shreveport, LA
Flood risk 1/10 · Minimal
- FEMA flood zone
- X (unshaded)
- Chance of flooding over 30 yrs
- 0.0%
- Est. flood insurance / yr
- $507 – $1,088
Fire risk 1/10 · Minimal
- Est. fire insurance / yr
- $1,269 – $2,357
Heat risk 7/10 · Major
- Hot days now (above 110°F)
- 7 days/yr
- Hot days in 30 yrs
- 22 days/yr
Wind risk 6/10 · Moderate
- Chance of severe wind over 30 yrs
- 66.0%
Air-quality risk 2/10 · Minimal
- Unhealthy air days now
- 1 days/yr
- Unhealthy air days in 30 yrs
- 2 days/yr
Risk factors via First Street. Map © Google.
Why this score? — see what drove the C+ grade
The composite is a weighted blend of 9 inputs, each scored 0–100. Each bar is that input's sub-score; the figure is the points it added to the 100-point composite (weight × sub-score).
- Cash flow +30.0/30.0
- DSCR +10.0/10.0
- 1% rule +9.0/10.0
- Appreciation +4.8/10.0
- Livability +3.0/5.0
- Rent growth +2.5/5.0
- Condition / age +2.5/5.0
- Schools +2.2/10.0
- ARV discount +0.0/15.0
$105,000
🖨 Deal sheet 📄 Offer letter ✓ Due diligence
Multi-family units
County records classify this as Multi-Family (2-4 Unit). Listing-text estimate: 2 units. confirmed
Listing remarks
Remodeled duplex in the Highland area. Large, spacious rooms. New, roof, windows, paint, flooring, fixtures, much more. Convenient to all city amenities and city bus routes. Must see! 625 is Unit 1 and is an efficiency with a living-bedroom combo. 627 is unit 2 and has a bedroom between the kitchen and living areas.
Key facts
- Remodeled duplex
- New flooring
- New paint
Tags
Property features AI
Finance
- Other: Real estate owned (REO) special listing condition
- Financial info: Property listed as residential income duplex; Number of buildings: 1; Total units: 2; Gross annual income and expenses listed as 0.00
- HOA & community: No association
Exterior
- Parking: On-street parking
- Utilities: Electricity connected; Individual gas meter; No municipal utility district
- Home design: Duplex (residential income); Built in 1930; Pillar/post/pier foundation; Asphalt roof
- Construction: Wood construction
- Exterior features: Lot less than 0.5 acre
Interior
- Kitchen: Dishwasher; Electric range; Microwave
- Bedrooms: 2 bedrooms
- Flooring: Luxury vinyl plank flooring
- Bathrooms: 2 full bathrooms
- Heating & cooling: Central heating; Central air conditioning
- Interior features: Other interior features; One-level layout
Neighborhood map
What this means for you Summary
Snapshot
- This is a 2 × 2-bed/2.0-bath units multifamily listed at $105k.
Deal economics
- At list price, monthly cash flow is $522 ($6k/yr) — positive. Per door: $261/mo.
- The deal already cash-flows at list — no discount required.
- Meets the 1% rule at list price ($1k rent vs $105k).
- Recommended offer: $102k (3.0% below list) — sets the bar for market timing.
- Cap rate 12.3% vs local median 5.7% in Shreveport — top-decile yield for the area; either an underpriced asset or a hidden risk that comps aren't pricing in. Stress-test before assuming the spread holds.
Location & tenants
- Location reads 59/100 on livability (#270 in LA) — a working-class tenant base; expect higher turnover. Strengths: cost of living A+, housing A; Watch: schools D+, crime F, amenities F.
- Caddo Parish (urban): math 21% / reading 32% proficiency, ranked #53 of 98 in LA (top 54%) — low school quality limits family demand, transient renter base, plan for 1-2y turnover; 64% free/reduced lunch — lower-income household profile, screen leases tightly.
- Market conditions: 61 active listings in the ZIP; 40 comparable units currently listed for rent nearby; rentals at typical pace (median 21d on market — plan ~3-4 weeks tenant-placement turnaround); lower-income renter base — watch delinquency; 221 units permitted in Caddo Parish in 2024 (0 in 5+ unit buildings).
- At $1,465/mo this rent would consume 91% of the median local household income ($19k/yr) (locally 702% of renters already pay >50% of income on rent) — very limited rent-growth headroom before tenants either downsize or default.
Forward outlook
- In year one you build about $410 of equity ($726 loan paydown + $-316 appreciation (-0.3% local appreciation)).
- Caddo County population projected at -15% by 2050 — secular population decline; favor cash flow + early exit over multi-decade hold.
- At projected returns (-0.3% appreciation + 3.0% rent growth), your $29k cash investment doubles in ~4 years — after that, you're playing with house money.
Negotiation context
- It's been on market 56 days — a 3% lower offer ($102k) is reasonable based on typical stale-listing flexibility.
- Current owner paid $17k; list at $105k implies a 530% gain — meaningful room to come down on a strong offer.
Risks & watch-outs
- Watch-outs: built in 1930 — expect roof / HVAC / electrical / plumbing capex.
- Climate carrying-cost: major wind risk, 66% chance of damaging wind over 30y; extreme-heat days projected 7→22/yr by 2055 (HVAC capex compounding) — expect insurance premiums to compound above CPI over the hold.
Questions for the listing agent
- It's been on market 56 days. Have you received any prior offers? Is the seller open to a 3% concession, seller financing, or rate buy-down credit?
- Can we see the unit-by-unit rent roll, current vacancy, and any below-market leases? What's the average tenancy length?
- What capital expenditures (roof, boiler, parking lot, exteriors) have been made in the last 5 years, and what's planned in the next 2?
- Built in 1930 — when were the roof, HVAC, electrical panel, plumbing, and water heater last replaced?
- Is there a deadline driving the sale (1031 exchange, divorce, estate, relocation)? That informs how much negotiation room exists.
- Schools are D-rated, which usually means shorter tenancies and higher turnover. Who's the typical renter profile here, and what's been the actual vacancy rate?
- Crime grade is F in this area — have there been break-ins, vandalism, or insurance claims at this property in the last 3 years? What carrier currently insures it and at what premium?
- What's the average days-on-market for RENTAL listings here right now (not sales)? A rising rental-DOM trend means longer vacancies and softer asking-rent achievability than the comps imply.
- What's the recent tenant-quality profile in this submarket — average credit score on applications, eviction rate, late-payment / NSF rate, and stable-employment percentage? A property-management company in the area should have these aggregated.
- How much new apartment / multifamily construction is in the pipeline within 1–3 miles? Heavy new supply (>2% of stock underway) typically softens rents 12–24 months out; light construction supports rent growth.
Investment metrics
- 1% rule
- 1.40% ✓
- Cap rate
- 12.25%
- Cash-on-cash
- 21.29%
- DSCR
- 1.95
- GRM
- 6.0
CMA / ARV
- ARV (median comp)
- $75,319
- List price
- $105,000
- Delta
- 39.41%
- Verdict
- OVERPRICED
- Comps
- 20 within 1.0 mi
Show comp detail 3 sales within ~0.75 mi
| Address | Dist | Beds/Ba | Sqft | Sold | Price | $/sf | Match |
|---|---|---|---|---|---|---|---|
| 2430/2432 Highland Ave | 0.49mi | 2/2.0 | 1,480 (-3%) | 7mo | $89,000 | $60 | 67 |
| 2528 Pinehurst Blvd | 0.52mi | 2/2.0 | 1,368 (-10%) | 15mo | $109,500 | $80 | 46 |
| 2316 Creswell Ave | 0.35mi | 3/2.0 (+1) | 1,736 (+14%) | 15mo | $224,900 | $130 | 42 |
Match score weights: distance 35% · size 25% · config 20% · recency 20%. Top-matched comps best support the ARV.
Projected returns pro-forma
-0.3% appreciation · 3.0% rent growth · sell at horizon
- IRR
- 20.5%
- Equity multiple
- 1.97×
- Total profit
- $28,636
- Equity at exit
- $28,918
- IRR
- 25.0%
- Equity multiple
- 3.71×
- Total profit
- $79,704
- Equity at exit
- $33,531
Cash invested: $29,400 (down + closing). Projections, not guarantees.
Landlord ↔ Tenant lean methodology
- Overall (STATE)
- 90 Strongly Landlord-Friendly
- State Louisiana
- 90 Strongly Landlord-Friendly · R+12
- County
- — inherits STATE
- City
- — inherits STATE
ZIP-level market 71101
- Home prices YoY
- -0.4%
- Active inventory
- 61
- Price-to-rent
- 11.9×
Monthly cashflow live
- Estimated rent
- $1,465 high interval (Pro) →
- Mortgage (P&I)
- −$551
- Tax from tax record
- −$41 /mo · $497/yr
- Insurance
- −$44
- HOA
- −$0
- Vacancy / Maint / Mgmt
- −$308
- Net cashflow
- $522
Break-even live
2-unit breakdown (identical units grouped — click to expand)
| Units | Beds | Baths | Est. rent |
|---|---|---|---|
| 2× units | 2 | 2 | $1,466 |
| #1 | 2 | 2 | $733 |
| #2 | 2 | 2 | $733 |
| Total (2 units) | $1,465 | ||
UW: 25.0% down · 7.5% · 30yr · 1.5% tax · 5.0% vac · 8.0% maint · 8.0% mgmt
Financing live
Cash to close
- Down payment
- $26,250
- Closing costs
- $3,150
- Reserves months
- —
- Total cash needed
- —
Loan-product check · same deal, 3 products live
Conventional
25% down · 7.5% · 30yr
- Down + closing
- —
- Monthly P&I
- —
- Monthly cashflow
- —
- DSCR
- —
- Eligible?
- —
Personal DTI + credit; lowest rate.
DSCR
20% down · 8.5% · 30yr
- Down + closing
- —
- Monthly P&I
- —
- Monthly cashflow
- —
- DSCR
- —
- Eligible?
- —
No personal income docs; deal must DSCR.
Hard money
10% down · 12.0% · 12mo
- Down + closing
- —
- Monthly P&I
- —
- Monthly cashflow
- —
- DSCR
- —
- Eligible?
- —
Short-term bridge; refi at stabilization.
Rent comps 40 comps
| Address | Beds | Baths | Sqft | Rent | $/sqft | DOM | Units | Dist |
|---|---|---|---|---|---|---|---|---|
| 708 College St Shreveport, LA | 2.0 | 1.0 | 1156 | $925 | $0.80 | 13d | 1 | 0.23mi |
| 442 Merrick St Shreveport, LA | 3.0 | 1.5 | 1595 | $1,000 | $0.63 | 44d | 1 | 0.28mi |
| 2109 Highland Ave Shreveport, LA | 3.0 | 1.0 | 1739 | $1,050 | $0.60 | 44d | 1 | 0.29mi |
| 431 College St Shreveport, LA | 2.0 | 2.0 | 1100 | $850 | $0.77 | 13d | 1 | 0.36mi |
| 406 College St Shreveport, LA | 2.0 | 1.0 | 1215 | $900 | $0.74 | 44d | 1 | 0.37mi |
| 451 Egan St Shreveport, LA | 3.0 | 1.5 | 1300 | $750 | $0.58 | 13d | 1 | 0.40mi |
| 419 Boulevard St Shreveport, LA | 3.0 | 2.0 | 1852 | $1,100 | $0.59 | 44d | 1 | 0.42mi |
| 517 Stoner Ave Shreveport, LA | 2.0 | 1.0 | 1100 | $625 | $0.57 | 44d | 1 | 0.43mi |
| 642 Robinson Pl Shreveport, LA | 3.0 | 1.0 | 1500 | $1,275 | $0.85 | 21d | 1 | 0.49mi |
| 315 Dalzell St Shreveport, LA | 2.0 | 2.5 | 1372 | $1,100 | $0.80 | 44d | 1 | 0.54mi |
| 328 Prospect St Shreveport, LA | 2.0 | 1.0 | 1641 | $1,000 | $0.61 | 44d | 1 | 0.55mi |
| 144 Merrick St Shreveport, LA | 2.0 | 1.0 | 1532 | $800 | $0.52 | 44d | 1 | 0.63mi |
| 315 Robinson Pl Shreveport, LA | 2.0 | 1.0 | 1161 | $800 | $0.69 | 13d | 1 | 0.64mi |
| 1101 College St Shreveport, LA | 2.0 | 2.0 | 1100 | $850 | $0.77 | 13d | 1 | 0.65mi |
| 127 Herndon St Shreveport, LA | 2.0 | 1.0 | 1325 | $800 | $0.60 | 13d | 1 | 0.67mi |
| 717 Kirby Pl Shreveport, LA | 2.0 | 1.0 | 1894 | $1,450 | $0.77 | 44d | 1 | 0.68mi |
| 2717 Fairfield Ave Shreveport, LA | 2.0 | 1.0 | 1250 | $950 | $0.76 | 44d | 1 | 0.73mi |
| 103 E Merrick St Shreveport, LA | 2.0 | 1.0 | 1200 | $900 | $0.75 | 44d | 1 | 0.74mi |
| 2721 Fairfield Ave Shreveport, LA | 2.0 | 2.0 | 1250 | $1,200 | $0.96 | 44d | 1 | 0.74mi |
| 2515 Centenary Blvd Shreveport, LA | 2.0 | 1.0 | 1200 | $2,500 | $2.08 | 13d | 1 | 0.75mi |
| 126 E Olive St Shreveport, LA | 2.0 | 1.0 | 1200 | $1,500 | $1.25 | 13d | 1 | 0.76mi |
| 143 E Herndon St Unit 143 Shreveport, LA | 2.0 | 1.0 | 1200 | $830 | $0.69 | 21d | 1 | 0.80mi |
| 140 Wilkinson St Unit 142 Shreveport, LA | 3.0 | 3.0 | 1174 | $1,300 | $1.11 | 21d | 1 | 0.83mi |
| 314 Kings Hwy Shreveport, LA | 1.0 | 1.0 | 1200 | $700 | $0.58 | 44d | 1 | 0.91mi |
| 140 E Wilkinson St Shreveport, LA | 3.0 | 3.0 | 1174 | $1,300 | $1.11 | 21d | 1 | 0.96mi |
| 250 E Jordan St Shreveport, LA | 2.0 | 1.0 | 1920 | $800 | $0.42 | 44d | 1 | 0.98mi |
| 561 Forest Ave Shreveport, LA | 2.0 | 1.0 | 1358 | $1,350 | $0.99 | 21d | 1 | 0.98mi |
| 3305 Creswell Ave Shreveport, LA | 2.0 | 1.0 | 1307 | $1,350 | $1.03 | 21d | 1 | 0.99mi |
| 2811 Samford Ave Shreveport, LA | 3.0 | 1.0 | 1612 | $850 | $0.53 | 13d | 1 | 1.01mi |
| 1147 Cornwell Ave Unit 1 Shreveport, LA | 3.0 | 2.0 | 1200 | $895 | $0.75 | 13d | 1 | 1.01mi |
| 3100 Fairfield Ave Shreveport, LA | 1.0–2.0 | 1.5–2.0 | 1001 | $1,400 | $1.40 | 21d | 1 | 1.01mi |
| 1225 Pecan St Unit B Shreveport, LA | 3.0 | 2.0 | 1070 | $900 | $0.84 | 21d | 1 | 1.02mi |
| 320 Stephenson St Shreveport, LA | 3.0 | 2.0 | 1845 | $1,675 | $0.91 | 13d | 1 | 1.16mi |
| 320 Stephenson St Shreveport, LA | 3.0 | 2.0 | 1845 | $1,675 | $0.91 | 21d | 1 | 1.16mi |
| 710 Crockett St Unit 716 Shreveport, LA | 1.0 | 1.0 | 1250 | $1,600 | $1.28 | 21d | 1 | 1.17mi |
| 1353 Glen Oak Pl Shreveport, LA | 2.0 | 1.0 | 1116 | $800 | $0.72 | 13d | 1 | 1.18mi |
| 1353 Glen Oak Pl Shreveport, LA | 2.0 | 1.0 | 1116 | $850 | $0.76 | 21d | 1 | 1.18mi |
| 229 Stephenson St Shreveport, LA | 2.0 | 2.5 | 1500 | $1,300 | $0.87 | 13d | 1 | 1.23mi |
| 719 Edwards St Shreveport, LA | 1.0–2.0 | 1.0 | 810 | $1,275 | $1.57 | 21d | 7 | 1.23mi |
| 624 Texas St Shreveport, LA | 2.0 | 1.5 | 953 | $2,358 | $2.47 | 13d | 2 | 1.33mi |
Listing history 22 events
-
2026-06-18days on market $105,000 Active 56 DOM
-
2026-06-17days on market $105,000 Active 55 DOM
-
2026-06-16days on market $105,000 Active 54 DOM
-
2026-06-15days on market $105,000 Active 53 DOM
-
2026-06-14days on market $105,000 Active 51 DOM
-
2026-06-13days on market $105,000 Active 50 DOM
-
2026-06-10days on market $105,000 Active 48 DOM
-
2026-06-09days on market $105,000 Active 47 DOM
-
2026-06-08days on market $105,000 Active 46 DOM
-
2026-06-07days on market $105,000 Active 45 DOM
-
2026-06-05days on market $105,000 Active 42 DOM
-
2026-06-03days on market $105,000 Active 41 DOM
-
2026-06-02days on market $105,000 Active 40 DOM
-
2026-06-01days on market $105,000 Active 39 DOM
-
2026-05-31days on market $105,000 Active 38 DOM
-
2026-05-30days on market $105,000 Active 37 DOM
-
2026-04-23$110,000 Active 317-char remark
-
2021-09-09soldstatus $16,667
-
2009-05-01soldstatus $50,000
-
2006-11-14soldstatus
-
2004-09-10soldstatus
-
1985-09-18soldstatus
ⓘ Source: listings_history table (triggers on properties + properties_extension) + one-shot
backfill from property_details.listing_events for pre-trigger history.
Tax reassessment forecast LA · Resets to sale price
- Current annual tax
- $497 · $41/mo
- Projected year-2 tax
- $578 · $48/mo
- Expected delta
- +$80/yr (+$7/mo · 16.2%)
ⓘ Screening estimate from a state-policy table — verify with the county assessor before closing.
Climate risk First Street
- Flood 1/10 Low FEMA zone X (unshaded) · 0% chance over 30 yrs
- Wildfire 1/10 Low
- Heat 7/10 Severe 7 d/yr ≥110°F today · 22 d/yr by 30 yrs out
- Wind 6/10 Major 66% chance of damaging wind over 30 yrs
- Air quality 2/10 Low 1 unhealthy d/yr today · 2 by 30 yrs out
Nearby sold comps map
Loading sold comps map…
Walkable amenities ~0.75 mi
Loading nearby amenities…
Taxation est. · year 1
- Rental income
- $17,580
- − Mortgage interest
- −$5,882
- − Property taxes
- −$497
- − Insurance
- −$525
- − Repairs & maintenance
- −$1,406
- − Management
- −$1,406
- − Depreciation
- −$3,055
- Taxable income
- $4,809
- Est. tax owed @ 24.0%
- −$1,154
- After-tax cash flow
- $5,104/yr
For passive investors: Depreciation is non-cash, so a rental often shows a tax loss while cash-flowing — sheltering income. Rental losses are passive: they offset passive income freely, and up to $25,000/yr can offset ordinary (W-2) income if you actively participate and your MAGI is under $100k (phasing out to $0 by $150k); unused losses carry forward. On sale, claimed depreciation is recaptured at up to 25%, and gains may owe capital-gains tax (a 1031 exchange can defer both). Figures are a year-1 estimate at your 24.0% rate — not tax advice; consult a CPA.
Schools (NCES district)
- District
- Caddo Parish
- NCES district ID
- 2200300
- Math proficiency
- 21% ▼ -33.00%
- Reading proficiency
- 32% ▼ -30.00%
- Median HH income
- $39,227
- Composite
- 22.23/100
- National rank
- #8148
- State rank
- #53 of 98 in LA
Livability — Shreveport
- Score
- 59/100
- State rank
- #270
- US rank
- #19730
Category grades
Schools grade is shown separately in the Schools card above.
Census & demographics
- Census place
- Shreveport, LA
- County
- Caddo Parish · 178,536 people
- City population
- 164,123
- Metro
- Shreveport-Bossier City, LA
- Population (ZIP)
- 6,415
- Household income
- $19,351
- Rent vs Own
- Severe rent burden
- 702.0
Population outlook (Caddo County) Hauer SSP2
- Today (2025)
- 243,190 people
- By 2030
- 237,231 · -2.5%
- By 2040
- 222,502 · -8.5%
- By 2050
- 206,516 · -15.1%
- By 2075
- 165,706 · -31.9%
- By 2100
- 122,262 · -49.7%
Race, ethnicity, and origin ACS 2023
- Neighborhood character
- Majority Black (63%)
- Race & ethnicity
- Black 63% White 29% Hispanic / Latino 5% Two or more races 2%
- Common ancestry
- Lithuanian 1% Slovak 1%
- Foreign-born
- 2% · China
- Languages at home
- 98% English-only · Tagalog/Filipino 0%
Political lean MEDSL · Caddo
- 2024 margin
- Toss-up / Even · D 51.6% · R 47.0% · Other 1.4%
- 2008→2024 swing
- +1.6pp toward D · 2008: 3.0pp · 2024: 4.6pp
- All cycles
- 2024: D+4.6 2020: D+6.8 2016: D+4.2 2012: D+4.9 2008: D+3.0
Not yet ingested
- Civics
- —
Market trends
- HPI YoY
- ▼ -0.30%
- Current HPI
- 74.2131
- Rent YoY
- —
- Metro
- Shreveport-Bossier City, LA
- State GDP YoY
- ▲ 3.29%
- F500 in state
- 10
Industry mix (Fortune 500 HQ in LA)
| Industry | F500 HQs | Revenue |
|---|---|---|
| Telecommunications | 2 | $23B |
|
||
| Utilities | 1 | $12B |
|
||
| Wholesale / Distribution | 1 | $5B |
|
||
| Advertising | 1 | $2B |
|
||
Price history
+110.0% since first listed7 events — show timeline
- 2026-05-22 Price Changed $105,000 NTREIS
- 2026-04-23 Listed $110,000 NTREIS
- 2021-09-09 Sold (Public Records) $16,667 Public Records
- 2009-05-01 Sold (Public Records) $50,000 Public Records
- 2006-11-14 Sold (Public Records) — Public Records
- 2004-09-10 Sold (Public Records) — Public Records
- 1985-09-18 Sold (Public Records) — Public Records
Property tax history
-0.1%/yrLatest (2025): $497 · +0.4% YoY. Source: county tax records.
Cash-flow waterfall
monthlySold comps — $/sqft
last 12 mo · ≤1 miLoading sold comps…