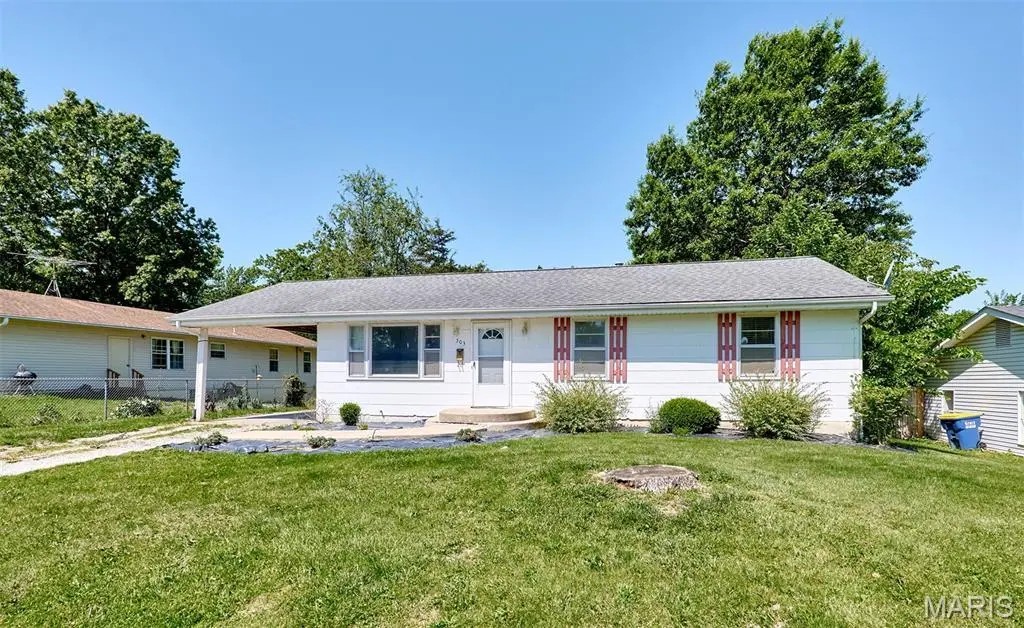
503 Mckinley Ave · Warrenton, MO
Flood risk 1/10 · Minimal
- FEMA flood zone
- X (unshaded)
- Chance of flooding over 30 yrs
- 0.0%
- Est. flood insurance / yr
- $473 – $860
Fire risk 2/10 · Minimal
- Est. fire insurance / yr
- $1,054 – $1,958
Heat risk 4/10 · Minor
- Hot days now (above 106°F)
- 7 days/yr
- Hot days in 30 yrs
- 19 days/yr
Wind risk 2/10 · Minimal
- Chance of severe wind over 30 yrs
- 1.0%
Air-quality risk 1/10 · Minimal
- Unhealthy air days now
- 0 days/yr
- Unhealthy air days in 30 yrs
- 0 days/yr
Risk factors via First Street. Map © Google.
Why this score? — see what drove the C grade
The composite is a weighted blend of 9 inputs, each scored 0–100. Each bar is that input's sub-score; the figure is the points it added to the 100-point composite (weight × sub-score).
- Cash flow +20.3/30.0
- ARV discount +15.0/15.0
- DSCR +6.4/10.0
- 1% rule +4.3/10.0
- Livability +3.6/5.0
- Schools +3.3/10.0
- Rent growth +2.5/5.0
- Condition / age +2.5/5.0
- Appreciation +0.0/10.0
$149,000
🖨 Deal sheet (PDF) 📄 Offer letter ✓ Due diligence
Listing remarks
503 McKinley offers a great opportunity for an investor, renovator, or any buyer looking to build equity with a few thoughtful updates. Situated on a tree-lined quarter-acre lot in Warrenton, this 3-bedroom, 1-bath home has the kind of character and solid feel you expect from a home built in the 1950s. Original wood floors run throughout much of the main level, and the layout offers a comfortable flow with plenty of natural light. The roomy living room is highlighted by a large picture window overlooking the front yard, while the eat-in kitchen opens to the back deck via a sliding patio door, creating a great setup for outdoor dining or entertaining. All three bedrooms and the full hall bat
Key facts
- Large picture window
- Eat in kitchen
- Original wood floors
Tags
Property features AI
Finance
- Other: Residential property, above-grade finished area reported as 988 (assessor)
- Financial info: Lease not considered
Exterior
- Parking: Off-street parking; Carport (1 space)
- Utilities: Public water; Public sewer; Electric service by Ameren; Cable connected; Electricity connected; Water available; Sewer connected
- Home design: Single family residence; One story; Private ownership; City street frontage
- Construction: Frame construction; Shingle roof; Basement
- Exterior features: Deck; Chain link fencing; City lot
Interior
- Kitchen: Electric range; Water heater
- Bedrooms: 3 bedrooms (all on the main level)
- Flooring: Hardwood flooring
- Bathrooms: 1 full bathroom (main level)
- Heating & cooling: Forced air heating; Central air conditioning
- Interior features: Basement with concrete construction; Storage
- Laundry & utility: Laundry in basement
Neighborhood map
What this means for you Summary
Snapshot
- This is a 3-bed/1.0-bath other listed at $149k.
Deal economics
- At list price, monthly cash flow is $190 ($2k/yr) — positive.
- The deal already cash-flows at list — no discount required.
- To meet the 1% rule (rent ≥ 1% of price), the offer needs to be $139k (6.5% below list).
- Recommended offer: $139k (6.5% below list) — sets the bar for 1% rule.
- Cap rate 7.8% vs local median 2.5% in Warrenton — top-decile yield for the area; either an underpriced asset or a hidden risk that comps aren't pricing in. Stress-test before assuming the spread holds.
Location & tenants
- Location reads 71/100 on livability (#120 in MO) — a middle-class / working-renter tenant base. Strengths: crime A+, cost of living A+, housing A+; Watch: employment D+, amenities D, commute F.
- Warren County R-III (town): math 30% / reading 46% proficiency, ranked #172 of 324 in MO (top 53%) — families likely to look elsewhere, expect single-tenant / working-renter base with shorter leases.
- Zoned schools: Daniel Boone Elem. (math 37% / reading 42%, grade F, #537 of 1,115 statewide, top 53%, 338 students, 50% FRL); Warrenton High (math 28% / reading 57%, grade F, #216 of 521 statewide, top 41%, 997 students, 40% FRL) — zoned schools at 45% FRL track the district average.
- Market conditions: 177 active listings in the ZIP; 8 comparable units currently listed for rent nearby; rentals lingering (median 45d on market — plan ~5-8 weeks vacancy on turnover, expect pricing pressure); 62% of comp listings sitting > 30 days — soft ceiling on asking rent; 424 units permitted in Warren County in 2024 (126 in 5+ unit buildings).
Forward outlook
- Local home prices are declining (-3.0%/yr); year-one equity from $1k of loan paydown is wiped out by about $4k of value loss. Plan a longer hold.
Negotiation context
- It's been on market 38 days — a 3% lower offer ($145k) is reasonable based on typical stale-listing flexibility.
Risks & watch-outs
- Watch-outs: built in 1950 — expect roof / HVAC / electrical / plumbing capex.
Questions for the listing agent
- It's been on market 38 days. Have you received any prior offers? Is the seller open to a 7% concession, seller financing, or rate buy-down credit?
- Built in 1950 — when were the roof, HVAC, electrical panel, plumbing, and water heater last replaced?
- Is there a deadline driving the sale (1031 exchange, divorce, estate, relocation)? That informs how much negotiation room exists.
- Schools are D-rated, which usually means shorter tenancies and higher turnover. Who's the typical renter profile here, and what's been the actual vacancy rate?
- What's the average days-on-market for RENTAL listings here right now (not sales)? A rising rental-DOM trend means longer vacancies and softer asking-rent achievability than the comps imply.
- What's the recent tenant-quality profile in this submarket — average credit score on applications, eviction rate, late-payment / NSF rate, and stable-employment percentage? A property-management company in the area should have these aggregated.
- How much new for-sale + rental construction is in the pipeline within 1–3 miles? Heavy new supply typically softens prices + rents 12–24 months out; constrained supply supports both.
Investment metrics
- 1% rule
- 0.93% ✗
- Cap rate
- 7.82%
- Cash-on-cash
- 5.47%
- DSCR
- 1.24
- GRM
- 8.9
CMA / ARV
- ARV (median comp)
- $189,619
- List price
- $149,000
- Delta
- -21.42%
- Verdict
- UNDERPRICED
- Comps
- 20 within 1.0 mi
Projected returns pro-forma
-3.0% appreciation · 3.0% rent growth · sell at horizon
- IRR
- -7.9%
- Equity multiple
- 0.71×
- Total profit
- $-12,089
- Equity at exit
- $22,216
- IRR
- 1.6%
- Equity multiple
- 1.12×
- Total profit
- $4,851
- Equity at exit
- $12,883
Cash invested: $41,720 (down + closing). Projections, not guarantees.
Landlord ↔ Tenant lean methodology
- Overall (STATE)
- 81 Strongly Landlord-Friendly
- State Missouri
- 81 Strongly Landlord-Friendly · R+10
- County
- — inherits STATE
- City
- — inherits STATE
ZIP-level market 63383
- Home prices YoY
- -28.9%
- Active inventory
- 177
- Price-to-rent
- 8.9×
Monthly cashflow live
- Estimated rent
- $1,393 high interval (Pro) →
- Mortgage (P&I)
- −$781
- Tax from tax record
- −$67 /mo · $800/yr
- Insurance
- −$62
- HOA
- −$0
- Vacancy / Maint / Mgmt
- −$292
- Net cashflow
- $190
Break-even live
Sensitivity live
| Price | -10% $274 | -5% $232 | +0% $190 | +5% $148 | +10% $106 |
|---|---|---|---|---|---|
| Rent | -10% $80 | -5% $135 | +0% $190 | +5% $245 | +10% $300 |
| Rate | -1.0pp $265 | -0.5pp $228 | base $190 | +0.5pp $151 | +1.0pp $112 |
UW: 25.0% down · 7.5% · 30yr · 1.5% tax · 5.0% vac · 8.0% maint · 8.0% mgmt
Financing live
Cash to close
- Down payment
- $37,250
- Closing costs
- $4,470
- Reserves months
- —
- Total cash needed
- —
Loan-product check · same deal, 3 products live
Conventional
25% down · 7.5% · 30yr
- Down + closing
- —
- Monthly P&I
- —
- Monthly cashflow
- —
- DSCR
- —
- Eligible?
- —
Personal DTI + credit; lowest rate.
DSCR
20% down · 8.5% · 30yr
- Down + closing
- —
- Monthly P&I
- —
- Monthly cashflow
- —
- DSCR
- —
- Eligible?
- —
No personal income docs; deal must DSCR.
Hard money
10% down · 12.0% · 12mo
- Down + closing
- —
- Monthly P&I
- —
- Monthly cashflow
- —
- DSCR
- —
- Eligible?
- —
Short-term bridge; refi at stabilization.
Rent comps 8 comps
| Address | Beds | Baths | Sqft | Rent | $/sqft | DOM | Units | Dist |
|---|---|---|---|---|---|---|---|---|
| 410 McKinley Ave Warrenton, MO | 2.0 | 1.0 | 822 | $1,500 | $1.82 | 45d | 1 | 0.11mi |
| 100 Arlington Way Warrenton, MO | 2.0 | 1.0–2.5 | 901 | $1,268 | $1.41 | 0d | 3 | 0.45mi |
| 201 Bedford Dr Warrenton, MO | 2.0 | 1.0 | 650 | $945 | $1.45 | 45d | 1 | 0.57mi |
| 1044 Hawthorn Village Dr Unit 1011 Hawthorne Warrenton, MO | 3.0 | 2.0 | 1078 | $1,375 | $1.28 | 45d | 1 | 0.65mi |
| 1044 Hawthorn Village Dr Unit 1049 Hawthorne Warrenton, MO | 2.0 | 1.5 | 855 | $1,195 | $1.40 | 45d | 1 | 0.65mi |
| 1044 Hawthorn Village Dr Unit 1027 Hawthorne Warrenton, MO | 3.0 | 2.0 | 1078 | $1,395 | $1.29 | 3d | 1 | 0.66mi |
| 307 Granada Dr Warrenton, MO | 2.0 | 1.5 | 1000 | $1,275 | $1.27 | 45d | 1 | 0.76mi |
| 16901 Cattail Bottoms Dr Warrenton, MO | 1.0–3.0 | 1.0–2.0 | 1232 | $1,795 | $1.46 | 0d | 7 | 0.81mi |
Listing history 14 events
-
2026-06-21days on market $149,000 Active 38 DOM
-
2026-06-18days on market $149,000 Active 35 DOM
-
2026-06-17days on market $149,000 Active 34 DOM
-
2026-06-16days on market $149,000 Active 33 DOM
-
2026-06-15days on market $149,000 Active 32 DOM
-
2026-06-13days on market $149,000 Active 30 DOM
-
2026-06-09days on market $149,000 Active 26 DOM
-
2026-06-08days on market $149,000 Active 25 DOM
-
2026-06-07days on market $149,000 Active 24 DOM
-
2026-06-03days on market $149,000 Active 20 DOM
-
2026-06-02days on market $149,000 Active 19 DOM
-
2026-06-01days on market $149,000 Active 18 DOM
-
2026-05-31days on market $149,000 Active 17 DOM
-
2026-05-14$149,000 Active 1545-char remark
ⓘ Source: listings_history table (triggers on properties + properties_extension) + one-shot
backfill from property_details.listing_events for pre-trigger history.
Tax reassessment forecast MO · Resets to sale price
- Current annual tax
- $800 · $67/mo
- Projected year-2 tax
- $1,445 · $120/mo
- Expected delta
- +$646/yr (+$54/mo · 80.8%)
ⓘ Screening estimate from a state-policy table — verify with the county assessor before closing.
Climate risk First Street
- Flood 1/10 Low FEMA zone X (unshaded) · 0% chance over 30 yrs
- Wildfire 2/10 Low
- Heat 4/10 Moderate 7 d/yr ≥106°F today · 19 d/yr by 30 yrs out
- Wind 2/10 Low 100% chance of damaging wind over 30 yrs
- Air quality 1/10 Low 0 unhealthy d/yr today · 0 by 30 yrs out
Nearby sold comps map
Loading sold comps map…
Walkable amenities ~0.75 mi
Loading nearby amenities…
Taxation est. · year 1
- Rental income
- $16,712
- − Mortgage interest
- −$8,346
- − Property taxes
- −$800
- − Insurance
- −$745
- − Repairs & maintenance
- −$1,337
- − Management
- −$1,337
- − Depreciation
- −$4,335
- Taxable loss
- −$188
- Est. tax savings @ 24.0%
- +$45
- After-tax cash flow
- $2,326/yr
For passive investors: Depreciation is non-cash, so a rental often shows a tax loss while cash-flowing — sheltering income. Rental losses are passive: they offset passive income freely, and up to $25,000/yr can offset ordinary (W-2) income if you actively participate and your MAGI is under $100k (phasing out to $0 by $150k); unused losses carry forward. On sale, claimed depreciation is recaptured at up to 25%, and gains may owe capital-gains tax (a 1031 exchange can defer both). Figures are a year-1 estimate at your 24.0% rate — not tax advice; consult a CPA.
Schools (NCES district)
- District
- Warren County R-III
- NCES district ID
- 2931050
- Math proficiency
- 30% ▼ -12.00%
- Reading proficiency
- 46% ▼ -4.00%
- Median HH income
- $47,644
- Composite
- 32.55/100
- National rank
- #5690
- State rank
- #172 of 324 in MO
Livability — Warrenton
- Score
- 71/100
- State rank
- #120
- US rank
- #7300
Category grades
Schools grade is shown separately in the Schools card above.
Census & demographics
- Census place
- Warrenton, MO
- Population (ZIP)
- 16,120
Population outlook (Warren County) Hauer SSP2
- Today (2025)
- 35,105 people
- By 2030
- 35,605 · +1.4%
- By 2040
- 36,047 · +2.7%
- By 2050
- 35,479 · +1.1%
- By 2075
- 33,325 · -5.1%
- By 2100
- 28,282 · -19.4%
Race, ethnicity, and origin ACS 2023
- Neighborhood character
- Predominantly White (91%)
- Race & ethnicity
- White 91% Two or more races 6% Hispanic / Latino 4%
- Common ancestry
- Italian 6% Lithuanian 3% Iranian 1%
- Foreign-born
- 0%
- Languages at home
- 98% English-only · Spanish 1%
Political lean MEDSL · Warren
- 2024 margin
- Solid R (+49.5) · D 24.7% · R 74.2% · Other 1.0%
- 2008→2024 swing
- -36.9pp toward R · 2008: -12.6pp · 2024: -49.5pp
- All cycles
- 2024: R+49.5 2020: R+46.0 2016: R+45.6 2012: R+26.8 2008: R+12.6
Not yet ingested
- Civics
- —
Market trends
- HPI YoY
- ▼ -77.56%
- Current HPI
- 191.2467
- Rent YoY
- —
- Metro
- —
- State GDP YoY
- ▲ 1.84%
- F500 in state
- 20
Industry mix (Fortune 500 HQ in MO)
| Industry | F500 HQs | Revenue |
|---|---|---|
| Healthcare | 1 | $163B |
|
||
| Insurance | 1 | $21B |
|
||
| Industrial Technology | 1 | $17B |
|
||
| Retail | 1 | $16B |
|
||
| Industrial Distribution | 1 | $10B |
|
||
| Utilities | 1 | $9B |
|
||
Price history
1 event — show timeline
- 2026-05-14 Listed $149,000 MARIS as Distributed by MLS Grid
Property tax history
+2.3%/yrLatest (2025): $800 · +15.1% YoY. Source: county tax records.
Cash-flow waterfall
monthlySold comps — $/sqft
last 12 mo · ≤1 miLoading sold comps…