6776 Townsend Rd · Jacksonville, FL
Flood risk 1/10 · Minimal
- FEMA flood zone
- X (unshaded)
- Chance of flooding over 30 yrs
- 0.0%
- Est. flood insurance / yr
- $507 – $1,088
Fire risk 4/10 · Minor
- Est. fire insurance / yr
- $947 – $1,759
Heat risk 8/10 · Major
- Hot days now (above 107°F)
- 7 days/yr
- Hot days in 30 yrs
- 20 days/yr
Wind risk 10/10 · Severe
- Chance of severe wind over 30 yrs
- 99.0%
Air-quality risk 3/10 · Minor
- Unhealthy air days now
- 3 days/yr
- Unhealthy air days in 30 yrs
- 4 days/yr
Risk factors via First Street. Map © Google.
Why this score? — see what drove the B grade
The composite is a weighted blend of 9 inputs, each scored 0–100. Each bar is that input's sub-score; the figure is the points it added to the 100-point composite (weight × sub-score).
- Cash flow +30.0/30.0
- 1% rule +10.0/10.0
- DSCR +10.0/10.0
- ARV discount +7.5/15.0
- Livability +4.2/5.0
- Condition / age +4.0/5.0
- Schools +3.9/10.0
- Rent growth +3.1/5.0
- Appreciation +0.0/10.0
$99,000
🖨 Deal sheet 📄 Offer letter ✓ Due diligence
Listing remarks
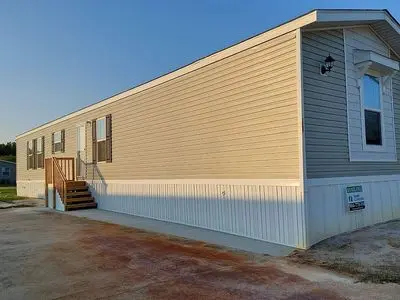
& quot; & quot; This 1088 square foot mobile / manufactured home has 3 bedrooms and 2.0 bathrooms. This home is located at 6776 Townsend Rd #160 Jacksonville FL 32244.& quot; & quot; & quot; & quot; & quot; & quot;
Key facts
- Built 2005
- Listed 8 days
Property features AI
Exterior
- Home design: Built in 2005; Single-family property
- Construction: 2005 construction
- Exterior features: Located in the Southwest subdivision
Neighborhood map
What this means for you Summary
Snapshot
- This is a 3-bed/2.0-bath other listed at $99k. Condition is rated good.
Deal economics
- At list price, monthly cash flow is $891 ($11k/yr) — positive.
- The deal already cash-flows at list — no discount required.
- Meets the 1% rule at list price ($2k rent vs $99k).
- Cap rate 17.1% vs local median 4.0% in Jacksonville — top-decile yield for the area; either an underpriced asset or a hidden risk that comps aren't pricing in. Stress-test before assuming the spread holds.
Location & tenants
- Location reads 83/100 on livability (#50 in FL, #911 nationally) — a professional / high-income tenant draw. Strengths: amenities A+, commute A+, housing A+.
- Duval (urban): math 46% / reading 45% proficiency, ranked #48 of 73 in FL (top 66%) — families likely to look elsewhere, expect single-tenant / working-renter base with shorter leases.
- Market conditions: Rents rising (+2.2%/yr); 349 active listings in the ZIP; 19 comparable units currently listed for rent nearby; rentals at typical pace (median 22d on market — plan ~3-4 weeks tenant-placement turnaround); 6,503 units permitted in Duval County in 2024 (1,131 in 5+ unit buildings).
- This rent runs 38% of the median local income ($62k/yr) — at the standard rent-burdened threshold; future hikes will face affordability resistance.
Forward outlook
- Local home prices are declining (-3.0%/yr); year-one equity from $684 of loan paydown is wiped out by about $3k of value loss. Plan a longer hold.
- Duval County population projected at +19% by 2050 — long-run rental-demand tailwind backs the buy-and-hold thesis.
- At projected returns (-3.0% appreciation + 2.2% rent growth), your $28k cash investment doubles in ~4 years — after that, you're playing with house money.
Negotiation context
- Only 9 days on market — expect competitive offers; lowballing is unlikely to land.
Risks & watch-outs
- Climate carrying-cost: severe wind risk, 99% chance of damaging wind over 30y; extreme-heat days projected 7→20/yr by 2055 (HVAC capex compounding) — expect insurance premiums to compound above CPI over the hold.
Questions for the listing agent
- Is there a deadline driving the sale (1031 exchange, divorce, estate, relocation)? That informs how much negotiation room exists.
- Schools are B-rated — typically a magnet for longer-tenancy family renters. What's the average tenant stay here, and is there a school-zone premium baked into asking?
- What's the average days-on-market for RENTAL listings here right now (not sales)? A rising rental-DOM trend means longer vacancies and softer asking-rent achievability than the comps imply.
- What's the recent tenant-quality profile in this submarket — average credit score on applications, eviction rate, late-payment / NSF rate, and stable-employment percentage? A property-management company in the area should have these aggregated.
- How much new for-sale + rental construction is in the pipeline within 1–3 miles? Heavy new supply typically softens prices + rents 12–24 months out; constrained supply supports both.
Investment metrics
- 1% rule
- 2.01% ✓
- Cap rate
- 17.09%
- Cash-on-cash
- 38.57%
- DSCR
- 2.72
- GRM
- 4.1
CMA / ARV
No comps found within radius.
Projected returns pro-forma
-3.0% appreciation · 2.25% rent growth · sell at horizon
- IRR
- 33.9%
- Equity multiple
- 2.42×
- Total profit
- $39,238
- Equity at exit
- $14,761
- IRR
- 40.4%
- Equity multiple
- 4.66×
- Total profit
- $101,320
- Equity at exit
- $8,560
Cash invested: $27,720 (down + closing). Projections, not guarantees.
Landlord ↔ Tenant lean methodology
- Overall (STATE)
- 87 Strongly Landlord-Friendly
- State Florida
- 87 Strongly Landlord-Friendly · R+3
- County
- — inherits STATE
- City
- — inherits STATE
ZIP-level market 32244
- Home prices YoY
- -17.8%
- Rents YoY
- 2.2%
- Active inventory
- 349
- Price-to-rent
- 4.1×
Monthly cashflow live
- Estimated rent
- $1,994 high interval (Pro) →
- Mortgage (P&I)
- −$519
- Tax est. 1.5%
- −$124 /mo · $1,485/yr
- Insurance
- −$41
- HOA
- −$0
- Vacancy / Maint / Mgmt
- −$419
- Net cashflow
- $891
Break-even live
UW: 25.0% down · 7.5% · 30yr · 1.5% tax · 5.0% vac · 8.0% maint · 8.0% mgmt
Financing live
Cash to close
- Down payment
- $24,750
- Closing costs
- $2,970
- Reserves months
- —
- Total cash needed
- —
Loan-product check · same deal, 3 products live
Conventional
25% down · 7.5% · 30yr
- Down + closing
- —
- Monthly P&I
- —
- Monthly cashflow
- —
- DSCR
- —
- Eligible?
- —
Personal DTI + credit; lowest rate.
DSCR
20% down · 8.5% · 30yr
- Down + closing
- —
- Monthly P&I
- —
- Monthly cashflow
- —
- DSCR
- —
- Eligible?
- —
No personal income docs; deal must DSCR.
Hard money
10% down · 12.0% · 12mo
- Down + closing
- —
- Monthly P&I
- —
- Monthly cashflow
- —
- DSCR
- —
- Eligible?
- —
Short-term bridge; refi at stabilization.
Rent comps 19 comps
| Address | Beds | Baths | Sqft | Rent | $/sqft | DOM | Units | Dist |
|---|---|---|---|---|---|---|---|---|
| 7634 Fanning Dr Jacksonville, FL | 4.0 | 2.0 | 1658 | $1,850 | $1.12 | 24d | 1 | 0.36mi |
| 7377 Benes Trl Jacksonville, FL | 4.0 | 2.0 | 1861 | $2,250 | $1.21 | 24d | 1 | 0.41mi |
| 7472 Mishkie Dr Jacksonville, FL | 3.0 | 2.0 | 1884 | $1,965 | $1.04 | 3d | 1 | 0.45mi |
| 7178 Cypress Cove Rd #25 Jacksonville, FL | 3.0 | 2.0 | 1875 | $2,000 | $1.07 | 24d | 1 | 0.55mi |
| 7485 Cliff Cottage Dr Jacksonville, FL | 3.0 | 2.0 | 1724 | $1,750 | $1.02 | 24d | 1 | 0.61mi |
| 7242 Rampart Ridge Cir E Jacksonville, FL | 4.0 | 2.5 | 2476 | $2,265 | $0.91 | 7d | 1 | 0.68mi |
| 6038 Bizier Rd Unit 6036 Jacksonville, FL | 3.0 | 2.0 | 1975 | $1,745 | $0.88 | 14d | 1 | 0.84mi |
| 7379 Edenfield Park Rd Jacksonville, FL | 3.0 | 2.5 | 2215 | $2,000 | $0.90 | 21d | 1 | 0.98mi |
| 7390 Overland Park Blvd Jacksonville, FL | 3.0 | 2.0 | 1648 | $1,970 | $1.20 | 4d | 1 | 0.99mi |
| 6931 Cane Grass Ln E Jacksonville, FL | 3.0 | 2.0 | 2100 | $2,300 | $1.10 | 4d | 1 | 0.99mi |
| 6478 Silk Leaf Ln Jacksonville, FL | 3.0 | 2.0 | 1682 | $1,985 | $1.18 | 24d | 1 | 1.01mi |
| 6869 Southern Oaks Dr W Jacksonville, FL | 3.0 | 2.0 | 1660 | $1,861 | $1.12 | 14d | 1 | 1.13mi |
| 6850 Rhapsody Rd Jacksonville, FL | 3.0 | 2.5 | 1970 | $1,995 | $1.01 | 24d | 1 | 1.17mi |
| 5726 Ovella Rd Jacksonville, FL | 3.0 | 2.0 | 1579 | $1,650 | $1.04 | 24d | 1 | 1.31mi |
| 8341 Fire Fly Ln Jacksonville, FL | 3.0 | 2.5 | 1676 | $1,695 | $1.01 | 4d | 1 | 1.34mi |
| 8341 Fire Fly Ln Jacksonville, FL | 3.0 | 2.5 | 1676 | $1,695 | $1.01 | 24d | 1 | 1.34mi |
| 6428 Hannah Stables Dr Jacksonville, FL | 3.0 | 2.0 | 1613 | $1,800 | $1.12 | 2d | 1 | 1.42mi |
| 6983 Lafayette Park Dr Jacksonville, FL | 4.0 | 2.0 | 1854 | $1,916 | $1.03 | 14d | 1 | 1.45mi |
| 6117 Hannah Stables Ct Jacksonville, FL | 4.0 | 2.0 | 1891 | $2,010 | $1.06 | 24d | 1 | 1.46mi |
Listing history 6 events
-
2026-06-18days on market $99,000 Active 9 DOM
-
2026-06-17days on market $99,000 Active 8 DOM
-
2026-06-16days on market $99,000 Active 7 DOM
-
2026-06-15days on market $99,000 Active 6 DOM
-
2026-06-10remarks 216-char remark
-
2026-06-10$99,000 Active 1 DOM
ⓘ Source: listings_history table (triggers on properties + properties_extension) + one-shot
backfill from property_details.listing_events for pre-trigger history.
Climate risk First Street
- Flood 1/10 Low FEMA zone X (unshaded) · 0% chance over 30 yrs
- Wildfire 4/10 Moderate
- Heat 8/10 Severe 7 d/yr ≥107°F today · 20 d/yr by 30 yrs out
- Wind 10/10 Extreme 99% chance of damaging wind over 30 yrs
- Air quality 3/10 Moderate 3 unhealthy d/yr today · 4 by 30 yrs out
Nearby sold comps map
Loading sold comps map…
Walkable amenities ~0.75 mi
Loading nearby amenities…
Taxation est. · year 1
- Rental income
- $23,925
- − Mortgage interest
- −$5,546
- − Property taxes
- −$1,485
- − Insurance
- −$495
- − Repairs & maintenance
- −$1,914
- − Management
- −$1,914
- − Depreciation
- −$2,880
- Taxable income
- $9,692
- Est. tax owed @ 24.0%
- −$2,326
- After-tax cash flow
- $8,365/yr
For passive investors: Depreciation is non-cash, so a rental often shows a tax loss while cash-flowing — sheltering income. Rental losses are passive: they offset passive income freely, and up to $25,000/yr can offset ordinary (W-2) income if you actively participate and your MAGI is under $100k (phasing out to $0 by $150k); unused losses carry forward. On sale, claimed depreciation is recaptured at up to 25%, and gains may owe capital-gains tax (a 1031 exchange can defer both). Figures are a year-1 estimate at your 24.0% rate — not tax advice; consult a CPA.
Condition & rehab AI · 1 photo
This 1088 square foot mobile home is in good condition with no visible repairs needed. It has the potential for minor updates to enhance its curb appeal and interior aesthetics, increasing its value for both resale and rental.
Value-add opportunities
- Both Painting the exterior and interior — Fresh paint can enhance the home's curb appeal and interior aesthetics.
- Both Landscaping improvements — Well-maintained landscaping can increase both resale and rental value.
- Both Upgrading the HVAC system — A modern HVAC system can improve comfort and energy efficiency, boosting both resale and rental value.
- Both Adding smart home features — Smart home features can enhance convenience and appeal to potential buyers or renters, increasing both resale and rental value.
Renovation cost estimate screening
Value-add ROI direction
- Both Painting the exterior and interior — Fresh paint can enhance the home's curb appeal and interior aesthetics. ↑
- Both Landscaping improvements — Well-maintained landscaping can increase both resale and rental value. ↑
- Both Upgrading the HVAC system — A modern HVAC system can improve comfort and energy efficiency, boosting both resale and rental value. ↑
- Both Adding smart home features — Smart home features can enhance convenience and appeal to potential buyers or renters, increasing both resale and rental value. ↑
ⓘ Cost ranges are severity-bucket heuristics (US national rule-of-thumb). Get contractor quotes + a written scope before underwriting a rehab budget.
Schools (NCES district)
- District
- Duval
- NCES district ID
- 1200480
- Math proficiency
- 46% ▼ -11.00%
- Reading proficiency
- 45% ▼ -4.00%
- Median HH income
- $48,987
- Composite
- 38.97/100
- National rank
- #4076
- State rank
- #48 of 73 in FL
Livability — Jacksonville
- Score
- 83/100
- State rank
- #50
- US rank
- #911
Category grades
Schools grade is shown separately in the Schools card above.
Census & demographics
- Census place
- Jacksonville, FL
- County
- Duval County · 1,015,274 people
- City population
- 979,034
- Metro
- Jacksonville, FL
- Population (ZIP)
- 63,592
- Household income
- $62,204
- Rent vs Own
- Severe rent burden
- 2799.0
Population outlook (Duval County) Hauer SSP2
- Today (2025)
- 1,013,010 people
- By 2030
- 1,059,228 · +4.6%
- By 2040
- 1,141,439 · +12.7%
- By 2050
- 1,205,258 · +19.0%
- By 2075
- 1,324,282 · +30.7%
- By 2100
- 1,319,620 · +30.3%
Race, ethnicity, and origin ACS 2023
- Neighborhood character
- Highly diverse neighborhood (Simpson 0.70)
- Race & ethnicity
- White 39% Black 35% Hispanic / Latino 15% Two or more races 10% Asian 6%
- Hispanic origin (detail)
- Mexican 3% Puerto Rican 6% Cuban 3%
- Common ancestry
- Hispanic 1% Lithuanian 1% Romanian 1%
- Foreign-born
- 12% · Canada, Vietnam, China
- Languages at home
- 83% English-only · Spanish 9% Tagalog/Filipino 3% French/Haitian/Cajun 2%
Political lean MEDSL · Duval
- 2024 margin
- Toss-up / Even · D 48.7% · R 50.1% · Other 1.2%
- 2008→2024 swing
- +0.4pp no change · 2008: -1.9pp · 2024: -1.5pp
- All cycles
- 2024: R+1.5 2020: D+3.8 2016: R+1.5 2012: R+3.6 2008: R+1.9
Not yet ingested
- Civics
- —
Market trends
- HPI YoY
- ▼ -64.22%
- Current HPI
- 296.5375
- Rent YoY
- ▲ 2.25%
- Metro
- Jacksonville, FL
- State GDP YoY
- ▲ 3.28%
- F500 in state
- 36
Industry mix (Fortune 500 HQ in FL)
| Industry | F500 HQs | Revenue |
|---|---|---|
| Industrial Technology | 2 | $29B |
|
||
| Insurance | 2 | $17B |
|
||
| Retail | 1 | $60B |
|
||
| Technology Distribution | 1 | $58B |
|
||
| Homebuilding | 1 | $35B |
|
||
| Technology Manufacturing | 1 | $35B |
|
||
Price history
1 event — show timeline
- 2026-06-09 Listed $99,000 FSBO.com
Cash-flow waterfall
monthlySold comps — $/sqft
last 12 mo · ≤1 miLoading sold comps…