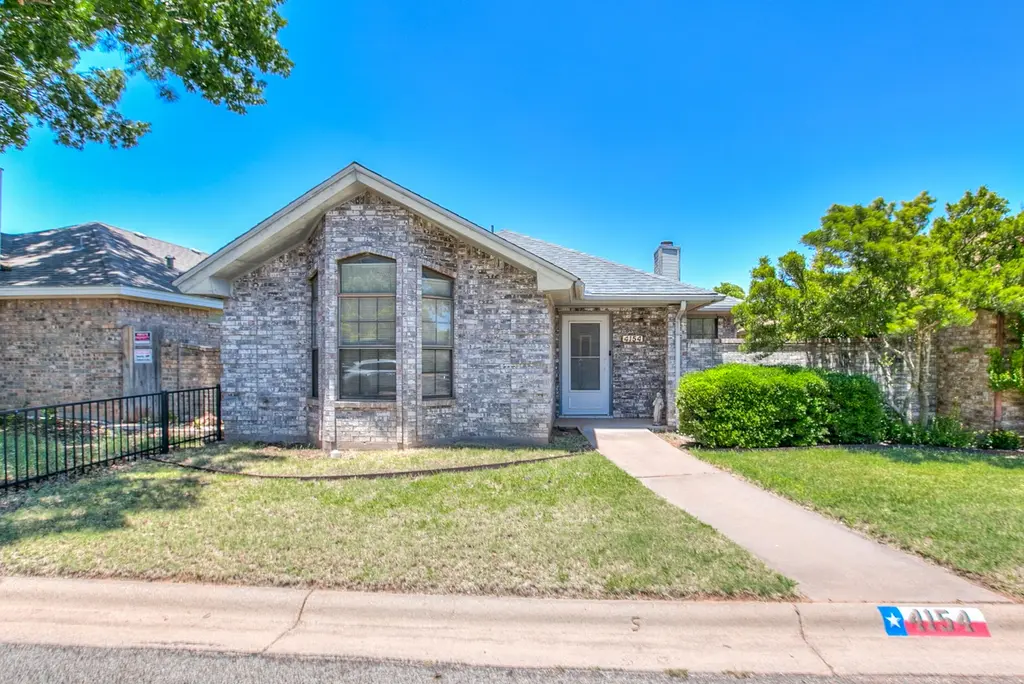
4154 Laurel Oak Dr · San Angelo, TX
Flood risk 1/10 · Minimal
- FEMA flood zone
- X (unshaded)
- Chance of flooding over 30 yrs
- 0.0%
- Est. flood insurance / yr
- $507 – $1,088
Fire risk 8/10 · Major
- Est. fire insurance / yr
- $1,222 – $2,270
Heat risk 7/10 · Major
- Hot days now (above 104°F)
- 7 days/yr
- Hot days in 30 yrs
- 24 days/yr
Wind risk 4/10 · Minor
- Chance of severe wind over 30 yrs
- 14.0%
Air-quality risk 2/10 · Minimal
- Unhealthy air days now
- 0 days/yr
- Unhealthy air days in 30 yrs
- 1 days/yr
Risk factors via First Street. Map © Google.
Why this score? — see what drove the D grade
The composite is a weighted blend of 9 inputs, each scored 0–100. Each bar is that input's sub-score; the figure is the points it added to the 100-point composite (weight × sub-score).
- ARV discount +12.2/15.0
- Cash flow +11.0/30.0
- 1% rule +4.0/10.0
- Rent growth +4.0/5.0
- Livability +3.7/5.0
- DSCR +3.2/10.0
- Schools +2.6/10.0
- Condition / age +2.5/5.0
- Appreciation +0.0/10.0
$220,000
🖨 Deal sheet (PDF) 📄 Offer letter ✓ Due diligence
Listing remarks
Welcome home to this charming 2-bedroom, 2-bath patio home located on a quiet street in Southwest San Angelo. Featuring a desirable split-bedroom arrangement, this home offers privacy and comfort for homeowners and guests alike. The open-concept floor plan creates a spacious feel, seamlessly connecting the living, dining, and kitchen areas—perfect for everyday living and entertaining. While the home reflects its original character, it has been well maintained and provides an excellent opportunity to add your personal touch. Conveniently situated just minutes from shopping, dining, and other amenities, this property combines a peaceful location with easy access to everything you need.
Key facts
- Peaceful location
- 4,400 sq ft lot
- 2 garage spots
Tags
Property features AI
Exterior
- Parking: Attached garage with 2 spaces; Driveway; Garage door opener; Alley access
- Utilities: Public water; Public sewer; Electricity connected; Natural gas connected; Water connected
- Home design: Single family residence; One story
- Construction: Brick construction; Composition roof; Slab foundation; Built in 2026
- Exterior features: Covered patio; Privacy fencing; Interior lot; Paved city street with public maintenance
Interior
- Kitchen: Dishwasher; Electric range; Microwave
- Flooring: Carpet; Laminate
- Bathrooms: 2 full bathrooms
- Heating & cooling: Central heating (natural gas); Central air conditioning (electric); Ceiling fans
- Interior features: Pantry; Ceiling fans; Double pane windows; Gas log fireplace in the living room
- Laundry & utility: Dedicated laundry room; Gas water heater
Neighborhood map
What this means for you Summary
Snapshot
- This is a 2-bed/2.0-bath single-family listed at $220k.
Deal economics
- At list price, monthly cash flow is $-92 ($-1k/yr) — negative.
- To cash-flow at today's rent, offer at most $204k (7.4% below list).
- To meet the 1% rule (rent ≥ 1% of price), the offer needs to be $197k (10.5% below list).
- Recommended offer: $197k (10.5% below list) — sets the bar for 1% rule.
- Cap rate 5.8% vs local median 3.8% in San Angelo — top-decile yield for the area; either an underpriced asset or a hidden risk that comps aren't pricing in. Stress-test before assuming the spread holds.
Location & tenants
- Location reads 73/100 on livability (#199 in TX) — a middle-class / working-renter tenant base. Strengths: cost of living A+, housing A+, health & safety A+; Watch: employment C-, amenities F, commute F.
- San Angelo ISD (urban): math 27% / reading 33% proficiency, ranked #627 of 826 in TX (top 76%) — families likely to look elsewhere, expect single-tenant / working-renter base with shorter leases.
- Zoned schools: Bonham El (math 40% / reading 43%, grade F, #1,437 of 4,322 statewide, top 34%, 525 students, 40% FRL); Lone Star Middle (math 28% / reading 32%, grade F, #1,056 of 1,662 statewide, top 65%, 903 students, 63% FRL); Central H S (math 22% / reading 43%, grade F, #1,029 of 1,632 statewide, top 64%, 3,065 students, 48% FRL) — zoned schools at 50% FRL track the district average.
- Market conditions: Rents rising fast (+6.0%/yr); 525 active listings in the ZIP; 15 comparable units currently listed for rent nearby; rentals at typical pace (median 23d on market — plan ~3-4 weeks tenant-placement turnaround); solid renter incomes; 233 units permitted in Tom Green County in 2024 (0 in 5+ unit buildings).
Forward outlook
- Local home prices are declining (-3.0%/yr); year-one equity from $2k of loan paydown is wiped out by about $7k of value loss. Plan a longer hold.
- Tom Green County population projected at +35% by 2050 — long-run rental-demand tailwind backs the buy-and-hold thesis.
Negotiation context
- Only 2 days on market — expect competitive offers; lowballing is unlikely to land.
Risks & watch-outs
- Climate carrying-cost: severe wildfire risk; extreme-heat days projected 7→24/yr by 2055 (HVAC capex compounding) — expect insurance premiums to compound above CPI over the hold.
Questions for the listing agent
- What do current leases actually rent for vs. the listed asking? Can we see a recent rent roll and the last 12 months of T-12 income?
- Is there a deadline driving the sale (1031 exchange, divorce, estate, relocation)? That informs how much negotiation room exists.
- Schools are F-rated, which usually means shorter tenancies and higher turnover. Who's the typical renter profile here, and what's been the actual vacancy rate?
- The area grade is low — what's the realistic commute time and amenity access for the typical tenant pool here? Any planned neighborhood developments (good or bad) we should know about?
- What's the average days-on-market for RENTAL listings here right now (not sales)? A rising rental-DOM trend means longer vacancies and softer asking-rent achievability than the comps imply.
- What's the recent tenant-quality profile in this submarket — average credit score on applications, eviction rate, late-payment / NSF rate, and stable-employment percentage? A property-management company in the area should have these aggregated.
- How much new for-sale + rental construction is in the pipeline within 1–3 miles? Heavy new supply typically softens prices + rents 12–24 months out; constrained supply supports both.
Investment metrics
- 1% rule
- 0.90% ✗
- Cap rate
- 5.79%
- Cash-on-cash
- -1.80%
- DSCR
- 0.92
- GRM
- 9.3
CMA / ARV
- ARV (on-the-fly)
- $245,480
- Comps found
- 12
Show comp detail 12 sales within ~0.75 mi
| Address | Dist | Beds/Ba | Sqft | Sold | Price | $/sf | Match |
|---|---|---|---|---|---|---|---|
| 4510 Juniper Ln | 0.14mi | 2/2.0 | 1,439 (-0%) | 1mo | $250,000 | $174 | 92 |
| 4121 Green Meadow Dr | 0.04mi | 3/2.0 (+1) | 1,432 (-1%) | 2mo | $239,900 | $168 | 90 |
| 4429 White Ash Ln | 0.09mi | 2/2.0 | 1,494 (+4%) | 3mo | $250,000 | $167 | 87 |
| 4321 Rimrock Ridge Cir | 0.17mi | 3/2.0 (+1) | 1,480 (+2%) | 0mo | $299,950 | $203 | 82 |
| 4445 Oak Grove Blvd | 0.27mi | 3/2.5 (+1) | 1,436 (-1%) | 2mo | $210,000 | $146 | 78 |
| 4513 Juniper Ln | 0.11mi | 2/2.0 | 1,604 (+11%) | 0mo | $248,000 | $155 | 76 |
| 5110 Oak Grove Blvd | 0.23mi | 3/2.0 (+1) | 1,519 (+5%) | 2mo | $299,900 | $197 | 74 |
| 4142 Laurel Oak Dr | 0.02mi | 2/1.0 | 1,241 (-14%) | 3mo | $209,900 | $169 | 69 |
| 4513 Bermuda Dr | 0.35mi | 2/1.5 | 1,319 (-9%) | 2mo | $205,000 | $155 | 66 |
| 4720 Pinon Ridge Dr | 0.47mi | 3/2.0 (+1) | 1,599 (+11%) | 2mo | $327,900 | $205 | 54 |
| 4613 Pinion Ridge Dr | 0.42mi | 3/2.0 (+1) | 1,645 (+14%) | 0mo | $279,900 | $170 | 52 |
| 5413 Coral Way | 0.53mi | 3/2.0 (+1) | 1,608 (+11%) | 2mo | $341,700 | $213 | 50 |
Match score weights: distance 35% · size 25% · config 20% · recency 20%. Top-matched comps best support the ARV.
Projected returns pro-forma
-3.0% appreciation · 6.03% rent growth · sell at horizon
- IRR
- -15.6%
- Equity multiple
- 0.43×
- Total profit
- $-35,236
- Equity at exit
- $32,803
- IRR
- -2.3%
- Equity multiple
- 0.82×
- Total profit
- $-10,794
- Equity at exit
- $19,022
Cash invested: $61,600 (down + closing). Projections, not guarantees.
Landlord ↔ Tenant lean methodology
- Overall (STATE)
- 87 Strongly Landlord-Friendly
- State Texas
- 87 Strongly Landlord-Friendly · R+5
- County
- — inherits STATE
- City
- — inherits STATE
ZIP-level market 76904
- Rents YoY
- 6.0%
- Active inventory
- 525
- Price-to-rent
- 9.3×
Monthly cashflow live
- Estimated rent
- $1,970 high interval (Pro) →
- Mortgage (P&I)
- −$1,154
- Tax from tax record
- −$403 /mo · $4,839/yr
- Insurance
- −$92
- HOA
- −$0
- Vacancy / Maint / Mgmt
- −$414
- Net cashflow
- $-92
Break-even live
Sensitivity live
| Price | -10% $32 | -5% $-30 | +0% $-92 | +5% $-155 | +10% $-217 |
|---|---|---|---|---|---|
| Rent | -10% $-248 | -5% $-170 | +0% $-92 | +5% $-15 | +10% $63 |
| Rate | -1.0pp $18 | -0.5pp $-36 | base $-92 | +0.5pp $-149 | +1.0pp $-207 |
UW: 25.0% down · 7.5% · 30yr · 1.5% tax · 5.0% vac · 8.0% maint · 8.0% mgmt
Financing live
Cash to close
- Down payment
- $55,000
- Closing costs
- $6,600
- Reserves months
- —
- Total cash needed
- —
Loan-product check · same deal, 3 products live
Conventional
25% down · 7.5% · 30yr
- Down + closing
- —
- Monthly P&I
- —
- Monthly cashflow
- —
- DSCR
- —
- Eligible?
- —
Personal DTI + credit; lowest rate.
DSCR
20% down · 8.5% · 30yr
- Down + closing
- —
- Monthly P&I
- —
- Monthly cashflow
- —
- DSCR
- —
- Eligible?
- —
No personal income docs; deal must DSCR.
Hard money
10% down · 12.0% · 12mo
- Down + closing
- —
- Monthly P&I
- —
- Monthly cashflow
- —
- DSCR
- —
- Eligible?
- —
Short-term bridge; refi at stabilization.
Rent comps 15 comps
| Address | Beds | Baths | Sqft | Rent | $/sqft | DOM | Units | Dist |
|---|---|---|---|---|---|---|---|---|
| 4429 White Ash Ln San Angelo, TX | 2.0 | 2.0 | 1494 | $2,400 | $1.61 | 45d | 1 | 0.05mi |
| 4330 Rimrock Cir San Angelo, TX | 3.0 | 2.0 | 1560 | $2,200 | $1.41 | 23d | 1 | 0.21mi |
| 4133 Shefflera Dr San Angelo, TX | 3.0 | 2.0 | 1560 | $2,300 | $1.47 | 23d | 1 | 0.23mi |
| 4302 Pinion Ridge Dr San Angelo, TX | 3.0 | 2.0 | 1750 | $2,075 | $1.19 | 23d | 1 | 0.25mi |
| 4802 Royal Oak Dr San Angelo, TX | 3.0 | 2.0 | 1798 | $2,300 | $1.28 | 45d | 1 | 0.37mi |
| 4418 Southwest Blvd San Angelo, TX | 1.0–2.0 | 1.0 | 801 | $1,136 | $1.42 | 23d | 21 | 0.63mi |
| 3326 Rock Brook Dr San Angelo, TX | 1.0–2.0 | 1.0–2.0 | 886 | $1,205 | $1.36 | 23d | 13 | 0.79mi |
| 6133 Sherwood Way San Angelo, TX | 1.0–3.0 | 1.0–2.0 | 983 | $1,766 | $1.80 | 23d | 35 | 0.79mi |
| 3617 Dominion Rdg San Angelo, TX | 3.0 | 2.0 | 1652 | $2,300 | $1.39 | 23d | 1 | 0.83mi |
| 4110 Wellington St San Angelo, TX | 1.0–2.0 | 1.0–2.0 | 881 | $1,145 | $1.30 | 23d | 4 | 0.89mi |
| 5910 Southampton Pl San Angelo, TX | 3.0 | 2.0 | 1596 | $2,100 | $1.32 | 23d | 1 | 0.95mi |
| 5921 Stratford Ave San Angelo, TX | 3.0 | 2.0 | 1738 | $2,400 | $1.38 | 23d | 1 | 1.05mi |
| 707 Wicklow Ct San Angelo, TX | 3.0 | 2.0 | 1576 | $2,000 | $1.27 | 45d | 1 | 1.17mi |
| 3410 Wildewood Dr San Angelo, TX | 1.0–2.0 | 1.0–2.0 | 882 | $975 | $1.10 | 23d | 2 | 1.23mi |
| 3609 High Meadow Dr San Angelo, TX | 2.0 | 2.0 | 1266 | $2,400 | $1.90 | 45d | 1 | 1.26mi |
Listing history 2 events
-
2026-06-22remarks 693-char remark
-
2026-06-22$220,000 Active 2 DOM
ⓘ Source: listings_history table (triggers on properties + properties_extension) + one-shot
backfill from property_details.listing_events for pre-trigger history.
Tax reassessment forecast TX · Resets to sale price
- Current annual tax
- $4,839 · $403/mo
- Projected year-2 tax
- $4,839 · $403/mo
- Expected delta
- $0/yr ($0/mo · 0.0%)
ⓘ Screening estimate from a state-policy table — verify with the county assessor before closing.
Climate risk First Street
- Flood 1/10 Low FEMA zone X (unshaded) · 0% chance over 30 yrs
- Wildfire 8/10 Severe
- Heat 7/10 Severe 7 d/yr ≥104°F today · 24 d/yr by 30 yrs out
- Wind 4/10 Moderate 14% chance of damaging wind over 30 yrs
- Air quality 2/10 Low 0 unhealthy d/yr today · 1 by 30 yrs out
Nearby sold comps map
Loading sold comps map…
Walkable amenities ~0.75 mi
Loading nearby amenities…
Taxation est. · year 1
- Rental income
- $23,640
- − Mortgage interest
- −$12,323
- − Property taxes
- −$4,839
- − Insurance
- −$1,100
- − Repairs & maintenance
- −$1,891
- − Management
- −$1,891
- − Depreciation
- −$6,400
- Taxable loss
- −$4,805
- Est. tax savings @ 24.0%
- +$1,153
- After-tax cash flow
- $45/yr
For passive investors: Depreciation is non-cash, so a rental often shows a tax loss while cash-flowing — sheltering income. Rental losses are passive: they offset passive income freely, and up to $25,000/yr can offset ordinary (W-2) income if you actively participate and your MAGI is under $100k (phasing out to $0 by $150k); unused losses carry forward. On sale, claimed depreciation is recaptured at up to 25%, and gains may owe capital-gains tax (a 1031 exchange can defer both). Figures are a year-1 estimate at your 24.0% rate — not tax advice; consult a CPA.
Schools (NCES district)
- District
- San Angelo ISD
- NCES district ID
- 4838700
- Math proficiency
- 27% ▼ -9.00%
- Reading proficiency
- 33% ▼ -3.00%
- Median HH income
- $43,501
- Composite
- 25.56/100
- National rank
- #7427
- State rank
- #627 of 826 in TX
Livability — San Angelo
- Score
- 73/100
- State rank
- #199
- US rank
- #5030
Category grades
Schools grade is shown separately in the Schools card above.
Census & demographics
- Census place
- San Angelo, TX
- County
- Tom Green County · 113,188 people
- City population
- 81,357
- Metro
- San Angelo, TX
- Population (ZIP)
- 36,954
- Household income
- $81,833
- Rent vs Own
- Severe rent burden
- 778.0
Population outlook (Tom Green County) Hauer SSP2
- Today (2025)
- 135,110 people
- By 2030
- 144,090 · +6.6%
- By 2040
- 162,561 · +20.3%
- By 2050
- 182,158 · +34.8%
- By 2075
- 232,274 · +71.9%
- By 2100
- 268,218 · +98.5%
Race, ethnicity, and origin ACS 2023
- Neighborhood character
- Majority White (60%)
- Race & ethnicity
- White 60% Hispanic / Latino 30% Two or more races 17% Black 4% Asian 3%
- Hispanic origin (detail)
- Mexican 26%
- Common ancestry
- Slovak 2% Lithuanian 2% Italian 1%
- Foreign-born
- 5% · Canada
- Languages at home
- 82% English-only · Spanish 15% Tagalog/Filipino 1%
Political lean MEDSL · Tom Green
- 2024 margin
- Solid R (+48.0) · D 25.5% · R 73.5% · Other 1.0%
- 2008→2024 swing
- -6.3pp toward R · 2008: -41.7pp · 2024: -48.0pp
- All cycles
- 2024: R+48.0 2020: R+44.4 2016: R+47.9 2012: R+47.9 2008: R+41.7
Not yet ingested
- Civics
- —
Market trends
- HPI YoY
- ▼ -299.76%
- Current HPI
- 176.0366
- Rent YoY
- ▲ 6.03%
- Metro
- San Angelo, TX
- State GDP YoY
- ▲ 3.95%
- F500 in state
- 110
Industry mix (Fortune 500 HQ in TX)
| Industry | F500 HQs | Revenue |
|---|---|---|
| Energy | 16 | $1,198B |
|
||
| Technology | 5 | $198B |
|
||
| Engineering / Construction | 4 | $72B |
|
||
| Energy Services | 3 | $60B |
|
||
| Utilities | 3 | $41B |
|
||
| Healthcare | 2 | $330B |
|
||
Price history
2 events — show timeline
- 2026-06-19 Listed $220,000 SAAR TX
- 2005-07-22 Sold (Public Records) — Public Records
Property tax history
+2.9%/yrLatest (2025): $4,839 · +25.1% YoY. Source: county tax records.
Cash-flow waterfall
monthlySold comps — $/sqft
last 12 mo · ≤1 miLoading sold comps…