 Triplex
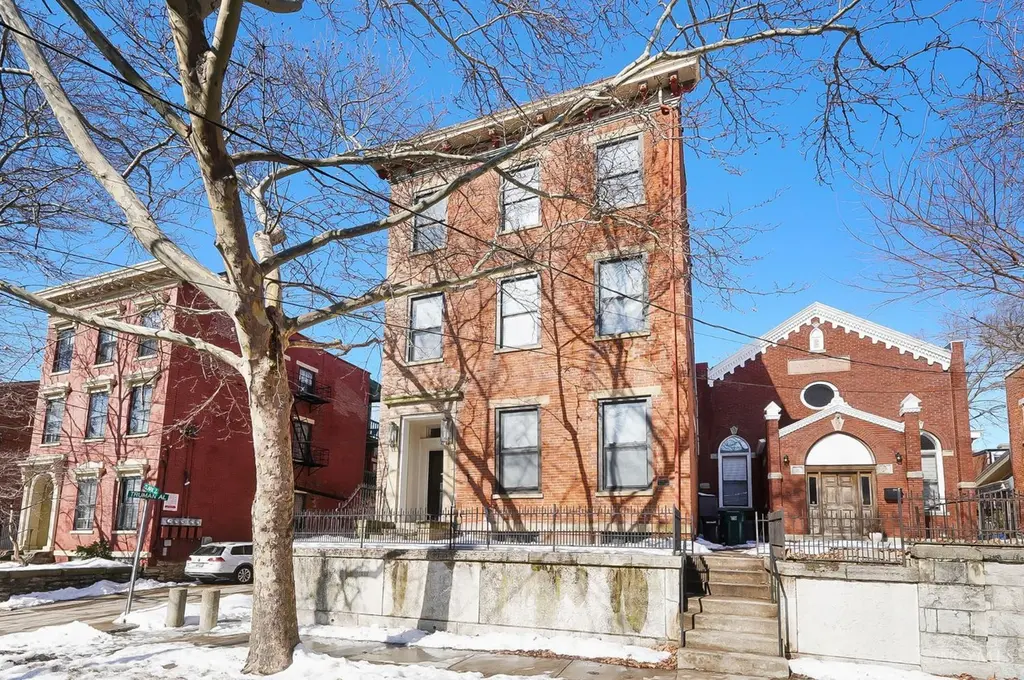
422 Clark St · Cincinnati, OH
Flood risk 1/10 · Minimal
- FEMA flood zone
- X (unshaded)
- Chance of flooding over 30 yrs
- 0.0%
- Est. flood insurance / yr
- $473 – $860
Fire risk 1/10 · Minimal
- Est. fire insurance / yr
- $713 – $1,323
Heat risk 5/10 · Moderate
- Hot days now (above 103°F)
- 7 days/yr
- Hot days in 30 yrs
- 20 days/yr
Wind risk 2/10 · Minimal
- Chance of severe wind over 30 yrs
- 1.0%
Air-quality risk 3/10 · Minor
- Unhealthy air days now
- 2 days/yr
- Unhealthy air days in 30 yrs
- 3 days/yr
Risk factors via First Street. Map © Google.
Why this score? — see what drove the B+ grade
The composite is a weighted blend of 9 inputs, each scored 0–100. Each bar is that input's sub-score; the figure is the points it added to the 100-point composite (weight × sub-score).
- Cash flow +30.0/30.0
- 1% rule +10.0/10.0
- DSCR +10.0/10.0
- ARV discount +7.5/15.0
- Appreciation +6.1/10.0
- Livability +4.0/5.0
- Rent growth +2.5/5.0
- Schools +2.5/10.0
- Condition / age +2.5/5.0
$975,000
🖨 Deal sheet (PDF) 📄 Offer letter ✓ Due diligence
Multi-family units
County records classify this as Multi-Family (2-4 Unit). Listing-text estimate: 3 units. confirmed
Listing remarks MLS
Historic Gamble House (circa 1850) in the West End's vibrant Betts-Longworth District*Beautifully restored from top-to-bottom w/three updated 3-bedroom units renovated w/modern finishes throughout*Spacious layouts w/abundant natural light + generously sized rooms*Updated kitchens w/contemporary cabinetry & appliances*Refreshed baths w/newer vanities & fixtures*In-unit laundry*Private balconies*Turnkey investment and/or ideal owner-occupant opportunity w/strong rental potential in rapidly developing West End*Prime location steps to TQL Stadium, Washington Park, Downtown, OTR, dining & entertainment w/convenient access to major highways & employment centers*Rare opportunity to own a piece of Cincinnati history.
Key facts
- Private balconies
- Fully leased units
- In unit laundry
Tags
Property features AI
Finance
- Financial info: Property configured as a 3-unit income property; Unit rents recorded: $2,445; $2,000; $2,645; 3+ bedroom units rent shown as $2,645
Exterior
- Parking: On-street parking
- Security: Security system
- Utilities: Public water; Public sewer; Natural gas
- Home design: Triplex; Three-plus levels; Entry and layout across multiple stories
- Construction: Brick construction; Built-up roof; Stone foundation; Second floor area recorded (4,400)
- Exterior features: Balcony; Fire escape; Busline nearby
Interior
- Bedrooms: Three 3-bedroom units (each unit has 3 bedrooms)
- Bathrooms: Each unit: 2 full bathrooms and 1 partial bathroom
- Heating & cooling: Central air conditioning; Forced air heating (gas); Separate furnaces and separate A/C for units; Separate gas and electric meters
- Interior features: Security system; Intercom; Smoke alarm; Individual laundry; Full basement
- Laundry & utility: Individual laundry for units
Neighborhood map
What this means for you Summary
Snapshot
- This is a 3 × 3-bed/1-bath units multifamily listed at $975k.
Deal economics
- At list price, monthly cash flow is $6k ($73k/yr) — positive. Per door: $2k/mo.
- The deal already cash-flows at list — no discount required.
- Meets the 1% rule at list price ($16k rent vs $975k).
- Recommended offer: $946k (3.0% below list) — sets the bar for market timing.
Location & tenants
- Location reads 80/100 on livability (#130 in OH, #1,856 nationally) — a professional / high-income tenant draw. Strengths: amenities A+, commute A+, cost of living A+; Watch: employment D, crime F.
- Cincinnati Public Schools (urban): math 25% / reading 36% proficiency, ranked #581 of 656 in OH (top 89%) — families likely to look elsewhere, expect single-tenant / working-renter base with shorter leases; 70% free/reduced lunch — lower-income household profile, screen leases tightly.
- Zoned schools: Sands Montessori School (math 70% / reading 77%, grade A, #311 of 1,584 statewide, top 20%, 683 students, 22% FRL); Hartwell School (math 17% / reading 31%, grade F, #593 of 654 statewide, top 91%, 447 students, 0% FRL); Walnut Hills High School (math 79% / reading 89%, grade A, #17 of 781 statewide, top 2%, 2,582 students, 14% FRL) — zoned schools average 12% FRL vs 70% district-wide (59 pts lower); this property's tenant base skews higher-income than the district average.
- Zoned-school proficiency averages 60% at this address vs 30% district-wide (+30 pts) — the actual schools serving this property are materially stronger than the Cincinnati Public Schools average implies; a family-tenant draw the district grade alone would hide.
- Market conditions: 13 active listings in the ZIP; 1 comparable units currently listed for rent nearby; lower-income renter base — watch delinquency; 801 units permitted in Hamilton County in 2024 (190 in 5+ unit buildings).
Forward outlook
- In year one you build about $28k of equity ($7k loan paydown + $21k appreciation (2.1% local appreciation)).
- At projected returns (2.1% appreciation + 3.0% rent growth), your $273k cash investment doubles in ~3 years — after that, you're playing with house money.
- By year 3, paydown + projected appreciation supports a ~$70k cash-out refi (75% LTV) — recoverable capital for the next deal without selling this one.
Negotiation context
- It's been on market 38 days — a 3% lower offer ($946k) is reasonable based on typical stale-listing flexibility.
- 4 sale attempts since 2y ago with the ask held roughly flat each time — persistent listings suggest the price (not the market) is what's stuck; bring a comps-based counter.
- Current owner paid $164k; list at $975k implies a 495% gain — meaningful room to come down on a strong offer.
Risks & watch-outs
- Watch-outs: built in 1850 — expect roof / HVAC / electrical / plumbing capex.
- Climate carrying-cost: extreme-heat days projected 7→20/yr by 2055 (HVAC capex compounding) — expect insurance premiums to compound above CPI over the hold.
Questions for the listing agent
- It's been on market 38 days. Have you received any prior offers? Is the seller open to a 3% concession, seller financing, or rate buy-down credit?
- Can we see the unit-by-unit rent roll, current vacancy, and any below-market leases? What's the average tenancy length?
- What capital expenditures (roof, boiler, parking lot, exteriors) have been made in the last 5 years, and what's planned in the next 2?
- Built in 1850 — when were the roof, HVAC, electrical panel, plumbing, and water heater last replaced?
- Is there a deadline driving the sale (1031 exchange, divorce, estate, relocation)? That informs how much negotiation room exists.
- Schools are B-rated — typically a magnet for longer-tenancy family renters. What's the average tenant stay here, and is there a school-zone premium baked into asking?
- Crime grade is F in this area — have there been break-ins, vandalism, or insurance claims at this property in the last 3 years? What carrier currently insures it and at what premium?
- What's the average days-on-market for RENTAL listings here right now (not sales)? A rising rental-DOM trend means longer vacancies and softer asking-rent achievability than the comps imply.
- What's the recent tenant-quality profile in this submarket — average credit score on applications, eviction rate, late-payment / NSF rate, and stable-employment percentage? A property-management company in the area should have these aggregated.
- How much new apartment / multifamily construction is in the pipeline within 1–3 miles? Heavy new supply (>2% of stock underway) typically softens rents 12–24 months out; light construction supports rent growth.
Investment metrics
- 1% rule
- 1.59% ✓
- Cap rate
- 13.77%
- Cash-on-cash
- 26.69%
- DSCR
- 2.19
- GRM
- 5.2
CMA / ARV
No comps found within radius.
Projected returns pro-forma
2.15% appreciation · 3.0% rent growth · sell at horizon
- IRR
- 31.1%
- Equity multiple
- 2.69×
- Total profit
- $460,976
- Equity at exit
- $392,602
- IRR
- 32.3%
- Equity multiple
- 5.23×
- Total profit
- $1,154,576
- Equity at exit
- $571,591
Cash invested: $273,000 (down + closing). Projections, not guarantees.
Landlord ↔ Tenant lean methodology
- Overall (STATE)
- 73 Landlord-Friendly
- State Ohio
- 73 Landlord-Friendly · R+6
- County
- — inherits STATE
- City
- — inherits STATE
ZIP-level market 45203
- Home prices YoY
- 1.2%
- Active inventory
- 13
- Price-to-rent
- 15.7×
Monthly cashflow live
- Estimated rent
- $15,508 high interval (Pro) →
- Mortgage (P&I)
- −$5,113
- Tax from tax record
- −$661 /mo · $7,929/yr
- Insurance
- −$406
- HOA
- −$0
- Vacancy / Maint / Mgmt
- −$3,257
- Net cashflow
- $6,071
Break-even live
Sensitivity live
| Price | -10% $6,623 | -5% $6,347 | +0% $6,071 | +5% $5,795 | +10% $5,519 |
|---|---|---|---|---|---|
| Rent | -10% $4,846 | -5% $5,459 | +0% $6,071 | +5% $6,684 | +10% $7,296 |
| Rate | -1.0pp $6,562 | -0.5pp $6,319 | base $6,071 | +0.5pp $5,819 | +1.0pp $5,562 |
3-unit breakdown (identical units grouped — click to expand)
| Units | Beds | Baths | Est. rent |
|---|---|---|---|
| 3× units | 3 | 1 | $15,507 |
| #1 | 3 | 1 | $5,169 |
| #2 | 3 | 1 | $5,169 |
| #3 | 3 | 1 | $5,169 |
| Total (3 units) | $15,508 | ||
UW: 25.0% down · 7.5% · 30yr · 1.5% tax · 5.0% vac · 8.0% maint · 8.0% mgmt
Financing live
Cash to close
- Down payment
- $243,750
- Closing costs
- $29,250
- Reserves months
- —
- Total cash needed
- —
Loan-product check · same deal, 3 products live
Conventional
25% down · 7.5% · 30yr
- Down + closing
- —
- Monthly P&I
- —
- Monthly cashflow
- —
- DSCR
- —
- Eligible?
- —
Personal DTI + credit; lowest rate.
DSCR
20% down · 8.5% · 30yr
- Down + closing
- —
- Monthly P&I
- —
- Monthly cashflow
- —
- DSCR
- —
- Eligible?
- —
No personal income docs; deal must DSCR.
Hard money
10% down · 12.0% · 12mo
- Down + closing
- —
- Monthly P&I
- —
- Monthly cashflow
- —
- DSCR
- —
- Eligible?
- —
Short-term bridge; refi at stabilization.
Rent comps 1 comps
| Address | Beds | Baths | Sqft | Rent | $/sqft | DOM | Units | Dist |
|---|---|---|---|---|---|---|---|---|
| 1059 Celestial St Cincinnati, OH | 4.0 | 3.5 | 6778 | $15,000 | $2.21 | 26d | 1 | 1.21mi |
Listing history 23 events
-
2026-06-21days on market $975,000 Active 38 DOM
-
2026-06-18days on market $975,000 Active 35 DOM
-
2026-06-17days on market $975,000 Active 34 DOM
-
2026-06-16days on market $975,000 Active 33 DOM
-
2026-06-15days on market $975,000 Active 32 DOM
-
2026-06-13days on market $975,000 Active 30 DOM
-
2026-06-13days on market $975,000 Active 29 DOM
-
2026-06-09days on market $975,000 Active 26 DOM
-
2026-06-08days on market $975,000 Active 25 DOM
-
2026-06-07days on market $975,000 Active 24 DOM
-
2026-06-03days on market $975,000 Active 20 DOM
-
2026-06-02days on market $975,000 Active 19 DOM
-
2026-06-01days on market $975,000 Active 18 DOM
-
2026-05-31days on market $975,000 Active 17 DOM
-
2026-05-14historical 734-char remark
Show marketing remark (734 chars)
Historic Gamble House (circa 1850) in the West End's vibrant Betts-Longworth District*Beautifully restored from top-to-bottom w/three updated 3-bedroom units renovated w/modern finishes throughout*Spacious layouts w/abundant natural light + generously sized rooms*Updated kitchens w/contemporary cabinetry & appliances*Refreshed baths w/newer vanities & fixtures*In-unit laundry*Private balconies*Turnkey investment and/or ideal owner-occupant opportunity w/strong rental potential in rapidly developing West End*Prime location steps to TQL Stadium, Washington Park, Downtown, OTR, dining & entertainment w/convenient access to major highways & employment centers*Rare opportunity to own a piece of Cincinnati history.
-
2026-05-14$975,000 Active
Show marketing remark (734 chars)
Historic Gamble House (circa 1850) in the West End's vibrant Betts-Longworth District*Beautifully restored from top-to-bottom w/three updated 3-bedroom units renovated w/modern finishes throughout*Spacious layouts w/abundant natural light + generously sized rooms*Updated kitchens w/contemporary cabinetry & appliances*Refreshed baths w/newer vanities & fixtures*In-unit laundry*Private balconies*Turnkey investment and/or ideal owner-occupant opportunity w/strong rental potential in rapidly developing West End*Prime location steps to TQL Stadium, Washington Park, Downtown, OTR, dining & entertainment w/convenient access to major highways & employment centers*Rare opportunity to own a piece of Cincinnati history.
-
2026-03-19price $995,000 734-char remark
Show marketing remark (734 chars)
Historic Gamble House (circa 1850) in the West End's vibrant Betts-Longworth District*Beautifully restored from top-to-bottom w/three updated 3-bedroom units renovated w/modern finishes throughout*Spacious layouts w/abundant natural light + generously sized rooms*Updated kitchens w/contemporary cabinetry & appliances*Refreshed baths w/newer vanities & fixtures*In-unit laundry*Private balconies*Turnkey investment and/or ideal owner-occupant opportunity w/strong rental potential in rapidly developing West End*Prime location steps to TQL Stadium, Washington Park, Downtown, OTR, dining & entertainment w/convenient access to major highways & employment centers*Rare opportunity to own a piece of Cincinnati history.
-
2026-02-12$1,095,000 Active 734-char remark
Show marketing remark (734 chars)
Historic Gamble House (circa 1850) in the West End's vibrant Betts-Longworth District*Beautifully restored from top-to-bottom w/three updated 3-bedroom units renovated w/modern finishes throughout*Spacious layouts w/abundant natural light + generously sized rooms*Updated kitchens w/contemporary cabinetry & appliances*Refreshed baths w/newer vanities & fixtures*In-unit laundry*Private balconies*Turnkey investment and/or ideal owner-occupant opportunity w/strong rental potential in rapidly developing West End*Prime location steps to TQL Stadium, Washington Park, Downtown, OTR, dining & entertainment w/convenient access to major highways & employment centers*Rare opportunity to own a piece of Cincinnati history.
-
2024-12-17historical $2,299
-
2024-11-27$2,299
-
2024-11-17historical $2,299
-
2024-11-08$2,299
-
1995-06-21soldstatus $164,000
ⓘ Source: listings_history table (triggers on properties + properties_extension) + one-shot
backfill from property_details.listing_events for pre-trigger history.
Tax reassessment forecast OH · Partial reset (capped growth)
- Current annual tax
- $7,929 · $661/mo
- Projected year-2 tax
- $11,570 · $964/mo
- Expected delta
- +$3,640/yr (+$303/mo · 45.9%)
ⓘ Screening estimate from a state-policy table — verify with the county assessor before closing.
Climate risk First Street
- Flood 1/10 Low FEMA zone X (unshaded) · 0% chance over 30 yrs
- Wildfire 1/10 Low
- Heat 5/10 Major 7 d/yr ≥103°F today · 20 d/yr by 30 yrs out
- Wind 2/10 Low 100% chance of damaging wind over 30 yrs
- Air quality 3/10 Moderate 2 unhealthy d/yr today · 3 by 30 yrs out
Nearby sold comps map
Loading sold comps map…
Walkable amenities ~0.75 mi
Loading nearby amenities…
Taxation est. · year 1
- Rental income
- $186,096
- − Mortgage interest
- −$54,615
- − Property taxes
- −$7,929
- − Insurance
- −$4,875
- − Repairs & maintenance
- −$14,888
- − Management
- −$14,888
- − Depreciation
- −$28,364
- Taxable income
- $60,538
- Est. tax owed @ 24.0%
- −$14,529
- After-tax cash flow
- $58,327/yr
For passive investors: Depreciation is non-cash, so a rental often shows a tax loss while cash-flowing — sheltering income. Rental losses are passive: they offset passive income freely, and up to $25,000/yr can offset ordinary (W-2) income if you actively participate and your MAGI is under $100k (phasing out to $0 by $150k); unused losses carry forward. On sale, claimed depreciation is recaptured at up to 25%, and gains may owe capital-gains tax (a 1031 exchange can defer both). Figures are a year-1 estimate at your 24.0% rate — not tax advice; consult a CPA.
Schools (NCES district)
- District
- Cincinnati Public Schools
- NCES district ID
- 3904375
- Math proficiency
- 25% ▼ -19.00%
- Reading proficiency
- 36% ▼ -14.00%
- Median HH income
- $35,743
- Composite
- 25.21/100
- National rank
- #7508
- State rank
- #581 of 656 in OH
Livability — Cincinnati
- Score
- 80/100
- State rank
- #130
- US rank
- #1856
Category grades
Schools grade is shown separately in the Schools card above.
Census & demographics
- Census place
- Cincinnati, OH
- County
- Hamilton · 838,887 people
- City population
- 505,555
- Metro
- Cincinnati, OH-KY-IN
- Population (ZIP)
- 2,530
- Household income
- $33,798
- Rent vs Own
- Severe rent burden
- 5.2
Population outlook (Hamilton County) Hauer SSP2
- Today (2025)
- 826,054 people
- By 2030
- 830,947 · +0.6%
- By 2040
- 832,319 · +0.8%
- By 2050
- 822,428 · -0.4%
- By 2075
- 788,688 · -4.5%
- By 2100
- 710,674 · -14.0%
Race, ethnicity, and origin ACS 2023
- Neighborhood character
- Diverse neighborhood (Simpson 0.59)
- Race & ethnicity
- Black 54% White 33% Asian 7% Two or more races 3% Hispanic / Latino 3%
- Common ancestry
- English 1% Serbian 1% Slovak 1%
- Foreign-born
- 7% · South Korea, China, Canada
- Languages at home
- 87% English-only · Korean 5% Russian/Polish/Slavic 5% Chinese 1%
Political lean MEDSL · Hamilton
- 2024 margin
- D (+14.9) · D 57.0% · R 42.1%
- 2008→2024 swing
- +7.9pp toward D · 2008: 7.0pp · 2024: 14.9pp
- All cycles
- 2024: D+14.9 2020: D+15.9 2016: D+9.5 2012: D+4.9 2008: D+7.0
Not yet ingested
- Civics
- —
Market trends
- HPI YoY
- ▲ 2.15%
- Current HPI
- 185.8445
- Rent YoY
- —
- Metro
- —
- State GDP YoY
- ▲ 1.98%
- F500 in state
- 48
Industry mix (Fortune 500 HQ in OH)
| Industry | F500 HQs | Revenue |
|---|---|---|
| Insurance | 3 | $145B |
|
||
| Industrial Machinery | 3 | $49B |
|
||
| Financial Services | 3 | $24B |
|
||
| Consumer Goods | 2 | $93B |
|
||
| Aerospace / Defense | 2 | $47B |
|
||
| Utilities | 2 | $33B |
|
||
Price history
+494.5% since first listed9 events — show timeline
- 2026-05-14 Listed $975,000 Cincy MLS
- 2026-05-14 Listing Removed — Cincy MLS
- 2026-03-19 Price Changed $995,000 Cincy MLS
- 2026-02-12 Listed $1,095,000 Cincy MLS
- 2024-12-17 Rental Removed $2,299 RENTALBEAST
- 2024-11-27 Listed for Rent $2,299 RENTALBEAST
- 2024-11-17 Rental Removed $2,299 RENTALBEAST
- 2024-11-08 Listed for Rent $2,299 RENTALBEAST
- 1995-06-21 Sold (Public Records) $164,000 Public Records
Property tax history
+10.2%/yrLatest (2025): $7,929 · +0.1% YoY. Source: county tax records.
Cash-flow waterfall
monthlySold comps — $/sqft
last 12 mo · ≤1 miLoading sold comps…