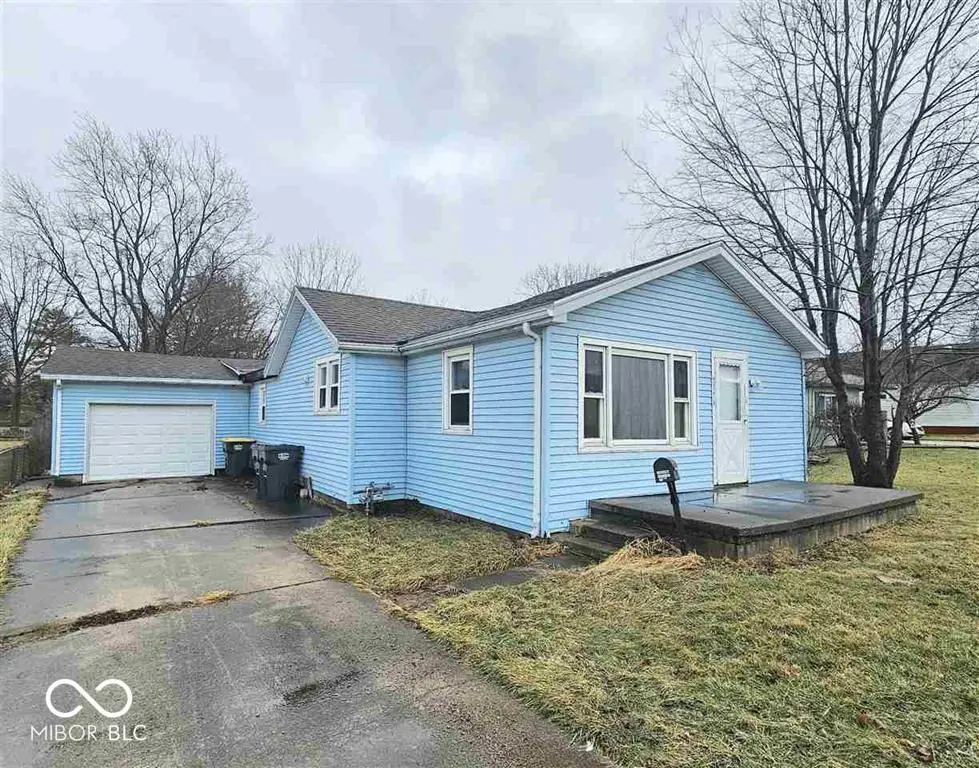
2334 Poplar St · Anderson, IN
Flood risk 1/10 · Minimal
- FEMA flood zone
- X (unshaded)
- Chance of flooding over 30 yrs
- 0.0%
- Est. flood insurance / yr
- $507 – $1,088
Fire risk 1/10 · Minimal
- Est. fire insurance / yr
- $717 – $1,331
Heat risk 3/10 · Minor
- Hot days now (above 100°F)
- 7 days/yr
- Hot days in 30 yrs
- 18 days/yr
Wind risk 2/10 · Minimal
- Chance of severe wind over 30 yrs
- —
Air-quality risk 3/10 · Minor
- Unhealthy air days now
- 2 days/yr
- Unhealthy air days in 30 yrs
- 3 days/yr
Risk factors via First Street. Map © Google.
Why this score? — see what drove the B+ grade
The composite is a weighted blend of 9 inputs, each scored 0–100. Each bar is that input's sub-score; the figure is the points it added to the 100-point composite (weight × sub-score).
- Cash flow +30.0/30.0
- ARV discount +15.0/15.0
- 1% rule +10.0/10.0
- DSCR +10.0/10.0
- Rent growth +3.0/5.0
- Livability +3.0/5.0
- Condition / age +2.5/5.0
- Schools +1.6/10.0
- Appreciation +0.0/10.0
$94,899
🖨 Deal sheet (PDF) 📄 Offer letter ✓ Due diligence
Listing remarks MLS
Charming and full of potential, this cute home at 2334 Poplar Street in Anderson, Indiana, is the perfect opportunity for both investors and homebuyers. Sold * * as-is * * , this property offers the chance to add your personal touch and make it your own. With its standout features and prime location, this home is not to be missed. The property boasts an ample-sized fenced-in yard, ideal for outdoor activities, gardening, or creating your private retreat. Inside, the large kitchen offers plenty of space for cooking, dining, and entertaining, making it the heart of the home. Additionally, the attached garage provides convenient parking and extra storage options. Situated in a great location, this home combines the ease of accessibility to local amenities with the charm of a quiet neighborhood setting. Call Brian Ingle at 765-960-0533.
Key facts
- Attached garage
- Large kitchen
- Quiet neighborhood
Tags
Property features AI
Exterior
- Parking: Attached 2-car garage (approx. 480 sq ft)
- Utilities: Public water; Municipal sewer connected; Solid waste service available
- Home design: Single-family residence; One story
- Construction: Vinyl siding; Crawl space foundation
- Exterior features: Lot of approximately 0.22 acre (under 1/4 acre)
Interior
- Kitchen: Kitchen on the main level (approx. 15.2 x 14.87)
- Bedrooms: Three bedrooms on the main level
- Bathrooms: One full bathroom on the main level
- Heating & cooling: Forced air heating; No central air conditioning
- Interior features: Appliances: None; Seven main-level rooms
Neighborhood map
What this means for you Summary
Snapshot
- This is a 4-bed/1.0-bath single-family listed at $95k.
Deal economics
- At list price, monthly cash flow is $485 ($6k/yr) — positive.
- The deal already cash-flows at list — no discount required.
- Meets the 1% rule at list price ($1k rent vs $95k).
- Recommended offer: $92k (3.0% below list) — sets the bar for market timing.
- Cap rate 12.4% vs local median 6.5% in Anderson — top-decile yield for the area; either an underpriced asset or a hidden risk that comps aren't pricing in. Stress-test before assuming the spread holds.
Location & tenants
- Location reads 60/100 on livability (#521 in IN) — a middle-class / working-renter tenant base. Strengths: cost of living A+, housing A+; Watch: schools F, crime D-, amenities F.
- Anderson Community School Corporation (urban): math 15% / reading 23% proficiency, ranked #280 of 301 in IN (top 93%) — low school quality limits family demand, transient renter base, plan for 1-2y turnover; 70% free/reduced lunch — lower-income household profile, screen leases tightly.
- Market conditions: Rents rising (+1.8%/yr); 162 active listings in the ZIP; 3 comparable units currently listed for rent nearby; rentals at typical pace (median 18d on market — plan ~3-4 weeks tenant-placement turnaround); 184 units permitted in Madison County in 2024 (0 in 5+ unit buildings).
Forward outlook
- Local home prices are declining (-3.0%/yr); year-one equity from $656 of loan paydown is wiped out by about $3k of value loss. Plan a longer hold.
- Madison County population projected at -14% by 2050 — secular population decline; favor cash flow + early exit over multi-decade hold.
- At projected returns (-3.0% appreciation + 1.8% rent growth), your $27k cash investment doubles in ~6 years — after that, you're playing with house money.
Negotiation context
- It's been on market 41 days — a 3% lower offer ($92k) is reasonable based on typical stale-listing flexibility.
- 2 sale attempts with the ask held roughly flat each time — persistent listings suggest the price (not the market) is what's stuck; bring a comps-based counter.
Risks & watch-outs
- Watch-outs: built in 1899 — expect roof / HVAC / electrical / plumbing capex.
Questions for the listing agent
- It's been on market 41 days. Have you received any prior offers? Is the seller open to a 3% concession, seller financing, or rate buy-down credit?
- Built in 1899 — when were the roof, HVAC, electrical panel, plumbing, and water heater last replaced?
- Is there a deadline driving the sale (1031 exchange, divorce, estate, relocation)? That informs how much negotiation room exists.
- Schools are F-rated, which usually means shorter tenancies and higher turnover. Who's the typical renter profile here, and what's been the actual vacancy rate?
- Crime grade is D in this area — have there been break-ins, vandalism, or insurance claims at this property in the last 3 years? What carrier currently insures it and at what premium?
- What's the average days-on-market for RENTAL listings here right now (not sales)? A rising rental-DOM trend means longer vacancies and softer asking-rent achievability than the comps imply.
- What's the recent tenant-quality profile in this submarket — average credit score on applications, eviction rate, late-payment / NSF rate, and stable-employment percentage? A property-management company in the area should have these aggregated.
- How much new for-sale + rental construction is in the pipeline within 1–3 miles? Heavy new supply typically softens prices + rents 12–24 months out; constrained supply supports both.
Investment metrics
- 1% rule
- 1.50% ✓
- Cap rate
- 12.43%
- Cash-on-cash
- 21.92%
- DSCR
- 1.98
- GRM
- 5.5
CMA / ARV
- ARV (median comp)
- $120,515
- List price
- $94,899
- Delta
- -21.26%
- Verdict
- UNDERPRICED
- Comps
- 20 within 1.0 mi
Show comp detail 6 sales within ~0.75 mi
| Address | Dist | Beds/Ba | Sqft | Sold | Price | $/sf | Match |
|---|---|---|---|---|---|---|---|
| 2244 Lafayette St | 0.23mi | 5/1.5 (+1) | 1,740 (+6%) | 11mo | $149,000 | $86 | 63 |
| 108 W Cross St | 0.38mi | 4/2.0 | 1,568 (-4%) | 10mo | $175,000 | $112 | 63 |
| 1902 Silver St | 0.45mi | 3/1.0 (-1) | 1,679 (+2%) | 15mo | $159,900 | $95 | 58 |
| 2113 Silver St | 0.30mi | 4/1.5 | 1,455 (-11%) | 13mo | $160,000 | $110 | 54 |
| 2037 Lafayette St | 0.38mi | 3/1.0 (-1) | 1,406 (-14%) | 22mo | $154,000 | $110 | 35 |
| 222 E Mulberry St | 0.50mi | 3/2.0 (-1) | 1,797 (+10%) | 21mo | $180,000 | $100 | 34 |
Match score weights: distance 35% · size 25% · config 20% · recency 20%. Top-matched comps best support the ARV.
Projected returns pro-forma
-3.0% appreciation · 1.82% rent growth · sell at horizon
- IRR
- 13.3%
- Equity multiple
- 1.52×
- Total profit
- $13,879
- Equity at exit
- $14,150
- IRR
- 21.2%
- Equity multiple
- 2.70×
- Total profit
- $45,239
- Equity at exit
- $8,205
Cash invested: $26,572 (down + closing). Projections, not guarantees.
Landlord ↔ Tenant lean methodology
- Overall (STATE)
- 90 Strongly Landlord-Friendly
- State Indiana
- 90 Strongly Landlord-Friendly · R+11
- County
- — inherits STATE
- City
- — inherits STATE
ZIP-level market 46012
- Home prices YoY
- -18.6%
- Rents YoY
- 1.8%
- Active inventory
- 162
- Price-to-rent
- 5.5×
Monthly cashflow live
- Estimated rent
- $1,428 medium interval (Pro) →
- Mortgage (P&I)
- −$498
- Tax from tax record
- −$106 /mo · $1,267/yr
- Insurance
- −$40
- HOA
- −$0
- Vacancy / Maint / Mgmt
- −$300
- Net cashflow
- $485
Break-even live
Sensitivity live
| Price | -10% $539 | -5% $512 | +0% $485 | +5% $459 | +10% $432 |
|---|---|---|---|---|---|
| Rent | -10% $373 | -5% $429 | +0% $485 | +5% $542 | +10% $598 |
| Rate | -1.0pp $533 | -0.5pp $510 | base $485 | +0.5pp $461 | +1.0pp $436 |
UW: 25.0% down · 7.5% · 30yr · 1.5% tax · 5.0% vac · 8.0% maint · 8.0% mgmt
Financing live
Cash to close
- Down payment
- $23,725
- Closing costs
- $2,847
- Reserves months
- —
- Total cash needed
- —
Loan-product check · same deal, 3 products live
Conventional
25% down · 7.5% · 30yr
- Down + closing
- —
- Monthly P&I
- —
- Monthly cashflow
- —
- DSCR
- —
- Eligible?
- —
Personal DTI + credit; lowest rate.
DSCR
20% down · 8.5% · 30yr
- Down + closing
- —
- Monthly P&I
- —
- Monthly cashflow
- —
- DSCR
- —
- Eligible?
- —
No personal income docs; deal must DSCR.
Hard money
10% down · 12.0% · 12mo
- Down + closing
- —
- Monthly P&I
- —
- Monthly cashflow
- —
- DSCR
- —
- Eligible?
- —
Short-term bridge; refi at stabilization.
Rent comps 3 comps
| Address | Beds | Baths | Sqft | Rent | $/sqft | DOM | Units | Dist |
|---|---|---|---|---|---|---|---|---|
| 220 W Willow St Anderson, IN | 3.0 | 1.0 | 1200 | $1,250 | $1.04 | 2d | 1 | 0.26mi |
| 632 W 300 N Anderson, IN | 3.0 | 1.0 | 1196 | $1,395 | $1.17 | 45d | 1 | 0.81mi |
| 521 W Vinyard St Anderson, IN | 3.0 | 2.0 | 1712 | $1,495 | $0.87 | 17d | 1 | 0.89mi |
Listing history 17 events
-
2026-06-21days on market $94,899 Active 41 DOM
-
2026-06-18days on market $94,899 Active 38 DOM
-
2026-06-17days on market $94,899 Active 37 DOM
-
2026-06-16days on market $94,899 Active 36 DOM
-
2026-06-15days on market $94,899 Active 35 DOM
-
2026-06-13days on market $94,899 Active 33 DOM
-
2026-06-09days on market $94,899 Active 29 DOM
-
2026-06-08days on market $94,899 Active 28 DOM
-
2026-06-07days on market $94,899 Active 27 DOM
-
2026-06-05days on market $94,899 Active 24 DOM
-
2026-06-03days on market $94,899 Active 23 DOM
-
2026-06-02days on market $94,899 Active 22 DOM
-
2026-06-01days on market $94,899 Active 21 DOM
-
2026-05-31days on market $94,899 Active 20 DOM
-
2026-05-11$94,899 Active 789-char remark
-
2026-04-29$94,899 Active 875-char remark
Show marketing remark (847 chars)
Charming and full of potential, this cute home at 2334 Poplar Street in Anderson, Indiana, is the perfect opportunity for both investors and homebuyers. Sold * * as-is * * , this property offers the chance to add your personal touch and make it your own. With its standout features and prime location, this home is not to be missed. The property boasts an ample-sized fenced-in yard, ideal for outdoor activities, gardening, or creating your private retreat. Inside, the large kitchen offers plenty of space for cooking, dining, and entertaining, making it the heart of the home. Additionally, the attached garage provides convenient parking and extra storage options. Situated in a great location, this home combines the ease of accessibility to local amenities with the charm of a quiet neighborhood setting. Call Brian Ingle at 765-960-0533.
-
2025-11-18price $94,899
ⓘ Source: listings_history table (triggers on properties + properties_extension) + one-shot
backfill from property_details.listing_events for pre-trigger history.
Tax reassessment forecast IN · Partial reset (capped growth)
- Current annual tax
- $1,267 · $106/mo
- Projected year-2 tax
- $1,267 · $106/mo
- Expected delta
- $0/yr ($0/mo · 0.0%)
ⓘ Screening estimate from a state-policy table — verify with the county assessor before closing.
Climate risk First Street
- Flood 1/10 Low FEMA zone X (unshaded) · 0% chance over 30 yrs
- Wildfire 1/10 Low
- Heat 3/10 Moderate 7 d/yr ≥100°F today · 18 d/yr by 30 yrs out
- Wind 2/10 Low
- Air quality 3/10 Moderate 2 unhealthy d/yr today · 3 by 30 yrs out
Nearby sold comps map
Loading sold comps map…
Walkable amenities ~0.75 mi
Loading nearby amenities…
Taxation est. · year 1
- Rental income
- $17,138
- − Mortgage interest
- −$5,316
- − Property taxes
- −$1,267
- − Insurance
- −$474
- − Repairs & maintenance
- −$1,371
- − Management
- −$1,371
- − Depreciation
- −$2,761
- Taxable income
- $4,578
- Est. tax owed @ 24.0%
- −$1,099
- After-tax cash flow
- $4,727/yr
For passive investors: Depreciation is non-cash, so a rental often shows a tax loss while cash-flowing — sheltering income. Rental losses are passive: they offset passive income freely, and up to $25,000/yr can offset ordinary (W-2) income if you actively participate and your MAGI is under $100k (phasing out to $0 by $150k); unused losses carry forward. On sale, claimed depreciation is recaptured at up to 25%, and gains may owe capital-gains tax (a 1031 exchange can defer both). Figures are a year-1 estimate at your 24.0% rate — not tax advice; consult a CPA.
Schools (NCES district)
- District
- Anderson Community School Corporation
- NCES district ID
- 1800150
- Math proficiency
- 15% ▼ -14.00%
- Reading proficiency
- 23% ▼ -7.00%
- Median HH income
- $38,208
- Composite
- 15.93/100
- National rank
- #9250
- State rank
- #280 of 301 in IN
Livability — Anderson
- Score
- 60/100
- State rank
- #521
- US rank
- #18709
Category grades
Schools grade is shown separately in the Schools card above.
Census & demographics
- Census place
- Anderson, IN
- County
- Madison County · 69,445 people
- City population
- 57,762
- Metro
- Indianapolis-Carmel-Anderson, IN
- Population (ZIP)
- 20,855
- Household income
- $58,041
- Rent vs Own
- Severe rent burden
- 987.0
Population outlook (Madison County) Hauer SSP2
- Today (2025)
- 125,800 people
- By 2030
- 122,640 · -2.5%
- By 2040
- 115,420 · -8.3%
- By 2050
- 108,148 · -14.0%
- By 2075
- 91,838 · -27.0%
- By 2100
- 75,670 · -39.8%
Race, ethnicity, and origin ACS 2023
- Neighborhood character
- Predominantly White (85%)
- Race & ethnicity
- White 85% Hispanic / Latino 5% Two or more races 4% Black 4%
- Hispanic origin (detail)
- Mexican 4%
- Common ancestry
- Slovak 3% Serbian 2% Italian 1%
- Foreign-born
- 2% · Canada, Vietnam
- Languages at home
- 96% English-only · Spanish 3%
Political lean MEDSL · Madison
- 2024 margin
- Strong R (+26.9) · D 35.6% · R 62.5% · Other 1.9%
- 2008→2024 swing
- -33.5pp toward R · 2008: 6.5pp · 2024: -26.9pp
- All cycles
- 2024: R+26.9 2020: R+22.6 2016: R+25.7 2012: R+4.5 2008: D+6.5
Not yet ingested
- Civics
- —
Market trends
- HPI YoY
- ▼ -61.16%
- Current HPI
- 266.9819
- Rent YoY
- ▲ 1.82%
- Metro
- Indianapolis-Carmel-Anderson, IN
- State GDP YoY
- ▲ 2.90%
- F500 in state
- 18
Industry mix (Fortune 500 HQ in IN)
| Industry | F500 HQs | Revenue |
|---|---|---|
| Industrial Machinery | 2 | $37B |
|
||
| Healthcare | 1 | $177B |
|
||
| Pharmaceuticals | 1 | $45B |
|
||
| Metals / Steel | 1 | $18B |
|
||
| Agriculture | 1 | $17B |
|
||
| Packaging | 1 | $12B |
|
||
Price history
+0.0% since first listed3 events — show timeline
- 2026-05-11 Listed $94,899 MIBOR as Distributed by MLS Grid
- 2026-04-29 Listed $94,899 RRELMS
- 2025-11-18 Price Changed $94,899 RRELMS
Property tax history
+13.9%/yrLatest (2024): $1,267 · +8.7% YoY. Source: county tax records.
Cash-flow waterfall
monthlySold comps — $/sqft
last 12 mo · ≤1 miLoading sold comps…