803 Armadillo St · Princeton, TX
Flood risk 1/10 · Minimal
- FEMA flood zone
- X (unshaded)
- Chance of flooding over 30 yrs
- 0.0%
- Est. flood insurance / yr
- $507 – $1,088
Fire risk 5/10 · Moderate
- Est. fire insurance / yr
- $1,222 – $2,270
Heat risk 7/10 · Major
- Hot days now (above 110°F)
- 7 days/yr
- Hot days in 30 yrs
- 21 days/yr
Wind risk 6/10 · Moderate
- Chance of severe wind over 30 yrs
- 27.0%
Air-quality risk 3/10 · Minor
- Unhealthy air days now
- 3 days/yr
- Unhealthy air days in 30 yrs
- 3 days/yr
Risk factors via First Street. Map © Google.
Why this score? — see what drove the B grade
The composite is a weighted blend of 9 inputs, each scored 0–100. Each bar is that input's sub-score; the figure is the points it added to the 100-point composite (weight × sub-score).
- Cash flow +30.0/30.0
- 1% rule +10.0/10.0
- DSCR +10.0/10.0
- ARV discount +7.5/15.0
- Schools +4.2/10.0
- Condition / age +4.0/5.0
- Livability +3.1/5.0
- Rent growth +2.2/5.0
- Appreciation +0.0/10.0
$139,995
🖨 Deal sheet (PDF) 📄 Offer letter ✓ Due diligence
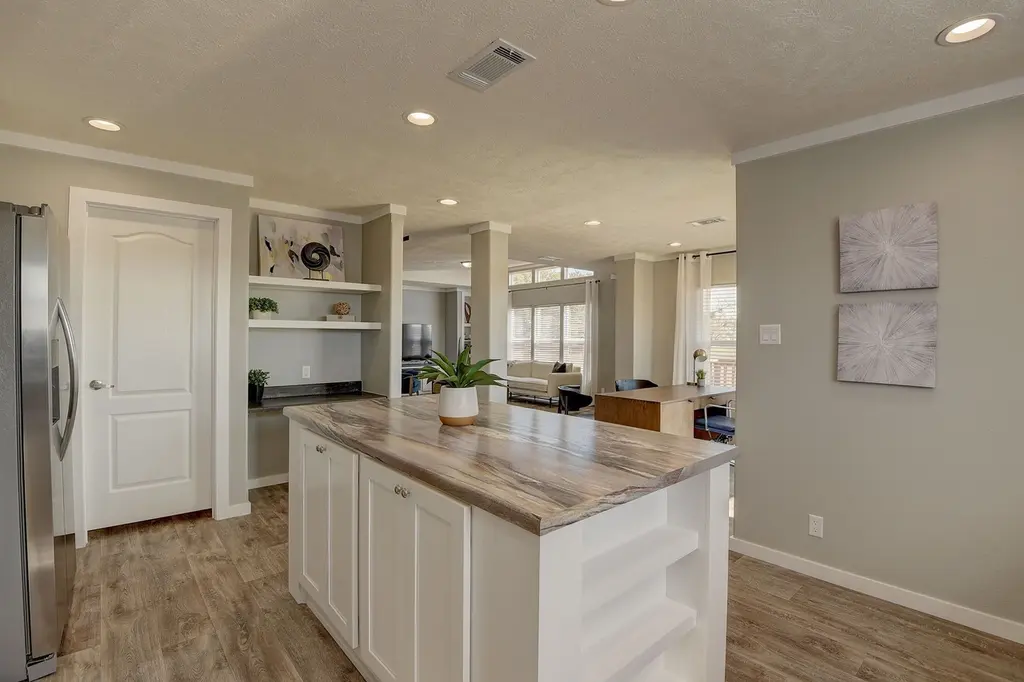
Listing remarks
This exceptional 1,904-square-foot home offers a refined blend of modern comfort and understated luxury, setting it apart from the rest. The open-concept design is ideal for both elegant entertaining and everyday living, featuring a spacious kitchen with abundant cabinetry, expansive counter space, and a statement island perfect for gathering. The private master suite delivers a spa-inspired retreat with a soaking tub, separate walk-in shower, and generous closet space. Two additional bedrooms and a full bath provide flexibility for guests, family, or a home office, while added features like a walk-in pantry and utility room enhance both convenience and function. Located in one of Princeton
Key facts
- 3 parking spots
- Built 2026
- Listed 44 days
Property features AI
Finance
- Other: Address: 803 Armadillo St, Princeton TX 75407; Status: Active; Plan name: Charleston; Inventory type: Spec
- Financial info: List price $139,995
Exterior
- Parking: 3 parking spaces
- Utilities: Electric heating; Central air conditioning
- Home design: Single-family home (Charleston plan); Spec home
- Construction: Living area approximately 1904; Built using standard residential construction
- Exterior features: Shake roof
Interior
- Kitchen: Includes refrigerator and dishwasher
- Bedrooms: 3 bedrooms
- Bathrooms: 2 full bathrooms
- Heating & cooling: Electric forced-air heating; Central air conditioning; Ceiling fans
- Interior features: Refrigerator; Dishwasher
Neighborhood map
What this means for you Summary
Snapshot
- This is a 3-bed/2.0-bath manufactured listed at $140k. Condition is rated good.
Deal economics
- At list price, monthly cash flow is $717 ($9k/yr) — positive.
- The deal already cash-flows at list — no discount required.
- Meets the 1% rule at list price ($2k rent vs $140k).
- Recommended offer: $136k (3.0% below list) — sets the bar for market timing.
- Cap rate 12.4% vs local median 4.5% in Princeton — top-decile yield for the area; either an underpriced asset or a hidden risk that comps aren't pricing in. Stress-test before assuming the spread holds.
Location & tenants
- Location reads 62/100 on livability (#969 in TX) — a middle-class / working-renter tenant base. Strengths: employment A+, housing A+, cost of living A; Watch: amenities F, commute F, health & safety F.
- Princeton ISD (suburban): math 51% / reading 47% proficiency, ranked #188 of 826 in TX (top 23%) — families likely to look elsewhere, expect single-tenant / working-renter base with shorter leases.
- Zoned schools: Smith El (math 53% / reading 48%, grade D+, #833 of 4,322 statewide, top 20%, 683 students, 54% FRL); Clark Middle (math 53% / reading 42%, grade C-, #408 of 1,662 statewide, top 25%, 707 students, 66% FRL); Princeton H S (math 52% / reading 54%, grade C-, #437 of 1,632 statewide, top 27%, 1,521 students, 57% FRL) — zoned schools at 59% FRL track the district average.
- Market conditions: Rents soft (-1.0%/yr); 1410 active listings in the ZIP; 40 comparable units currently listed for rent nearby; rentals at typical pace (median 21d on market — plan ~3-4 weeks tenant-placement turnaround); solid renter incomes; 19,194 units permitted in Collin County in 2024 (3,988 in 5+ unit buildings).
Forward outlook
- Local home prices are declining (-3.0%/yr); year-one equity from $968 of loan paydown is wiped out by about $4k of value loss. Plan a longer hold.
- Collin County population projected at +60% by 2050 — long-run rental-demand tailwind backs the buy-and-hold thesis.
- At projected returns (-3.0% appreciation + 0.0% rent growth), your $39k cash investment doubles in ~7 years — after that, you're playing with house money.
Negotiation context
- It's been on market 44 days — a 3% lower offer ($136k) is reasonable based on typical stale-listing flexibility.
Risks & watch-outs
- Climate carrying-cost: major wind risk, 27% chance of damaging wind over 30y; moderate wildfire risk; extreme-heat days projected 7→21/yr by 2055 (HVAC capex compounding) — expect insurance premiums to compound above CPI over the hold.
Questions for the listing agent
- It's been on market 44 days. Have you received any prior offers? Is the seller open to a 3% concession, seller financing, or rate buy-down credit?
- Is there a deadline driving the sale (1031 exchange, divorce, estate, relocation)? That informs how much negotiation room exists.
- What's the average days-on-market for RENTAL listings here right now (not sales)? A rising rental-DOM trend means longer vacancies and softer asking-rent achievability than the comps imply.
- What's the recent tenant-quality profile in this submarket — average credit score on applications, eviction rate, late-payment / NSF rate, and stable-employment percentage? A property-management company in the area should have these aggregated.
- How much new for-sale + rental construction is in the pipeline within 1–3 miles? Heavy new supply typically softens prices + rents 12–24 months out; constrained supply supports both.
Investment metrics
- 1% rule
- 1.52% ✓
- Cap rate
- 12.44%
- Cash-on-cash
- 21.96%
- DSCR
- 1.98
- GRM
- 5.5
CMA / ARV
- ARV (median comp)
- $342,391
- List price
- $139,995
- Delta
- -59.11%
- Verdict
- UNDERPRICED
- Comps
- 1 within 2.0 mi
Projected returns pro-forma
-3.0% appreciation · 0.0% rent growth · sell at horizon
- IRR
- 11.2%
- Equity multiple
- 1.43×
- Total profit
- $16,791
- Equity at exit
- $20,874
- IRR
- 17.7%
- Equity multiple
- 2.26×
- Total profit
- $49,435
- Equity at exit
- $12,104
Cash invested: $39,199 (down + closing). Projections, not guarantees.
Landlord ↔ Tenant lean methodology
- Overall (STATE)
- 87 Strongly Landlord-Friendly
- State Texas
- 87 Strongly Landlord-Friendly · R+5
- County
- — inherits STATE
- City
- — inherits STATE
ZIP-level market 75407
- Home prices YoY
- -30.3%
- Rents YoY
- -1.0%
- Active inventory
- 1410
- Price-to-rent
- 5.5×
Monthly cashflow live
- Estimated rent
- $2,133 high interval (Pro) →
- Mortgage (P&I)
- −$734
- Tax est. 1.5%
- −$175 /mo · $2,100/yr
- Insurance
- −$58
- HOA
- −$0
- Vacancy / Maint / Mgmt
- −$448
- Net cashflow
- $717
Break-even live
Sensitivity live
| Price | -10% $814 | -5% $766 | +0% $717 | +5% $669 | +10% $621 |
|---|---|---|---|---|---|
| Rent | -10% $549 | -5% $633 | +0% $717 | +5% $802 | +10% $886 |
| Rate | -1.0pp $788 | -0.5pp $753 | base $717 | +0.5pp $681 | +1.0pp $644 |
UW: 25.0% down · 7.5% · 30yr · 1.5% tax · 5.0% vac · 8.0% maint · 8.0% mgmt
Financing live
Cash to close
- Down payment
- $34,999
- Closing costs
- $4,200
- Reserves months
- —
- Total cash needed
- —
Loan-product check · same deal, 3 products live
Conventional
25% down · 7.5% · 30yr
- Down + closing
- —
- Monthly P&I
- —
- Monthly cashflow
- —
- DSCR
- —
- Eligible?
- —
Personal DTI + credit; lowest rate.
DSCR
20% down · 8.5% · 30yr
- Down + closing
- —
- Monthly P&I
- —
- Monthly cashflow
- —
- DSCR
- —
- Eligible?
- —
No personal income docs; deal must DSCR.
Hard money
10% down · 12.0% · 12mo
- Down + closing
- —
- Monthly P&I
- —
- Monthly cashflow
- —
- DSCR
- —
- Eligible?
- —
Short-term bridge; refi at stabilization.
Rent comps 40 comps
| Address | Beds | Baths | Sqft | Rent | $/sqft | DOM | Units | Dist |
|---|---|---|---|---|---|---|---|---|
| 1605 Fox DR Princeton, TX | 3.0 | 2.0 | 1435 | $2,208 | $1.54 | 0d | 11 | 0.02mi |
| 424 Madison Way Princeton, TX | 4.0 | 3.0 | 2258 | $2,350 | $1.04 | 45d | 1 | 0.20mi |
| 514 Virginia Way Princeton, TX | 4.0 | 2.0 | 1980 | $2,200 | $1.11 | 6d | 1 | 0.25mi |
| 512 Virginia Way Princeton, TX | 3.0 | 2.5 | 2133 | $2,150 | $1.01 | 26d | 1 | 0.25mi |
| 625 Delaware Ave Princeton, TX | 3.0 | 2.5 | 1920 | $2,000 | $1.04 | 4d | 1 | 0.26mi |
| 508 Virginia Way Princeton, TX | 4.0 | 2.0 | 1900 | $2,200 | $1.16 | 14d | 1 | 0.27mi |
| 1609 Washington St Princeton, TX | 4.0 | 2.5 | 2182 | $2,150 | $0.99 | 0d | 1 | 0.27mi |
| 617 Delaware Ave Princeton, TX | 3.0 | 2.0 | 1407 | $1,749 | $1.24 | 7d | 1 | 0.28mi |
| 622 Delaware Ave Princeton, TX | 3.0 | 2.5 | 1633 | $1,850 | $1.13 | 23d | 1 | 0.28mi |
| 1414 Windermere Way Princeton, TX | 3.0 | 2.5 | 1635 | $1,945 | $1.19 | 0d | 1 | 0.29mi |
| 613 Delaware Ave Princeton, TX | 3.0 | 2.5 | 1920 | $1,950 | $1.02 | 26d | 1 | 0.29mi |
| 1411 Windermere Way Princeton, TX | 4.0 | 2.5 | 2323 | $2,099 | $0.90 | 7d | 1 | 0.29mi |
| 1805 Washington St Princeton, TX | 3.0 | 2.0 | 1437 | $1,775 | $1.24 | 45d | 1 | 0.31mi |
| 1104 Witherspoon Ln Princeton, TX | 4.0 | 3.0 | 1845 | $2,200 | $1.19 | 45d | 1 | 0.31mi |
| 619 Colgate Cir Princeton, TX | 4.0 | 2.5 | 2182 | $2,295 | $1.05 | 45d | 1 | 0.31mi |
| 1710 Washington St Princeton, TX | 3.0 | 2.0 | 1437 | $1,770 | $1.23 | 3d | 1 | 0.32mi |
| 1421 Butler Ave Princeton, TX | 3.0 | 2.5 | 2225 | $1,999 | $0.90 | 26d | 1 | 0.32mi |
| 603 Delaware Ave Princeton, TX | 3.0 | 2.5 | 1633 | $1,897 | $1.16 | 7d | 1 | 0.32mi |
| 1802 Washington St Princeton, TX | 3.0 | 2.5 | 1920 | $1,950 | $1.02 | 26d | 1 | 0.33mi |
| 804 Princeton Hts Princeton, TX | 3.0 | 2.5 | 2232 | $2,225 | $1.00 | 7d | 1 | 0.33mi |
| 604 Princeton Hts Princeton, TX | 3.0–5.0 | 2.0–2.5 | 1882 | $2,045 | $1.09 | 0d | 1 | 0.33mi |
| 611 Colgate Cir Princeton, TX | 3.0 | 2.5 | 1920 | $2,500 | $1.30 | 45d | 1 | 0.33mi |
| 718 Declaration Dr Princeton, TX | 4.0 | 2.0 | 1991 | $2,195 | $1.10 | 45d | 1 | 0.35mi |
| 1411 Butler Ave Princeton, TX | 4.0 | 3.0 | 2323 | $2,399 | $1.03 | 5d | 1 | 0.36mi |
| 907 Princeton Hts Princeton, TX | 3.0 | 2.5 | 1627 | $1,995 | $1.23 | 26d | 1 | 0.39mi |
| 1709 Chapel Hill Rd Princeton, TX | 3.0 | 2.5 | 1633 | $1,695 | $1.04 | 45d | 1 | 0.39mi |
| 1106 Princeton Hts Princeton, TX | 3.0 | 2.0 | 1399 | $1,795 | $1.28 | 3d | 1 | 0.40mi |
| 1818 Marquette Dr Princeton, TX | 3.0 | 2.5 | 1633 | $1,800 | $1.10 | 45d | 1 | 0.40mi |
| 1809 Chapel Hill Rd Princeton, TX | 4.0 | 2.5 | 2121 | $2,100 | $0.99 | 6d | 1 | 0.41mi |
| 1702 Chapel Hill Rd Princeton, TX | 4.0 | 2.5 | 2121 | $1,995 | $0.94 | 9d | 1 | 0.41mi |
| 1708 Chapel Hill Rd Princeton, TX | 3.0 | 2.5 | 1826 | $1,850 | $1.01 | 5d | 1 | 0.41mi |
| 603 Charity Dr Princeton, TX | 4.0 | 2.5 | 2252 | $2,300 | $1.02 | 45d | 1 | 0.42mi |
| 1819 Chapel Hill Rd Princeton, TX | 3.0 | 2.0 | 1437 | $1,700 | $1.18 | 45d | 1 | 0.42mi |
| 1901 Chapel Hill Rd Princeton, TX | 3.0 | 2.5 | 1605 | $1,750 | $1.09 | 20d | 1 | 0.43mi |
| 410 Forest St Princeton, TX | 3.0 | 2.0 | 1412 | $1,800 | $1.27 | 9d | 1 | 0.45mi |
| 1906 Chapel Hill Rd Princeton, TX | 3.0 | 2.5 | 1633 | $1,995 | $1.22 | 45d | 1 | 0.46mi |
| 1211 Princeton Hts Princeton, TX | 3.0 | 2.0 | 1401 | $1,995 | $1.42 | 45d | 1 | 0.46mi |
| 1211 Princeton Hts Princeton, TX | 3.0 | 2.0 | 1401 | $1,770 | $1.26 | 19d | 1 | 0.46mi |
| 2004 Hancock Cir Princeton, TX | 4.0 | 3.0 | 2258 | $1,995 | $0.88 | 14d | 1 | 0.48mi |
| 1210 Bullock Dr Princeton, TX | 3.0 | 3.0 | 1627 | $1,850 | $1.14 | 45d | 1 | 0.48mi |
Listing history 16 events
-
2026-06-21days on market $139,995 Active 44 DOM
-
2026-06-18days on market $139,995 Active 41 DOM
-
2026-06-17days on market $139,995 Active 40 DOM
-
2026-06-16days on market $139,995 Active 39 DOM
-
2026-06-15days on market $139,995 Active 38 DOM
-
2026-06-13days on market $139,995 Active 36 DOM
-
2026-06-13days on market $139,995 Active 35 DOM
-
2026-06-09days on market $139,995 Active 32 DOM
-
2026-06-08days on market $139,995 Active 31 DOM
-
2026-06-07days on market $139,995 Active 30 DOM
-
2026-06-04days on market $139,995 Active 27 DOM
-
2026-06-03days on market $139,995 Active 26 DOM
-
2026-06-02days on market $139,995 Active 25 DOM
-
2026-06-01days on market $139,995 Active 24 DOM
-
2026-05-31days on market $139,995 Active 23 DOM
-
2026-05-09$139,995 Active 1268-char remark
ⓘ Source: listings_history table (triggers on properties + properties_extension) + one-shot
backfill from property_details.listing_events for pre-trigger history.
Climate risk First Street
- Flood 1/10 Low FEMA zone X (unshaded) · 0% chance over 30 yrs
- Wildfire 5/10 Major
- Heat 7/10 Severe 7 d/yr ≥110°F today · 21 d/yr by 30 yrs out
- Wind 6/10 Major 27% chance of damaging wind over 30 yrs
- Air quality 3/10 Moderate 3 unhealthy d/yr today · 3 by 30 yrs out
Nearby sold comps map
Loading sold comps map…
Walkable amenities ~0.75 mi
Loading nearby amenities…
Taxation est. · year 1
- Rental income
- $25,594
- − Mortgage interest
- −$7,842
- − Property taxes
- −$2,100
- − Insurance
- −$700
- − Repairs & maintenance
- −$2,047
- − Management
- −$2,047
- − Depreciation
- −$4,073
- Taxable income
- $6,784
- Est. tax owed @ 24.0%
- −$1,628
- After-tax cash flow
- $6,981/yr
For passive investors: Depreciation is non-cash, so a rental often shows a tax loss while cash-flowing — sheltering income. Rental losses are passive: they offset passive income freely, and up to $25,000/yr can offset ordinary (W-2) income if you actively participate and your MAGI is under $100k (phasing out to $0 by $150k); unused losses carry forward. On sale, claimed depreciation is recaptured at up to 25%, and gains may owe capital-gains tax (a 1031 exchange can defer both). Figures are a year-1 estimate at your 24.0% rate — not tax advice; consult a CPA.
Condition & rehab AI · 20 photos
This well-maintained, modern home with good condition and minimal repairs needed is ready for a new owner. It offers a spacious kitchen, two bathrooms, and a private master suite with a spa-inspired retreat. The home is located in a desirable neighborhood with a well-maintained lawn and landscaping.
Value-add opportunities
- Both painting interior walls — fresh paint enhances curb appeal and interior aesthetics
- Both replacing window treatments — new blinds or curtains improve light control and aesthetics
- Resale upgrading kitchen appliances — newer appliances can increase home's value
- Resale upgrading bathroom fixtures — modern fixtures can increase home's value
Renovation cost estimate screening
Value-add ROI direction
- Both painting interior walls — fresh paint enhances curb appeal and interior aesthetics ↑
- Both replacing window treatments — new blinds or curtains improve light control and aesthetics ↑
- Resale upgrading kitchen appliances — newer appliances can increase home's value ↑
- Resale upgrading bathroom fixtures — modern fixtures can increase home's value ↑
ⓘ Cost ranges are severity-bucket heuristics (US national rule-of-thumb). Get contractor quotes + a written scope before underwriting a rehab budget.
Schools (NCES district)
- District
- Princeton ISD
- NCES district ID
- 4835850
- Math proficiency
- 51% ▼ -8.00%
- Reading proficiency
- 47% ▬ 0.00%
- Median HH income
- $54,827
- Composite
- 42.44/100
- National rank
- #3226
- State rank
- #188 of 826 in TX
Livability — Princeton
- Score
- 62/100
- State rank
- #969
- US rank
- #17215
Category grades
Schools grade is shown separately in the Schools card above.
Census & demographics
- County
- Collin County · 1,159,394 people
- City population
- 34,171
- Metro
- Dallas-Fort Worth-Arlington, TX
- Population (ZIP)
- 34,171
- Household income
- $100,037
- Rent vs Own
- Severe rent burden
- 368.0
Population outlook (Collin County) Hauer SSP2
- Today (2025)
- 1,210,074 people
- By 2030
- 1,358,201 · +12.2%
- By 2040
- 1,654,061 · +36.7%
- By 2050
- 1,937,359 · +60.1%
- By 2075
- 2,567,039 · +112.1%
- By 2100
- 2,952,048 · +144.0%
Race, ethnicity, and origin ACS 2023
- Neighborhood character
- Diverse neighborhood (Simpson 0.66)
- Race & ethnicity
- White 47% Hispanic / Latino 30% Black 17% Two or more races 10% Asian 4% Native American 1%
- Hispanic origin (detail)
- Mexican 26%
- Common ancestry
- Lithuanian 2% Romanian 1% Russian 1%
- Foreign-born
- 15% · Canada, China, Mexico
- Languages at home
- 70% English-only · Spanish 22% Other Indo-European 2% Other Asian/Pacific 1%
Political lean MEDSL · Collin
- 2024 margin
- R (+11.1) · D 43.1% · R 54.3% · Other 2.6%
- 2008→2024 swing
- +14.4pp toward D · 2008: -25.6pp · 2024: -11.1pp
- All cycles
- 2024: R+11.1 2020: R+4.3 2016: R+17.0 2012: R+31.6 2008: R+25.6
Not yet ingested
- Civics
- —
Market trends
- HPI YoY
- ▼ -103.99%
- Current HPI
- 238.9373
- Rent YoY
- ▼ -1.02%
- Metro
- Dallas-Fort Worth-Arlington, TX
- State GDP YoY
- ▲ 3.95%
- F500 in state
- 110
Industry mix (Fortune 500 HQ in TX)
| Industry | F500 HQs | Revenue |
|---|---|---|
| Energy | 16 | $1,198B |
|
||
| Technology | 5 | $198B |
|
||
| Engineering / Construction | 4 | $72B |
|
||
| Energy Services | 3 | $60B |
|
||
| Utilities | 3 | $41B |
|
||
| Healthcare | 2 | $330B |
|
||
Cash-flow waterfall
monthlySold comps — $/sqft
last 12 mo · ≤1 miLoading sold comps…