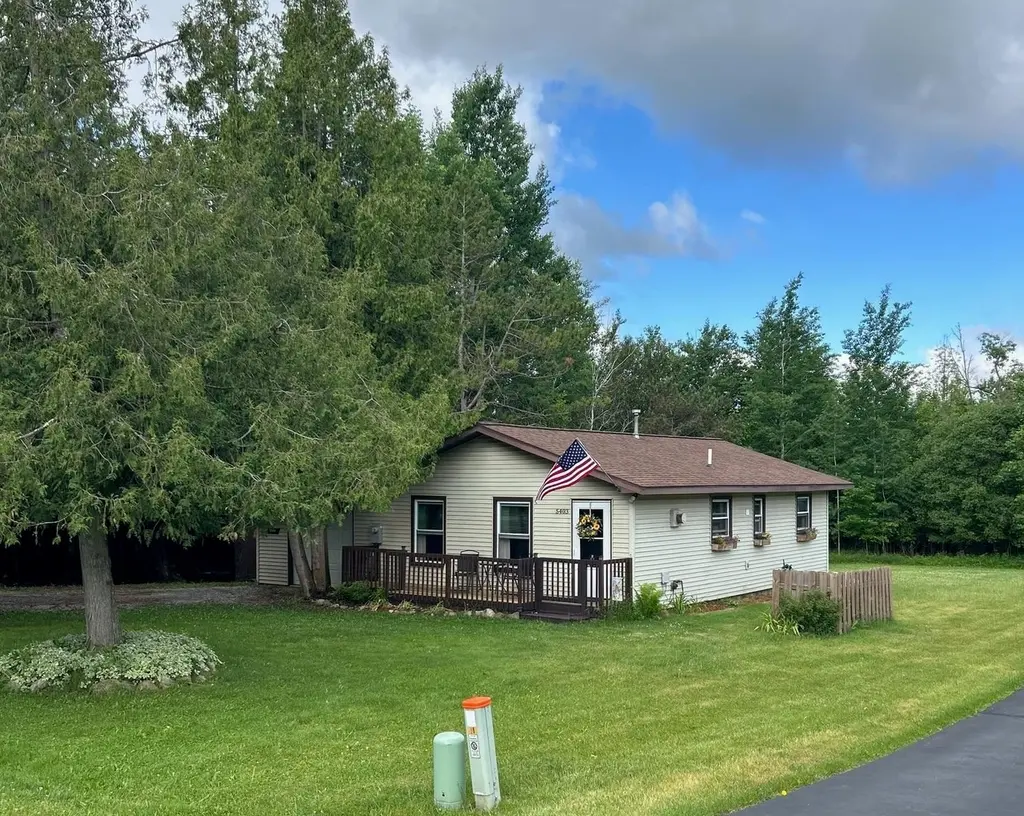
5403 Kings Way · Butman, MI
Flood risk 1/10 · Minimal
- FEMA flood zone
- X (unshaded)
- Chance of flooding over 30 yrs
- 0.0%
- Est. flood insurance / yr
- $473 – $860
Fire risk 3/10 · Minor
- Est. fire insurance / yr
- $784 – $1,456
Heat risk 2/10 · Minimal
- Hot days now (above 95°F)
- 7 days/yr
- Hot days in 30 yrs
- 13 days/yr
Wind risk 1/10 · Minimal
- Chance of severe wind over 30 yrs
- —
Air-quality risk 2/10 · Minimal
- Unhealthy air days now
- 0 days/yr
- Unhealthy air days in 30 yrs
- 1 days/yr
Risk factors via First Street. Map © Google.
Why this score? — see what drove the C- grade
The composite is a weighted blend of 9 inputs, each scored 0–100. Each bar is that input's sub-score; the figure is the points it added to the 100-point composite (weight × sub-score).
- Cash flow +23.8/30.0
- DSCR +7.7/10.0
- ARV discount +7.5/15.0
- 1% rule +5.2/10.0
- Schools +3.3/10.0
- Rent growth +2.5/5.0
- Livability +2.5/5.0
- Condition / age +2.5/5.0
- Appreciation +0.0/10.0
$179,000
🖨 Deal sheet (PDF) 📄 Offer letter ✓ Due diligence
Listing remarks MLS
2 bedroom and 1 full bath home in Sugar Spring with 1 attached car garage located on a county maintained pave road. Home has a new roof and new forced air furnace (2022). All appliances included and Home Warranty with full Price Offer
Key facts
- New exterior doors
- Updated home
- 0.3 acre lot
Tags
Property features AI
Finance
- Other: Pets allowed (no pet restrictions noted); Approximate lot acreage: 0.3 acres; Frontage width about 78 feet; Located in Kings Realm Subdivision, Butman Township (Gladwin area)
- HOA & community: Sugar Springs Property Owners Association with an annual fee of $500; Association phone available
Exterior
- Parking: Attached garage (15 x 25) with space for one vehicle; Garage access included
- Utilities: Private well water; Public sanitary sewer; LP/Propane gas for heat
- Home design: Single-story residential home; Built in 1973; Entry faces west (side of street: W)
- Construction: Crawl-space foundation
- Exterior features: Vinyl siding; Beach access to Lake Lancelot; Paved street frontage; Frontage along a road; Interior-lake legal water access only; Flood insurance not required; Not in a floodplain
Interior
- Kitchen: Main-level kitchen (approx. 8 x 8); Main-level dining area (approx. 9 x 8)
- Bedrooms: Main-level bedrooms (2): one about 11 x 12, one about 10 x 11
- Bathrooms: One full bathroom on the main level (approx. 8 x 7)
- Heating & cooling: Forced air heating; LP/Propane gas fuel
- Interior features: 7 total rooms
- Laundry & utility: Main-level laundry room (approx. 5 x 8)
Neighborhood map
What this means for you Summary
Snapshot
- This is a 2-bed/1.0-bath single-family listed at $179k.
Deal economics
- At list price, monthly cash flow is $343 ($4k/yr) — positive.
- The deal already cash-flows at list — no discount required.
- Meets the 1% rule at list price ($2k rent vs $179k).
Location & tenants
- Location reads: area grade C — affects rentability + tenant quality, not the cash-flow math above.
- Gladwin Community Schools (town): math 28% / reading 51% proficiency, ranked #232 of 540 in MI (top 43%) — families likely to look elsewhere, expect single-tenant / working-renter base with shorter leases.
- Market conditions: 288 active listings in the ZIP; 90 units permitted in Gladwin County in 2024 (0 in 5+ unit buildings).
Forward outlook
- Local home prices are declining (-3.0%/yr); year-one equity from $1k of loan paydown is wiped out by about $5k of value loss. Plan a longer hold.
- Gladwin County population projected at -25% by 2050 — secular population decline; favor cash flow + early exit over multi-decade hold.
Negotiation context
- Only 8 days on market — expect competitive offers; lowballing is unlikely to land.
- 8 sale attempts since 24y ago with the ask held roughly flat each time — persistent listings suggest the price (not the market) is what's stuck; bring a comps-based counter.
- Current owner paid $90k; list at $179k implies a 99% gain — meaningful room to come down on a strong offer.
Questions for the listing agent
- Built in 1973 — when were the roof, HVAC, electrical panel, plumbing, and water heater last replaced?
- What does the HOA fee cover, when was the last increase, and are there any pending special assessments or reserve-fund shortfalls?
- Is there a deadline driving the sale (1031 exchange, divorce, estate, relocation)? That informs how much negotiation room exists.
- What's the average days-on-market for RENTAL listings here right now (not sales)? A rising rental-DOM trend means longer vacancies and softer asking-rent achievability than the comps imply.
- What's the recent tenant-quality profile in this submarket — average credit score on applications, eviction rate, late-payment / NSF rate, and stable-employment percentage? A property-management company in the area should have these aggregated.
- How much new for-sale + rental construction is in the pipeline within 1–3 miles? Heavy new supply typically softens prices + rents 12–24 months out; constrained supply supports both.
Investment metrics
- 1% rule
- 1.02% ✓
- Cap rate
- 8.59%
- Cash-on-cash
- 8.21%
- DSCR
- 1.37
- GRM
- 8.2
CMA / ARV
- ARV (on-the-fly)
- $108,864
- Comps found
- 2
Show comp detail 2 sales within ~0.75 mi
| Address | Dist | Beds/Ba | Sqft | Sold | Price | $/sf | Match |
|---|---|---|---|---|---|---|---|
| 5344 Archers Way | 0.26mi | 2/1.0 | 864 (0%) | 20mo | $109,000 | $126 | 71 |
| 5375 Dover Way | 0.23mi | 2/1.0 | 960 (+11%) | 6mo | $112,500 | $117 | 66 |
Match score weights: distance 35% · size 25% · config 20% · recency 20%. Top-matched comps best support the ARV.
Projected returns pro-forma
-3.0% appreciation · 3.0% rent growth · sell at horizon
- IRR
- -3.8%
- Equity multiple
- 0.86×
- Total profit
- $-7,217
- Equity at exit
- $26,689
- IRR
- 5.8%
- Equity multiple
- 1.43×
- Total profit
- $21,610
- Equity at exit
- $15,477
Cash invested: $50,120 (down + closing). Projections, not guarantees.
Landlord ↔ Tenant lean methodology
- Overall (STATE)
- 62 Landlord-Friendly
- State Michigan
- 62 Landlord-Friendly · EVEN
- County
- — inherits STATE
- City
- — inherits STATE
ZIP-level market 48624
- Home prices YoY
- -23.4%
- Active inventory
- 288
- Price-to-rent
- 8.2×
Monthly cashflow live
- Estimated rent
- $1,823 medium interval (Pro) →
- Mortgage (P&I)
- −$939
- Tax from tax record
- −$42 /mo · $501/yr
- Insurance
- −$75
- HOA
- −$42
- Vacancy / Maint / Mgmt
- −$383
- Net cashflow
- $343
Break-even live
Sensitivity live
| Price | -10% $444 | -5% $394 | +0% $343 | +5% $292 | +10% $242 |
|---|---|---|---|---|---|
| Rent | -10% $199 | -5% $271 | +0% $343 | +5% $415 | +10% $487 |
| Rate | -1.0pp $433 | -0.5pp $389 | base $343 | +0.5pp $297 | +1.0pp $249 |
UW: 25.0% down · 7.5% · 30yr · 1.5% tax · 5.0% vac · 8.0% maint · 8.0% mgmt
Financing live
Cash to close
- Down payment
- $44,750
- Closing costs
- $5,370
- Reserves months
- —
- Total cash needed
- —
Loan-product check · same deal, 3 products live
Conventional
25% down · 7.5% · 30yr
- Down + closing
- —
- Monthly P&I
- —
- Monthly cashflow
- —
- DSCR
- —
- Eligible?
- —
Personal DTI + credit; lowest rate.
DSCR
20% down · 8.5% · 30yr
- Down + closing
- —
- Monthly P&I
- —
- Monthly cashflow
- —
- DSCR
- —
- Eligible?
- —
No personal income docs; deal must DSCR.
Hard money
10% down · 12.0% · 12mo
- Down + closing
- —
- Monthly P&I
- —
- Monthly cashflow
- —
- DSCR
- —
- Eligible?
- —
Short-term bridge; refi at stabilization.
HOA detail
- Monthly dues
- $42 · $504/yr
Listing history 7 events
-
2026-06-21days on market $179,000 Active 8 DOM
-
2026-06-18days on market $179,000 Active 6 DOM
-
2026-06-17days on market $179,000 Active 5 DOM
-
2026-06-16days on market $179,000 Active 4 DOM
-
2026-06-15days on market $179,000 Active 3 DOM
-
2026-06-12remarks 689-char remark
-
2026-06-12$179,000 Active 1 DOM
ⓘ Source: listings_history table (triggers on properties + properties_extension) + one-shot
backfill from property_details.listing_events for pre-trigger history.
Tax reassessment forecast MI · Partial reset (capped growth)
- Current annual tax
- $501 · $42/mo
- Projected year-2 tax
- $1,629 · $136/mo
- Expected delta
- +$1,128/yr (+$94/mo · 225.3%)
ⓘ Screening estimate from a state-policy table — verify with the county assessor before closing.
Climate risk First Street
- Flood 1/10 Low FEMA zone X (unshaded) · 0% chance over 30 yrs
- Wildfire 3/10 Moderate
- Heat 2/10 Low 7 d/yr ≥95°F today · 13 d/yr by 30 yrs out
- Wind 1/10 Low
- Air quality 2/10 Low 0 unhealthy d/yr today · 1 by 30 yrs out
Nearby sold comps map
Loading sold comps map…
Walkable amenities ~0.75 mi
Loading nearby amenities…
Taxation est. · year 1
- Rental income
- $21,874
- − Mortgage interest
- −$10,027
- − Property taxes
- −$501
- − Insurance
- −$895
- − Repairs & maintenance
- −$1,750
- − Management
- −$1,750
- − HOA
- −$504
- − Depreciation
- −$5,207
- Taxable income
- $1,240
- Est. tax owed @ 24.0%
- −$298
- After-tax cash flow
- $3,819/yr
For passive investors: Depreciation is non-cash, so a rental often shows a tax loss while cash-flowing — sheltering income. Rental losses are passive: they offset passive income freely, and up to $25,000/yr can offset ordinary (W-2) income if you actively participate and your MAGI is under $100k (phasing out to $0 by $150k); unused losses carry forward. On sale, claimed depreciation is recaptured at up to 25%, and gains may owe capital-gains tax (a 1031 exchange can defer both). Figures are a year-1 estimate at your 24.0% rate — not tax advice; consult a CPA.
Schools (NCES district)
- District
- Gladwin Community Schools
- NCES district ID
- 2615990
- Math proficiency
- 28% ▼ -13.00%
- Reading proficiency
- 51% ▼ -2.00%
- Median HH income
- $38,917
- Composite
- 32.93/100
- National rank
- #5595
- State rank
- #232 of 540 in MI
Livability — Butman
No livability data for this city. (Only ~50 U.S. cities are tracked.)
Census & demographics
- Population (ZIP)
- 16,269
Population outlook (Gladwin County) Hauer SSP2
- Today (2025)
- 23,440 people
- By 2030
- 22,281 · -4.9%
- By 2040
- 19,867 · -15.2%
- By 2050
- 17,667 · -24.6%
- By 2075
- 12,909 · -44.9%
- By 2100
- 8,629 · -63.2%
Race, ethnicity, and origin ACS 2023
- Neighborhood character
- Predominantly White (94%)
- Race & ethnicity
- White 94% Two or more races 4% Hispanic / Latino 2%
- Common ancestry
- Romanian 8% Lithuanian 3% Iranian 3%
- Foreign-born
- 1%
- Languages at home
- 95% English-only · German/W. Germanic 4% Spanish 1%
Political lean MEDSL · Gladwin
- 2024 margin
- Solid R (+40.7) · D 29.1% · R 69.8% · Other 1.1%
- 2008→2024 swing
- -42.2pp toward R · 2008: 1.5pp · 2024: -40.7pp
- All cycles
- 2024: R+40.7 2020: R+36.8 2016: R+34.7 2012: R+7.2 2008: D+1.5
Not yet ingested
- Civics
- —
Market trends
- HPI YoY
- ▼ -72.67%
- Current HPI
- 238.0744
- Rent YoY
- —
- Metro
- —
- State GDP YoY
- ▲ 1.37%
- F500 in state
- 28
Industry mix (Fortune 500 HQ in MI)
| Industry | F500 HQs | Revenue |
|---|---|---|
| Automotive Parts | 3 | $48B |
|
||
| Automotive | 2 | $372B |
|
||
| Chemicals | 1 | $45B |
|
||
| Automotive Retail | 1 | $29B |
|
||
| Healthcare / Medical Devices | 1 | $23B |
|
||
| Automotive Technology | 1 | $20B |
|
||
Price history
+226.0% since first listed15 events — show timeline
- 2026-06-12 Listed $179,000 MiRealSource-MiMLS
- 2022-08-03 Sold (Public Records) $90,000 Public Records
- 2022-08-02 Sold (MLS) $90,000 REALCOMP
- 2022-08-02 Sold (MLS) $90,000 WWMLS
- 2022-08-02 Sold (MLS) $90,000 MiRealSource-MiMLS
- 2022-05-31 Listed $95,000 WWMLS
- 2022-05-28 Listed $95,000 REALCOMP
- 2022-05-28 Listed $95,000 MiRealSource-MiMLS
- 2014-06-29 Listed $42,500 WWMLS
- 2012-06-26 Listing Removed — MiRealSource-MiMLS
- 2012-04-04 Listed $19,900 MiRealSource-MiMLS
- 2012-03-05 Listing Removed — MiRealSource-MiMLS
- 2011-05-16 Listed $62,500 MiRealSource-MiMLS
- 2005-09-15 Sold (Public Records) $52,000 Public Records
- 2002-03-16 Listed $54,900 MiRealSource-MiMLS
Property tax history
-6.6%/yrLatest (2025): $501 · -63.6% YoY. Source: county tax records.
Cash-flow waterfall
monthlySold comps — $/sqft
last 12 mo · ≤1 miLoading sold comps…