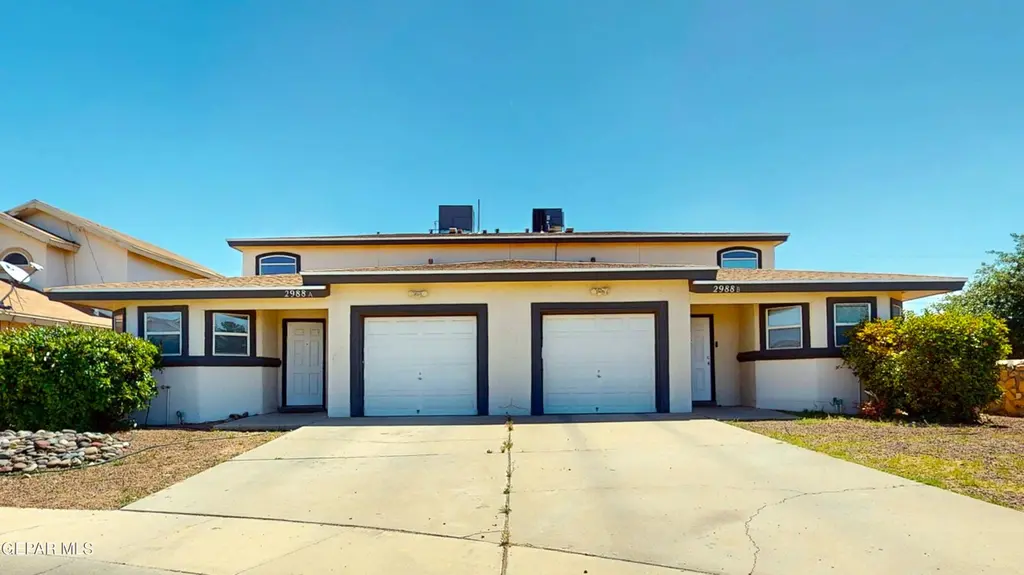
 Duplex
2988 Tierra Cortez Ave Unit A & B · El Paso, TX
Flood risk 1/10 · Minimal
- FEMA flood zone
- X
- Chance of flooding over 30 yrs
- 0.0%
- Est. flood insurance / yr
- $507 – $1,088
Fire risk 3/10 · Minor
- Est. fire insurance / yr
- $1,222 – $2,270
Heat risk 6/10 · Moderate
- Hot days now (above 100°F)
- 7 days/yr
- Hot days in 30 yrs
- 25 days/yr
Wind risk 1/10 · Minimal
- Chance of severe wind over 30 yrs
- —
Air-quality risk 3/10 · Minor
- Unhealthy air days now
- 2 days/yr
- Unhealthy air days in 30 yrs
- 2 days/yr
Risk factors via First Street. Map © Google.
Why this score? — see what drove the D grade
The composite is a weighted blend of 9 inputs, each scored 0–100. Each bar is that input's sub-score; the figure is the points it added to the 100-point composite (weight × sub-score).
- Cash flow +12.9/30.0
- ARV discount +7.5/15.0
- Livability +4.0/5.0
- DSCR +3.9/10.0
- Condition / age +3.8/5.0
- 1% rule +3.7/10.0
- Rent growth +3.0/5.0
- Schools +2.6/10.0
- Appreciation +0.0/10.0
$469,900
🖨 Deal sheet 📄 Offer letter ✓ Due diligence
Multi-family units
County records classify this as Multi-Family (5+ Unit). Listing-text estimate: 2 units. estimate disagrees with records
5+ unit building — per-unit beds/baths from public records are typically unavailable; the breakdown below (if shown) is an estimate from the listing text.
Listing remarks
Welcome to a duplex that feels like home. Beautifully kept and fully occupied, these units offer generous 3-bedroom floor plans with thoughtful touches like master bedroom alcoves for your office or nursery. Enjoy the privacy of separate backyards and the convenience of attached garages. Located in a peaceful cul-de-sac, this property balances neighborhood charm with easy city access to I-10 and Ft. Bliss. Truly a unique find for any serious buyer. Please have a look through the property with the virtual tour. Them make an appointment to see this lovely duplex in person.
Key facts
- Easy city access
- Separate backyards
- Peaceful cul-de-sac
Tags
Property features AI
Exterior
- Parking: 1 parking space per unit
- Utilities: City utilities
- Home design: Duplex; Two total units; Total building area approximately 4,622
- Construction: Stucco construction; Shingle roof
- Exterior features: Shingle roof; Stucco exterior; Lot approximately 0.2 acres
Interior
- Kitchen: Free‑standing gas oven; Dishwasher
- Flooring: Carpet; Tile
- Heating & cooling: Central heating; Refrigerated cooling
- Interior features: Carpet and tile flooring; Central heating; Refrigerated cooling
Neighborhood map
What this means for you Summary
Snapshot
- This is a 2 × 3-bed/2-bath units multifamily listed at $470k. Condition is rated good.
Deal economics
- At list price, monthly cash flow is $-30 ($-366/yr) — negative. Per door: $-15/mo.
- To cash-flow at today's rent, offer at most $465k (0.9% below list).
- To meet the 1% rule (rent ≥ 1% of price), the offer needs to be $407k (13.3% below list).
- Recommended offer: $407k (13.3% below list) — sets the bar for 1% rule.
Location & tenants
- Location reads 81/100 on livability (#23 in TX, #1,375 nationally) — a professional / high-income tenant draw. Strengths: commute A+, cost of living A+, housing A+; Watch: employment D+.
- Socorro ISD (urban): math 23% / reading 36% proficiency, ranked #624 of 826 in TX (top 76%) — low school quality limits family demand, transient renter base, plan for 1-2y turnover; 66% free/reduced lunch — lower-income household profile, screen leases tightly.
- Zoned schools: Paso Del Norte Fine Arts Academy (math 17% / reading 22%, grade F, #3,583 of 4,322 statewide, top 86%, 1,017 students, 76% FRL); Spec Rafael Hernando Middle (math 27% / reading 28%, grade F, #1,156 of 1,662 statewide, top 71%, 752 students, 72% FRL); El Dorado H S (math 27% / reading 38%, grade F, #1,029 of 1,632 statewide, top 64%, 2,245 students, 75% FRL).
- Market conditions: Rents rising (+2.1%/yr); 1183 active listings in the ZIP; solid renter incomes; 2,196 units permitted in El Paso County in 2024 (143 in 5+ unit buildings).
- At $4,072/mo this rent would consume 63% of the median local household income ($77k/yr) (locally 900% of renters already pay >50% of income on rent) — very limited rent-growth headroom before tenants either downsize or default.
Forward outlook
- Local home prices are declining (-3.0%/yr); year-one equity from $3k of loan paydown is wiped out by about $14k of value loss. Plan a longer hold.
- El Paso County population projected at +10% by 2050 — modest demand growth; plan on rents tracking national, not racing it.
Negotiation context
- It's been on market 28 days — a 2% lower offer ($463k) is reasonable based on typical stale-listing flexibility.
Risks & watch-outs
- Climate carrying-cost: extreme-heat days projected 7→25/yr by 2055 (HVAC capex compounding) — expect insurance premiums to compound above CPI over the hold.
Questions for the listing agent
- What do current leases actually rent for vs. the listed asking? Can we see a recent rent roll and the last 12 months of T-12 income?
- Can we see the unit-by-unit rent roll, current vacancy, and any below-market leases? What's the average tenancy length?
- What capital expenditures (roof, boiler, parking lot, exteriors) have been made in the last 5 years, and what's planned in the next 2?
- Is there a deadline driving the sale (1031 exchange, divorce, estate, relocation)? That informs how much negotiation room exists.
- Schools are B-rated — typically a magnet for longer-tenancy family renters. What's the average tenant stay here, and is there a school-zone premium baked into asking?
- The area grade is low — what's the realistic commute time and amenity access for the typical tenant pool here? Any planned neighborhood developments (good or bad) we should know about?
- What's the average days-on-market for RENTAL listings here right now (not sales)? A rising rental-DOM trend means longer vacancies and softer asking-rent achievability than the comps imply.
- What's the recent tenant-quality profile in this submarket — average credit score on applications, eviction rate, late-payment / NSF rate, and stable-employment percentage? A property-management company in the area should have these aggregated.
- How much new apartment / multifamily construction is in the pipeline within 1–3 miles? Heavy new supply (>2% of stock underway) typically softens rents 12–24 months out; light construction supports rent growth.
Investment metrics
- 1% rule
- 0.87% ✗
- Cap rate
- 6.22%
- Cash-on-cash
- -0.28%
- DSCR
- 0.99
- GRM
- 9.6
CMA / ARV
No comps found within radius.
Projected returns pro-forma
-3.0% appreciation · 2.06% rent growth · sell at horizon
- IRR
- -17.8%
- Equity multiple
- 0.38×
- Total profit
- $-81,840
- Equity at exit
- $70,064
- IRR
- -11.8%
- Equity multiple
- 0.32×
- Total profit
- $-88,880
- Equity at exit
- $40,628
Cash invested: $131,572 (down + closing). Projections, not guarantees.
Landlord ↔ Tenant lean methodology
- Overall (STATE)
- 87 Strongly Landlord-Friendly
- State Texas
- 87 Strongly Landlord-Friendly · R+5
- County
- — inherits STATE
- City
- — inherits STATE
ZIP-level market 79938
- Home prices YoY
- -8.6%
- Rents YoY
- 2.1%
- Active inventory
- 1183
- Price-to-rent
- 19.2×
Monthly cashflow live
- Estimated rent
- $4,072 high interval (Pro) →
- Mortgage (P&I)
- −$2,464
- Tax est. 1.5%
- −$587 /mo · $7,048/yr
- Insurance
- −$196
- HOA
- −$0
- Vacancy / Maint / Mgmt
- −$855
- Net cashflow
- $-30
Break-even live
2-unit breakdown (identical units grouped — click to expand)
| Units | Beds | Baths | Est. rent |
|---|---|---|---|
| 2× units | 3 | 2 | $4,072 |
| #1 | 3 | 2 | $2,036 |
| #2 | 3 | 2 | $2,036 |
| Total (2 units) | $4,072 | ||
UW: 25.0% down · 7.5% · 30yr · 1.5% tax · 5.0% vac · 8.0% maint · 8.0% mgmt
Financing live
Cash to close
- Down payment
- $117,475
- Closing costs
- $14,097
- Reserves months
- —
- Total cash needed
- —
Loan-product check · same deal, 3 products live
Conventional
25% down · 7.5% · 30yr
- Down + closing
- —
- Monthly P&I
- —
- Monthly cashflow
- —
- DSCR
- —
- Eligible?
- —
Personal DTI + credit; lowest rate.
DSCR
20% down · 8.5% · 30yr
- Down + closing
- —
- Monthly P&I
- —
- Monthly cashflow
- —
- DSCR
- —
- Eligible?
- —
No personal income docs; deal must DSCR.
Hard money
10% down · 12.0% · 12mo
- Down + closing
- —
- Monthly P&I
- —
- Monthly cashflow
- —
- DSCR
- —
- Eligible?
- —
Short-term bridge; refi at stabilization.
Listing history 16 events
-
2026-06-18days on market $469,900 Active 28 DOM
-
2026-06-17days on market $469,900 Active 27 DOM
-
2026-06-16days on market $469,900 Active 26 DOM
-
2026-06-15days on market $469,900 Active 25 DOM
-
2026-06-13days on market $469,900 Active 23 DOM
-
2026-06-10days on market $469,900 Active 20 DOM
-
2026-06-09days on market $469,900 Active 19 DOM
-
2026-06-08days on market $469,900 Active 18 DOM
-
2026-06-07days on market $469,900 Active 17 DOM
-
2026-06-05days on market $469,900 Active 14 DOM
-
2026-06-03days on market $469,900 Active 13 DOM
-
2026-06-03days on market $469,900 Active 12 DOM
-
2026-06-01days on market $469,900 Active 11 DOM
-
2026-05-31days on market $469,900 Active 10 DOM
-
2026-05-02$469,900 Active
-
2022-08-08price $1,585
ⓘ Source: listings_history table (triggers on properties + properties_extension) + one-shot
backfill from property_details.listing_events for pre-trigger history.
Climate risk First Street
- Flood 1/10 Low FEMA zone X · 0% chance over 30 yrs
- Wildfire 3/10 Moderate
- Heat 6/10 Major 7 d/yr ≥100°F today · 25 d/yr by 30 yrs out
- Wind 1/10 Low
- Air quality 3/10 Moderate 2 unhealthy d/yr today · 2 by 30 yrs out
Nearby sold comps map
Loading sold comps map…
Walkable amenities ~0.75 mi
Loading nearby amenities…
Taxation est. · year 1
- Rental income
- $48,864
- − Mortgage interest
- −$26,322
- − Property taxes
- −$7,048
- − Insurance
- −$2,350
- − Repairs & maintenance
- −$3,909
- − Management
- −$3,909
- − Depreciation
- −$13,670
- Taxable loss
- −$8,344
- Est. tax savings @ 24.0%
- +$2,003
- After-tax cash flow
- $1,637/yr
For passive investors: Depreciation is non-cash, so a rental often shows a tax loss while cash-flowing — sheltering income. Rental losses are passive: they offset passive income freely, and up to $25,000/yr can offset ordinary (W-2) income if you actively participate and your MAGI is under $100k (phasing out to $0 by $150k); unused losses carry forward. On sale, claimed depreciation is recaptured at up to 25%, and gains may owe capital-gains tax (a 1031 exchange can defer both). Figures are a year-1 estimate at your 24.0% rate — not tax advice; consult a CPA.
Condition & rehab AI · 12 photos
This well-maintained, fully occupied duplex is in good condition with minor updates needed to enhance its curb appeal and interior aesthetics. The property is located in a peaceful cul-de-sac with easy access to I-10 and Ft. Bliss.
Repairs flagged
- Minor Kitchen cabinets — Aesthetic update needed.
- Minor Kitchen countertops — Clean and remove stains.
- Minor Paint touch-ups — Faded areas need fresh paint.
Value-add opportunities
- Both Paint interior walls — Fresh paint enhances curb appeal and interior aesthetics.
- Both Replace kitchen cabinets — Modern cabinets improve functionality and aesthetics.
- Both Replace kitchen countertops — New countertops add value and functionality.
- Both Replace blinds — Fresh blinds improve natural light and aesthetics.
- Both Deep clean bathrooms — Clean bathrooms are essential for both resale and rental value.
- Both Landscaping — Landscaping enhances curb appeal and adds value to the property.
Renovation cost estimate screening
| Repair item | Severity | Est. cost |
|---|---|---|
| Kitchen cabinets · Aesthetic update needed. | Minor | $500–3,000 |
| Kitchen countertops · Clean and remove stains. | Minor | $500–3,000 |
| Paint touch-ups · Faded areas need fresh paint. | Minor | $500–3,000 |
| Total estimated repair cost · 3 items | $1,500–9,000 |
Value-add ROI direction
- Both Paint interior walls — Fresh paint enhances curb appeal and interior aesthetics. ↑
- Both Replace kitchen cabinets — Modern cabinets improve functionality and aesthetics. ↑
- Both Replace kitchen countertops — New countertops add value and functionality. ↑
- Both Replace blinds — Fresh blinds improve natural light and aesthetics. ↑
- Both Deep clean bathrooms — Clean bathrooms are essential for both resale and rental value. ↑
- Both Landscaping — Landscaping enhances curb appeal and adds value to the property. ↑
ⓘ Cost ranges are severity-bucket heuristics (US national rule-of-thumb). Get contractor quotes + a written scope before underwriting a rehab budget.
Schools (NCES district)
- District
- Socorro ISD
- NCES district ID
- 4840710
- Math proficiency
- 23% ▼ -34.00%
- Reading proficiency
- 36% ▼ -14.00%
- Median HH income
- $49,318
- Composite
- 25.67/100
- National rank
- #7396
- State rank
- #624 of 826 in TX
Livability — El Paso
- Score
- 81/100
- State rank
- #23
- US rank
- #1375
Category grades
Schools grade is shown separately in the Schools card above.
Census & demographics
- Census place
- El Paso, TX
- County
- El Paso County · 761,266 people
- City population
- 630,223
- Metro
- El Paso, TX
- Population (ZIP)
- 99,621
- Household income
- $77,272
- Rent vs Own
- Severe rent burden
- 900.0
Population outlook (El Paso County) Hauer SSP2
- Today (2025)
- 897,899 people
- By 2030
- 922,694 · +2.8%
- By 2040
- 960,492 · +7.0%
- By 2050
- 982,919 · +9.5%
- By 2075
- 997,266 · +11.1%
- By 2100
- 900,630 · +0.3%
Race, ethnicity, and origin ACS 2023
- Neighborhood character
- Predominantly Hispanic (83%)
- Race & ethnicity
- Hispanic / Latino 83% Two or more races 42% White 10% Black 4%
- Hispanic origin (detail)
- Mexican 76% Puerto Rican 1%
- Common ancestry
- Italian 1% Lithuanian 1%
- Foreign-born
- 20% · Canada, Guatemala
- Languages at home
- 36% English-only · Spanish 62%
Political lean MEDSL · El Paso
- 2024 margin
- D (+15.1) · D 57.0% · R 41.8% · Other 1.2%
- 2008→2024 swing
- -17.4pp toward R · 2008: 32.5pp · 2024: 15.1pp
- All cycles
- 2024: D+15.1 2020: D+35.1 2016: D+43.2 2012: D+32.6 2008: D+32.5
Not yet ingested
- Civics
- —
Market trends
- HPI YoY
- ▼ -19.39%
- Current HPI
- 207.2031
- Rent YoY
- ▲ 2.06%
- Metro
- El Paso, TX
- State GDP YoY
- ▲ 3.95%
- F500 in state
- 110
Industry mix (Fortune 500 HQ in TX)
| Industry | F500 HQs | Revenue |
|---|---|---|
| Energy | 16 | $1,198B |
|
||
| Technology | 5 | $198B |
|
||
| Engineering / Construction | 4 | $72B |
|
||
| Energy Services | 3 | $60B |
|
||
| Utilities | 3 | $41B |
|
||
| Healthcare | 2 | $330B |
|
||
Price history
+29546.7% since first listed2 events — show timeline
- 2026-05-02 Listed $469,900 GEPARMLS
- 2022-08-08 Price Changed $1,585 RENT.
Cash-flow waterfall
monthlySold comps — $/sqft
last 12 mo · ≤1 miLoading sold comps…