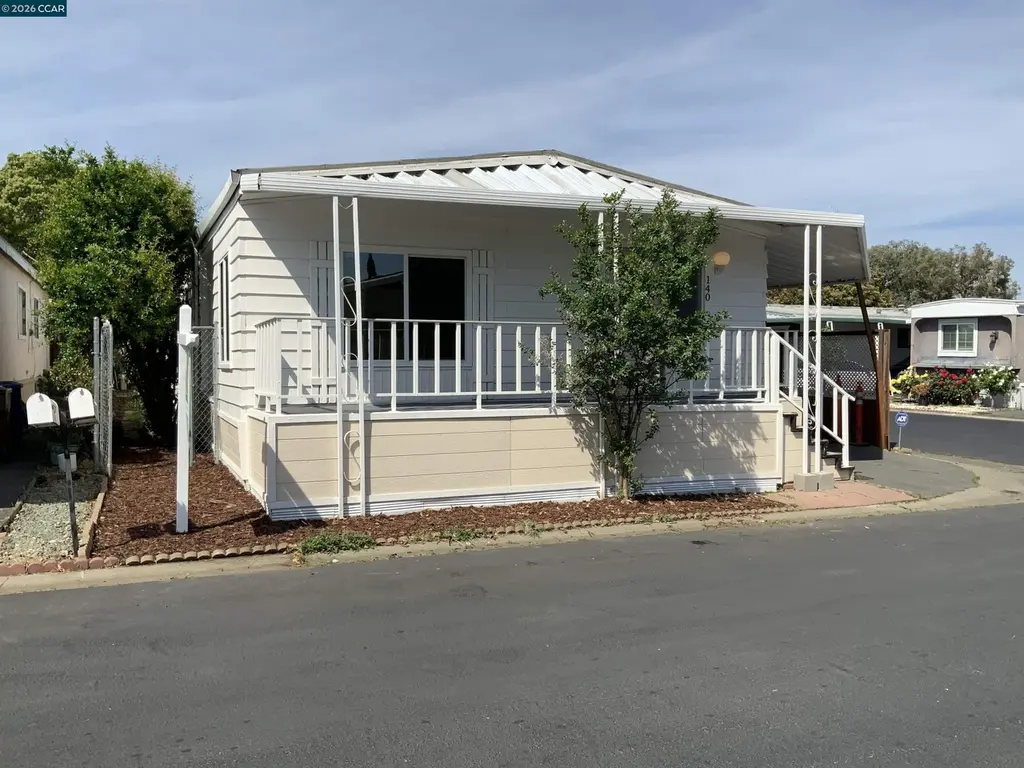
140 Shannon · Pittsburg, CA
Flood risk 1/10 · Minimal
- FEMA flood zone
- X (unshaded)
- Chance of flooding over 30 yrs
- 0.0%
- Est. flood insurance / yr
- $507 – $1,088
Fire risk 6/10 · Moderate
- Est. fire insurance / yr
- $659 – $1,223
Heat risk 5/10 · Moderate
- Hot days now (above 97°F)
- 7 days/yr
- Hot days in 30 yrs
- 14 days/yr
Wind risk 1/10 · Minimal
- Chance of severe wind over 30 yrs
- —
Air-quality risk 8/10 · Major
- Unhealthy air days now
- 14 days/yr
- Unhealthy air days in 30 yrs
- 14 days/yr
Risk factors via First Street. Map © Google.
Why this score? — see what drove the B- grade
The composite is a weighted blend of 9 inputs, each scored 0–100. Each bar is that input's sub-score; the figure is the points it added to the 100-point composite (weight × sub-score).
- Cash flow +30.0/30.0
- DSCR +10.0/10.0
- 1% rule +9.4/10.0
- ARV discount +6.0/15.0
- Condition / age +4.0/5.0
- Livability +2.9/5.0
- Rent growth +2.8/5.0
- Schools +2.8/10.0
- Appreciation +0.0/10.0
$235,000
🖨 Deal sheet (PDF) 📄 Offer letter ✓ Due diligence
Listing remarks
Beautifully upgraded 4 bedroom, 2-bath home featuring numerous improvements! Located on a corner lot in The Meadows family park, this light-filled residence offers a spacious living area that flows seamlessly into the adjoining kitchen. The kitchen boasts abundant granite counter space and ample storage, including a separate walk-in pantry, along with a full suite of appliances—dishwasher, microwave, and refrigerator included. The guest bathroom has been updated with a new vanity and features a shower over the tub. Both secondary bedrooms are generously sized and include mirrored closet doors. The expansive primary bedroom also features mirrored closet doors, while the ensuite bathroo
Key facts
- Spacious living area
- Corner lot
- 2 garage spots
Tags
Property features AI
Finance
- HOA & community: Pets allowed upon approval; Community amenities include clubhouse, pool, and greenbelt; Located in THE MEADOWS park
Exterior
- Parking: 2 garage spaces; Carport for 2 or more vehicles (covered)
- Utilities: Public water; Public sewer
- Home design: Manufactured home located in a park; Double wide model (Biltmore)
- Construction: Aluminum siding; Crawl space foundation
- Exterior features: Front porch; Corner lot; Community pool; Community clubhouse; Greenbelt
Interior
- Kitchen: Kitchen island; Stone counters; Breakfast bar; Dishwasher; Disposal; Gas range / cooktop; Free‑standing range; Microwave; Refrigerator; Pantry; Range/oven (free standing)
- Bedrooms: 3 bedrooms (street level)
- Flooring: Tile flooring; Vinyl flooring
- Bathrooms: 2 full bathrooms; Primary bath with stall shower and sunken tub; Other bath(s) with shower over tub
- Heating & cooling: Forced air heating; Central air conditioning; Ceiling fans
- Interior features: Breakfast bar; Pantry; Mirrored closet doors; No additional rooms listed
- Laundry & utility: Laundry room with washer and dryer; Cabinets in laundry area; Gas water heater
Neighborhood map
What this means for you Summary
Snapshot
- This is a 4-bed/2.0-bath manufactured listed at $235k. Condition is rated good.
Deal economics
- At list price, monthly cash flow is $1k ($13k/yr) — positive.
- The deal already cash-flows at list — no discount required.
- Meets the 1% rule at list price ($3k rent vs $235k).
- Recommended offer: $231k (1.5% below list) — sets the bar for market timing.
- Cap rate 11.6% vs local median 3.4% in Pittsburg — top-decile yield for the area; either an underpriced asset or a hidden risk that comps aren't pricing in. Stress-test before assuming the spread holds.
Location & tenants
- Location reads 58/100 on livability (#687 in CA) — a working-class tenant base; expect higher turnover. Strengths: employment A+, housing A+; Watch: schools F, crime D-, amenities F.
- Pittsburg Unified (suburban): math 21% / reading 35% proficiency, ranked #1,069 of 1,400 in CA (top 76%) — low school quality limits family demand, transient renter base, plan for 1-2y turnover; 66% free/reduced lunch — lower-income household profile, screen leases tightly.
- Market conditions: Rents rising (+1.1%/yr); 271 active listings in the ZIP; 5 comparable units currently listed for rent nearby; rentals at typical pace (median 14d on market — plan ~3-4 weeks tenant-placement turnaround); solid renter incomes; 2,169 units permitted in Contra Costa County in 2024 (896 in 5+ unit buildings).
- This rent runs 42% of the median local income ($96k/yr) — at the standard rent-burdened threshold; future hikes will face affordability resistance.
Forward outlook
- Local home prices are declining (-3.0%/yr); year-one equity from $2k of loan paydown is wiped out by about $7k of value loss. Plan a longer hold.
- Contra Costa County population projected at +26% by 2050 — long-run rental-demand tailwind backs the buy-and-hold thesis.
- At projected returns (-3.0% appreciation + 1.1% rent growth), your $66k cash investment doubles in ~8 years — after that, you're playing with house money.
Negotiation context
- It's been on market 19 days — a 2% lower offer ($231k) is reasonable based on typical stale-listing flexibility.
- 2 sale attempts with the ask held roughly flat each time — persistent listings suggest the price (not the market) is what's stuck; bring a comps-based counter.
Risks & watch-outs
- Climate carrying-cost: major wildfire risk; extreme-heat days projected 7→14/yr by 2055 (HVAC capex compounding) — expect insurance premiums to compound above CPI over the hold.
Questions for the listing agent
- Built in 1978 — when were the roof, HVAC, electrical panel, plumbing, and water heater last replaced?
- Is there a deadline driving the sale (1031 exchange, divorce, estate, relocation)? That informs how much negotiation room exists.
- Schools are F-rated, which usually means shorter tenancies and higher turnover. Who's the typical renter profile here, and what's been the actual vacancy rate?
- Crime grade is D in this area — have there been break-ins, vandalism, or insurance claims at this property in the last 3 years? What carrier currently insures it and at what premium?
- What's the average days-on-market for RENTAL listings here right now (not sales)? A rising rental-DOM trend means longer vacancies and softer asking-rent achievability than the comps imply.
- What's the recent tenant-quality profile in this submarket — average credit score on applications, eviction rate, late-payment / NSF rate, and stable-employment percentage? A property-management company in the area should have these aggregated.
- How much new for-sale + rental construction is in the pipeline within 1–3 miles? Heavy new supply typically softens prices + rents 12–24 months out; constrained supply supports both.
Investment metrics
- 1% rule
- 1.44% ✓
- Cap rate
- 11.63%
- Cash-on-cash
- 19.07%
- DSCR
- 1.85
- GRM
- 5.8
CMA / ARV
- ARV (on-the-fly)
- $227,520
- Comps found
- 6
Show comp detail 6 sales within ~0.75 mi
| Address | Dist | Beds/Ba | Sqft | Sold | Price | $/sf | Match |
|---|---|---|---|---|---|---|---|
| 140 Shannon | 0.00mi | 4/2.0 | 1,440 (0%) | 0mo | $228,000 | $158 | 100 |
| 285 Auburn | 0.18mi | 4/2.0 | 1,488 (+3%) | 5mo | $225,000 | $151 | 82 |
| 364 Stonyford Dr | 0.16mi | 3/2.0 (-1) | 1,536 (+7%) | 8mo | $165,000 | $107 | 70 |
| 308 Jacinto | 0.12mi | 4/2.0 | 1,306 (-9%) | 12mo | $265,000 | $203 | 69 |
| 352 Blackleaf #352 | 0.15mi | 3/2.5 (-1) | 1,440 (0%) | 23mo | $225,000 | $156 | 67 |
| 131 Klamath | 0.06mi | 3/2.0 (-1) | 1,224 (-15%) | 10mo | $196,000 | $160 | 59 |
Match score weights: distance 35% · size 25% · config 20% · recency 20%. Top-matched comps best support the ARV.
Projected returns pro-forma
-3.0% appreciation · 1.11% rent growth · sell at horizon
- IRR
- 8.8%
- Equity multiple
- 1.34×
- Total profit
- $22,256
- Equity at exit
- $35,039
- IRR
- 16.4%
- Equity multiple
- 2.22×
- Total profit
- $80,417
- Equity at exit
- $20,319
Cash invested: $65,800 (down + closing). Projections, not guarantees.
Landlord ↔ Tenant lean methodology
- Overall (STATE)
- 18 Strongly Tenant-Friendly
- State California
- 18 Strongly Tenant-Friendly · D+13
- County
- — inherits STATE
- City
- — inherits STATE
ZIP-level market 94565
- Rents YoY
- 1.1%
- Active inventory
- 271
- Price-to-rent
- 5.8×
Monthly cashflow live
- Estimated rent
- $3,379 high interval (Pro) →
- Mortgage (P&I)
- −$1,232
- Tax est. 1.5%
- −$294 /mo · $3,525/yr
- Insurance
- −$98
- HOA
- −$0
- Vacancy / Maint / Mgmt
- −$710
- Net cashflow
- $1,046
Break-even live
Sensitivity live
| Price | -10% $1,208 | -5% $1,127 | +0% $1,046 | +5% $964 | +10% $883 |
|---|---|---|---|---|---|
| Rent | -10% $779 | -5% $912 | +0% $1,046 | +5% $1,179 | +10% $1,313 |
| Rate | -1.0pp $1,164 | -0.5pp $1,105 | base $1,046 | +0.5pp $985 | +1.0pp $923 |
UW: 25.0% down · 7.5% · 30yr · 1.5% tax · 5.0% vac · 8.0% maint · 8.0% mgmt
Financing live
Cash to close
- Down payment
- $58,750
- Closing costs
- $7,050
- Reserves months
- —
- Total cash needed
- —
Loan-product check · same deal, 3 products live
Conventional
25% down · 7.5% · 30yr
- Down + closing
- —
- Monthly P&I
- —
- Monthly cashflow
- —
- DSCR
- —
- Eligible?
- —
Personal DTI + credit; lowest rate.
DSCR
20% down · 8.5% · 30yr
- Down + closing
- —
- Monthly P&I
- —
- Monthly cashflow
- —
- DSCR
- —
- Eligible?
- —
No personal income docs; deal must DSCR.
Hard money
10% down · 12.0% · 12mo
- Down + closing
- —
- Monthly P&I
- —
- Monthly cashflow
- —
- DSCR
- —
- Eligible?
- —
Short-term bridge; refi at stabilization.
Rent comps 5 comps
| Address | Beds | Baths | Sqft | Rent | $/sqft | DOM | Units | Dist |
|---|---|---|---|---|---|---|---|---|
| 1093 Mayport Dr Pittsburg, CA | 4.0 | 2.5 | 1865 | $3,500 | $1.88 | 14d | 1 | 0.34mi |
| 332 Riptide Ct Pittsburg, CA | 3.0 | 2.0 | 1167 | $2,795 | $2.40 | 14d | 1 | 0.44mi |
| 244 Balsam St Pittsburg, CA | 4.0 | 2.5 | 1699 | $3,600 | $2.12 | 45d | 1 | 0.72mi |
| 61 Cassia St Pittsburg, CA | 4.0 | 2.5 | 1699 | $3,400 | $2.00 | 14d | 1 | 0.85mi |
| 135 Poinsettia Ave Bay Point, CA | 3.0 | 1.0 | 1169 | $2,700 | $2.31 | 0d | 1 | 1.45mi |
Listing history 4 events
-
2026-05-14status Pending
-
2026-05-09status Active
-
2026-04-12status Pending
-
2026-03-29$235,000 Active
ⓘ Source: listings_history table (triggers on properties + properties_extension) + one-shot
backfill from property_details.listing_events for pre-trigger history.
Climate risk First Street
- Flood 1/10 Low FEMA zone X (unshaded) · 0% chance over 30 yrs
- Wildfire 6/10 Major
- Heat 5/10 Major 7 d/yr ≥97°F today · 14 d/yr by 30 yrs out
- Wind 1/10 Low
- Air quality 8/10 Severe 14 unhealthy d/yr today · 14 by 30 yrs out
Nearby sold comps map
Loading sold comps map…
Walkable amenities ~0.75 mi
Loading nearby amenities…
Taxation est. · year 1
- Rental income
- $40,551
- − Mortgage interest
- −$13,164
- − Property taxes
- −$3,525
- − Insurance
- −$1,175
- − Repairs & maintenance
- −$3,244
- − Management
- −$3,244
- − Depreciation
- −$6,836
- Taxable income
- $9,363
- Est. tax owed @ 24.0%
- −$2,247
- After-tax cash flow
- $10,300/yr
For passive investors: Depreciation is non-cash, so a rental often shows a tax loss while cash-flowing — sheltering income. Rental losses are passive: they offset passive income freely, and up to $25,000/yr can offset ordinary (W-2) income if you actively participate and your MAGI is under $100k (phasing out to $0 by $150k); unused losses carry forward. On sale, claimed depreciation is recaptured at up to 25%, and gains may owe capital-gains tax (a 1031 exchange can defer both). Figures are a year-1 estimate at your 24.0% rate — not tax advice; consult a CPA.
Condition & rehab AI · 13 photos
This well-maintained, upgraded mobile home is move-in ready with good condition and potential for further value through exterior painting and landscaping improvements.
Value-add opportunities
- Both paint exterior — enhances curb appeal and resale value
- Both trim landscaping — improves curb appeal and rental appeal
Renovation cost estimate screening
Value-add ROI direction
- Both paint exterior — enhances curb appeal and resale value ↑
- Both trim landscaping — improves curb appeal and rental appeal ↑
ⓘ Cost ranges are severity-bucket heuristics (US national rule-of-thumb). Get contractor quotes + a written scope before underwriting a rehab budget.
Schools (NCES district)
- District
- Pittsburg Unified
- NCES district ID
- 0630600
- Math proficiency
- 21% ▲ 1.00%
- Reading proficiency
- 35% ▲ 1.00%
- Median HH income
- $55,872
- Composite
- 27.99/100
- National rank
- #12238
- State rank
- #1069 of 1400 in CA
Livability — Pittsburg
- Score
- 58/100
- State rank
- #687
- US rank
- #20922
Category grades
Schools grade is shown separately in the Schools card above.
Census & demographics
- Census place
- Pittsburg, CA
- County
- Contra Costa County · 1,059,880 people
- City population
- 100,488
- Metro
- San Francisco-Oakland-Berkeley, CA
- Population (ZIP)
- 100,488
- Household income
- $95,556
- Rent vs Own
- Severe rent burden
- 3942.0
Population outlook (Contra Costa County) Hauer SSP2
- Today (2025)
- 1,287,720 people
- By 2030
- 1,364,937 · +6.0%
- By 2040
- 1,506,209 · +17.0%
- By 2050
- 1,624,373 · +26.1%
- By 2075
- 1,853,193 · +43.9%
- By 2100
- 1,901,231 · +47.6%
Race, ethnicity, and origin ACS 2023
- Neighborhood character
- Diverse neighborhood (Simpson 0.70)
- Race & ethnicity
- Hispanic / Latino 48% Two or more races 19% Asian 17% White 16% Black 13% Pacific Islander 1% Native American 1%
- Hispanic origin (detail)
- Mexican 38% Puerto Rican 1%
- Common ancestry
- Italian 1% Russian 1% Lithuanian 1%
- Foreign-born
- 34% · Canada, China, Vietnam
- Languages at home
- 47% English-only · Spanish 37% Tagalog/Filipino 6% Other Indo-European 4%
Political lean MEDSL · Contra Costa
- 2024 margin
- Solid D (+38.0) · D 67.3% · R 29.4% · Other 3.3%
- 2008→2024 swing
- +0.2pp no change · 2008: 37.8pp · 2024: 38.0pp
- All cycles
- 2024: D+38.0 2020: D+45.3 2016: D+43.5 2012: D+33.7 2008: D+37.8
Not yet ingested
- Civics
- —
Market trends
- HPI YoY
- ▼ -478.40%
- Current HPI
- 376.2576
- Rent YoY
- ▲ 1.11%
- Metro
- San Francisco-Oakland-Berkeley, CA
- State GDP YoY
- ▲ 3.21%
- F500 in state
- 116
Industry mix (Fortune 500 HQ in CA)
| Industry | F500 HQs | Revenue |
|---|---|---|
| Technology | 27 | $1,492B |
|
||
| Financial Services | 3 | $174B |
|
||
| Retail | 3 | $44B |
|
||
| Insurance | 3 | $26B |
|
||
| Media / Entertainment | 2 | $115B |
|
||
| Pharmaceuticals / Biotech | 2 | $62B |
|
||
Price history
4 events — show timeline
- 2026-05-14 Pending — bridgeMLS, Bay East AOR, or Contra Costa AOR
- 2026-05-09 Relisted — bridgeMLS, Bay East AOR, or Contra Costa AOR
- 2026-04-12 Pending — bridgeMLS, Bay East AOR, or Contra Costa AOR
- 2026-03-29 Listed $235,000 bridgeMLS, Bay East AOR, or Contra Costa AOR
Cash-flow waterfall
monthlySold comps — $/sqft
last 12 mo · ≤1 miLoading sold comps…