 Multi-family
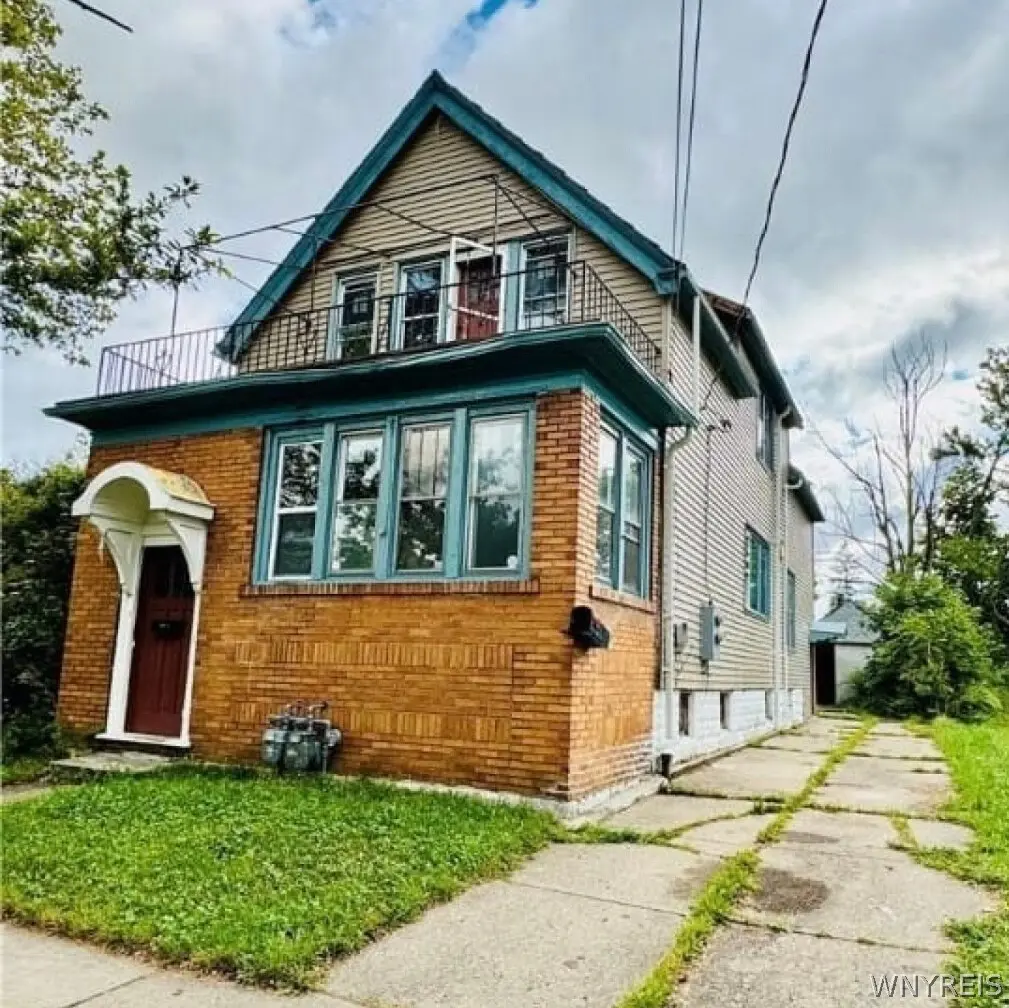
351 Moselle St · Buffalo, NY
Flood risk 9/10 · Severe
- FEMA flood zone
- X (unshaded)
- Chance of flooding over 30 yrs
- 0.99%
- Est. flood insurance / yr
- $473 – $860
Fire risk 1/10 · Minimal
- Est. fire insurance / yr
- $691 – $1,283
Heat risk 2/10 · Minimal
- Hot days now (above 93°F)
- 7 days/yr
- Hot days in 30 yrs
- 15 days/yr
Wind risk 1/10 · Minimal
- Chance of severe wind over 30 yrs
- —
Air-quality risk 3/10 · Minor
- Unhealthy air days now
- 2 days/yr
- Unhealthy air days in 30 yrs
- 3 days/yr
Risk factors via First Street. Map © Google.
Why this score? — see what drove the B grade
The composite is a weighted blend of 9 inputs, each scored 0–100. Each bar is that input's sub-score; the figure is the points it added to the 100-point composite (weight × sub-score).
- Cash flow +27.7/30.0
- DSCR +9.7/10.0
- 1% rule +7.6/10.0
- ARV discount +7.5/15.0
- Appreciation +6.0/10.0
- Livability +3.9/5.0
- Schools +3.3/10.0
- Rent growth +2.5/5.0
- Condition / age +2.5/5.0
$189,999
🖨 Deal sheet 📄 Offer letter ✓ Due diligence
Multi-family units
County records classify this as Multi-Family (2-4 Unit). Listing-text estimate: 1 unit. estimate disagrees with records
Listing remarks
Welcome to a solid multi family house on Moselle St. This is an investment property. Located 4-5 minutes from ECMC, supermarket, restaurant and amenities. Each apartment has 3 bedrooms and 1 bathroom. Also has a full basement and full attic. Renovated some roof 2021, furnace 2021, some new floors 2024, Hot Water Tank 2021, and some windows 2024. You also have some opportunities, Seller has Vacant lot (349 Moselle St, lot frontage 30 & depth 105) Next to Selling House perfect for yard, parking or future development. Don't miss this opportunity!
Key facts
- Investment property
- Full basement
- Renovated furnace
Tags
Neighborhood map
What this means for you Summary
Snapshot
- This is a 5-bed/2.0-bath multifamily listed at $190k.
Deal economics
- At list price, monthly cash flow is $517 ($6k/yr) — positive.
- The deal already cash-flows at list — no discount required.
- Meets the 1% rule at list price ($2k rent vs $190k).
- Cap rate 9.9% vs local median 8.0% in Buffalo — meaningfully above typical; check what's discounted (condition, days-on-market, listing class) to confirm the premium yield is real.
Location & tenants
- Location reads 77/100 on livability (#195 in NY, #3,011 nationally) — a middle-class / working-renter tenant base. Strengths: commute A+, housing A+, health & safety A+; Watch: crime F, employment D-.
- Buffalo City School District (urban): math 41% / reading 40% proficiency, ranked #535 of 590 in NY (top 91%) — families likely to look elsewhere, expect single-tenant / working-renter base with shorter leases; 75% free/reduced lunch — lower-income household profile, screen leases tightly.
- Market conditions: 172 active listings in the ZIP; 3 comparable units currently listed for rent nearby; rentals at typical pace (median 15d on market — plan ~3-4 weeks tenant-placement turnaround); lower-income renter base — watch delinquency; 1,244 units permitted in Erie County in 2024 (563 in 5+ unit buildings).
- At $2,387/mo this rent would consume 79% of the median local household income ($36k/yr) (locally 1804% of renters already pay >50% of income on rent) — very limited rent-growth headroom before tenants either downsize or default.
Forward outlook
- In year one you build about $5k of equity ($1k loan paydown + $4k appreciation (2.0% local appreciation)).
- At projected returns (2.0% appreciation + 3.0% rent growth), your $53k cash investment doubles in ~5 years — after that, you're playing with house money.
- By year 7, paydown + projected appreciation supports a ~$33k cash-out refi (75% LTV) — recoverable capital for the next deal without selling this one.
Negotiation context
- Only 14 days on market — expect competitive offers; lowballing is unlikely to land.
- 6 sale attempts with the ask held roughly flat each time — persistent listings suggest the price (not the market) is what's stuck; bring a comps-based counter.
Risks & watch-outs
- Watch-outs: flood insurance adds $56/mo; built in 1900 — expect roof / HVAC / electrical / plumbing capex.
- Climate carrying-cost: severe flood risk — expect insurance premiums to compound above CPI over the hold.
Questions for the listing agent
- Built in 1900 — when were the roof, HVAC, electrical panel, plumbing, and water heater last replaced?
- What's the actual annual flood-insurance premium (NFIP or private), and is the property in a SFHA with mandatory coverage?
- Is there a deadline driving the sale (1031 exchange, divorce, estate, relocation)? That informs how much negotiation room exists.
- Crime grade is F in this area — have there been break-ins, vandalism, or insurance claims at this property in the last 3 years? What carrier currently insures it and at what premium?
- What's the average days-on-market for RENTAL listings here right now (not sales)? A rising rental-DOM trend means longer vacancies and softer asking-rent achievability than the comps imply.
- What's the recent tenant-quality profile in this submarket — average credit score on applications, eviction rate, late-payment / NSF rate, and stable-employment percentage? A property-management company in the area should have these aggregated.
- How much new apartment / multifamily construction is in the pipeline within 1–3 miles? Heavy new supply (>2% of stock underway) typically softens rents 12–24 months out; light construction supports rent growth.
Investment metrics
- 1% rule
- 1.26% ✓
- Cap rate
- 9.91%
- Cash-on-cash
- 12.92%
- DSCR
- 1.57
- GRM
- 6.6
CMA / ARV
- ARV (on-the-fly)
- $97,620
- Comps found
- 12
Show comp detail 12 sales within ~0.75 mi
| Address | Dist | Beds/Ba | Sqft | Sold | Price | $/sf | Match |
|---|---|---|---|---|---|---|---|
| 95 Carl St | 0.33mi | 4/2.0 (-1) | 1,632 (+0%) | 4mo | $84,000 | $51 | 76 |
| 325 Box Ave | 0.21mi | 5/2.0 | 1,524 (-6%) | 13mo | $135,000 | $89 | 69 |
| 141 Moselle St | 0.40mi | 5/2.0 | 1,730 (+6%) | 8mo | $30,000 | $17 | 64 |
| 70 Kilhoffer St | 0.36mi | 4/2.0 (-1) | 1,591 (-2%) | 18mo | $90,000 | $57 | 59 |
| 89 Wyoming Ave | 0.27mi | 4/2.0 (-1) | 1,408 (-14%) | 3mo | $85,101 | $60 | 57 |
| 262 Sumner Pl | 0.70mi | 4/2.0 (-1) | 1,660 (+2%) | 11mo | $72,000 | $43 | 50 |
| 221 May St | 0.58mi | 5/2.0 | 1,794 (+10%) | 8mo | $91,000 | $51 | 49 |
| 509 Winslow Ave | 0.50mi | 4/2.0 (-1) | 1,731 (+6%) | 18mo | $40,000 | $23 | 46 |
| 27 Rohr St | 0.70mi | 4/2.0 (-1) | 1,747 (+7%) | 7mo | $200,000 | $114 | 45 |
| 20 Ericson Ave | 0.70mi | 4/2.0 (-1) | 1,563 (-4%) | 15mo | $123,000 | $79 | 43 |
| 75 Box Ave | 0.64mi | 4/2.0 (-1) | 1,817 (+12%) | 6mo | $117,000 | $64 | 41 |
| 49 Urban St | 0.72mi | 5/3.0 | 1,849 (+14%) | 9mo | $115,000 | $62 | 32 |
Match score weights: distance 35% · size 25% · config 20% · recency 20%. Top-matched comps best support the ARV.
Projected returns pro-forma
2.05% appreciation · 3.0% rent growth · sell at horizon
- IRR
- 16.2%
- Equity multiple
- 1.87×
- Total profit
- $46,509
- Equity at exit
- $75,446
- IRR
- 18.5%
- Equity multiple
- 3.48×
- Total profit
- $131,680
- Equity at exit
- $109,034
Cash invested: $53,200 (down + closing). Projections, not guarantees.
Landlord ↔ Tenant lean methodology
- Overall (STATE)
- 15 Strongly Tenant-Friendly
- State New York
- 15 Strongly Tenant-Friendly · D+10
- County
- — inherits STATE
- City
- — inherits STATE
ZIP-level market 14211
- Home prices YoY
- 0.6%
- Active inventory
- 172
- Price-to-rent
- 13.3×
Monthly cashflow live
- Estimated rent
- $2,387 high interval (Pro) →
- Mortgage (P&I)
- −$996
- Tax est. 1.5%
- −$237 /mo · $2,850/yr
- Insurance
- −$79
- Flood insurance flood zone
- −$56 /mo · $666/yr
- HOA
- −$0
- Vacancy / Maint / Mgmt
- −$501
- Net cashflow
- $517
Break-even live
2-unit breakdown (identical units grouped — click to expand)
| Units | Beds | Baths | Est. rent |
|---|---|---|---|
| 2× units | 3 | 1 | $2,386 |
| #1 | 3 | 1 | $1,193 |
| #2 | 3 | 1 | $1,193 |
| Total (2 units) | $2,387 | ||
UW: 25.0% down · 7.5% · 30yr · 1.5% tax · 5.0% vac · 8.0% maint · 8.0% mgmt
Financing live
Cash to close
- Down payment
- $47,500
- Closing costs
- $5,700
- Reserves months
- —
- Total cash needed
- —
Loan-product check · same deal, 3 products live
Conventional
25% down · 7.5% · 30yr
- Down + closing
- —
- Monthly P&I
- —
- Monthly cashflow
- —
- DSCR
- —
- Eligible?
- —
Personal DTI + credit; lowest rate.
DSCR
20% down · 8.5% · 30yr
- Down + closing
- —
- Monthly P&I
- —
- Monthly cashflow
- —
- DSCR
- —
- Eligible?
- —
No personal income docs; deal must DSCR.
Hard money
10% down · 12.0% · 12mo
- Down + closing
- —
- Monthly P&I
- —
- Monthly cashflow
- —
- DSCR
- —
- Eligible?
- —
Short-term bridge; refi at stabilization.
Rent comps 3 comps
| Address | Beds | Baths | Sqft | Rent | $/sqft | DOM | Units | Dist |
|---|---|---|---|---|---|---|---|---|
| 184 Butler Ave Unit 1545840P Buffalo, NY | 4.0 | 1.0 | 1496 | $3,226 | $2.16 | 14d | 1 | 1.11mi |
| 518 Wilson St Buffalo, NY | 5.0 | 1.5 | 1848 | $1,500 | $0.81 | 24d | 1 | 1.26mi |
| 979 Walden Ave Buffalo, NY | 4.0 | 3.0 | 1793 | $2,000 | $1.12 | 2d | 1 | 1.31mi |
Listing history 15 events
-
2026-04-06status Pending
-
2026-03-24status Active
-
2026-03-24status Pending
-
2026-03-23$189,999 Active
-
2026-01-25historical $1,000
-
2025-11-29historical
-
2025-11-10$1,000
-
2025-11-09historical $1,000
-
2025-11-07$1,000
-
2025-08-29$189,999 Active
-
2025-07-31historical
-
2025-07-17price $174,900
-
2025-06-20price $179,900
-
2025-05-19price $185,000
-
2025-04-24$189,900 Active
ⓘ Source: listings_history table (triggers on properties + properties_extension) + one-shot
backfill from property_details.listing_events for pre-trigger history.
Climate risk First Street
- Flood 9/10 Extreme FEMA zone X (unshaded) · 99% chance over 30 yrs
- Wildfire 1/10 Low
- Heat 2/10 Low 7 d/yr ≥93°F today · 15 d/yr by 30 yrs out
- Wind 1/10 Low
- Air quality 3/10 Moderate 2 unhealthy d/yr today · 3 by 30 yrs out
Nearby sold comps map
Loading sold comps map…
Walkable amenities ~0.75 mi
Loading nearby amenities…
Taxation est. · year 1
- Rental income
- $28,644
- − Mortgage interest
- −$10,643
- − Property taxes
- −$2,850
- − Insurance
- −$1,616
- − Repairs & maintenance
- −$2,292
- − Management
- −$2,292
- − Depreciation
- −$5,527
- Taxable income
- $3,424
- Est. tax owed @ 24.0%
- −$822
- After-tax cash flow
- $5,384/yr
For passive investors: Depreciation is non-cash, so a rental often shows a tax loss while cash-flowing — sheltering income. Rental losses are passive: they offset passive income freely, and up to $25,000/yr can offset ordinary (W-2) income if you actively participate and your MAGI is under $100k (phasing out to $0 by $150k); unused losses carry forward. On sale, claimed depreciation is recaptured at up to 25%, and gains may owe capital-gains tax (a 1031 exchange can defer both). Figures are a year-1 estimate at your 24.0% rate — not tax advice; consult a CPA.
Schools (NCES district)
- District
- Buffalo City School District
- NCES district ID
- 3605850
- Math proficiency
- 41% ▲ 11.00%
- Reading proficiency
- 40% ▲ 7.00%
- Median HH income
- $31,665
- Composite
- 33.17/100
- National rank
- #5544
- State rank
- #535 of 590 in NY
Livability — Buffalo
- Score
- 77/100
- State rank
- #195
- US rank
- #3011
Category grades
Schools grade is shown separately in the Schools card above.
Census & demographics
- Census place
- Buffalo, NY
- County
- Erie County · 714,559 people
- City population
- 440,021
- Metro
- Buffalo-Cheektowaga, NY
- Population (ZIP)
- 24,663
- Household income
- $36,300
- Rent vs Own
- Severe rent burden
- 1804.0
Population outlook (Erie County) Hauer SSP2
- Today (2025)
- 933,037 people
- By 2030
- 935,181 · +0.2%
- By 2040
- 928,531 · -0.5%
- By 2050
- 905,725 · -2.9%
- By 2075
- 834,037 · -10.6%
- By 2100
- 708,033 · -24.1%
Race, ethnicity, and origin ACS 2023
- Neighborhood character
- Diverse neighborhood (Simpson 0.60)
- Race & ethnicity
- Black 59% Asian 20% Hispanic / Latino 9% White 9% Two or more races 5%
- Hispanic origin (detail)
- Puerto Rican 6%
- Common ancestry
- Romanian 4%
- Foreign-born
- 17% · Canada, Philippines, Vietnam
- Languages at home
- 74% English-only · Other Indo-European 14% Spanish 6% Other Asian/Pacific 1%
Political lean MEDSL · Erie
- 2024 margin
- Lean D (+9.7) · D 54.8% · R 45.2%
- 2008→2024 swing
- -7.9pp toward R · 2008: 17.5pp · 2024: 9.7pp
- All cycles
- 2024: D+9.7 2020: D+14.7 2016: D+4.8 2012: D+15.6 2008: D+17.5
Not yet ingested
- Civics
- —
Market trends
- HPI YoY
- ▲ 2.05%
- Current HPI
- 357.6438
- Rent YoY
- —
- Metro
- Buffalo-Cheektowaga, NY
- State GDP YoY
- ▲ 2.60%
- F500 in state
- 92
Industry mix (Fortune 500 HQ in NY)
| Industry | F500 HQs | Revenue |
|---|---|---|
| Financial Services | 10 | $950B |
|
||
| Consumer Goods | 9 | $162B |
|
||
| Insurance | 4 | $225B |
|
||
| Telecommunications | 2 | $144B |
|
||
| Pharmaceuticals | 2 | $112B |
|
||
| Media / Entertainment | 2 | $69B |
|
||
Price history
+0.1% since first listed15 events — show timeline
- 2026-04-06 Pending — WNYREIS
- 2026-03-24 Relisted — WNYREIS
- 2026-03-24 Pending — WNYREIS
- 2026-03-23 Listed $189,999 WNYREIS
- 2026-01-25 Rental Removed $1,000 RENTSPREE
- 2025-11-29 Listing Removed — WNYREIS
- 2025-11-10 Listed for Rent $1,000 RENTSPREE
- 2025-11-09 Rental Removed $1,000 RENTSPREE
- 2025-11-07 Listed for Rent $1,000 RENTSPREE
- 2025-08-29 Listed $189,999 WNYREIS
- 2025-07-31 Listing Removed — WNYREIS
- 2025-07-17 Price Changed $174,900 WNYREIS
- 2025-06-20 Price Changed $179,900 WNYREIS
- 2025-05-19 Price Changed $185,000 WNYREIS
- 2025-04-24 Listed $189,900 WNYREIS
Property tax history
+2.5%/yrLatest (2025): $135 · +0.0% YoY. Source: county tax records.
Cash-flow waterfall
monthlySold comps — $/sqft
last 12 mo · ≤1 miLoading sold comps…