 🏷️ Likely Rental
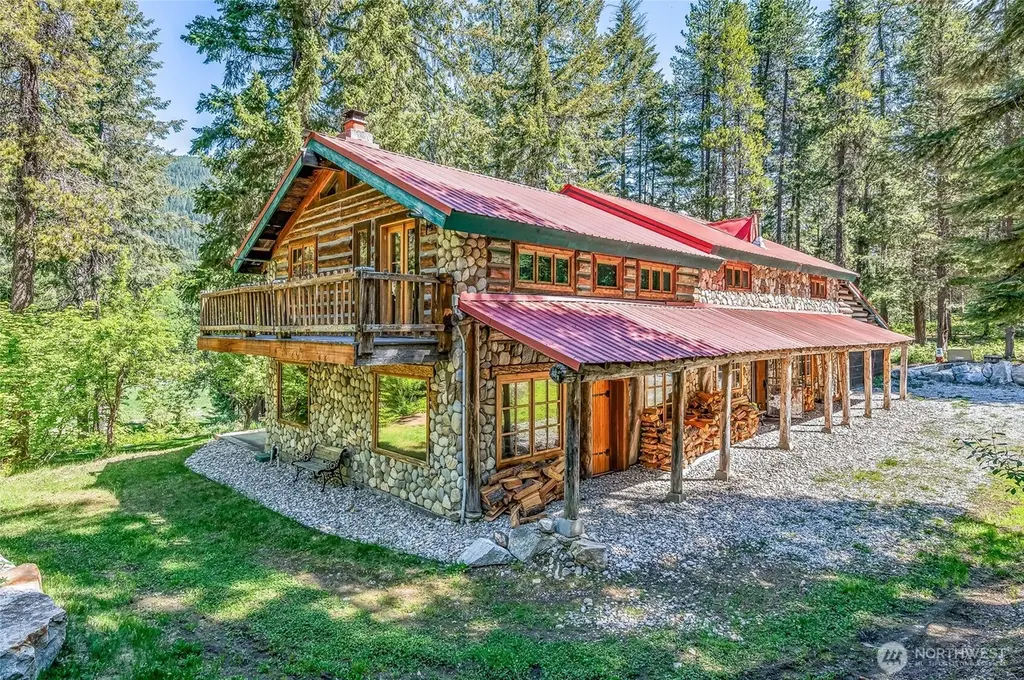
16310 Lake Wenatchee Hwy · Leavenworth, WA
Flood risk 1/10 · Minimal
- FEMA flood zone
- X
- Chance of flooding over 30 yrs
- 0.0%
- Est. flood insurance / yr
- $507 – $1,088
Fire risk 9/10 · Severe
- Est. fire insurance / yr
- $604 – $1,122
Heat risk 2/10 · Minimal
- Hot days now (above 91°F)
- 8 days/yr
- Hot days in 30 yrs
- 17 days/yr
Wind risk 1/10 · Minimal
- Chance of severe wind over 30 yrs
- —
Air-quality risk 9/10 · Severe
- Unhealthy air days now
- 17 days/yr
- Unhealthy air days in 30 yrs
- 22 days/yr
Risk factors via First Street. Map © Google.
Why this score? — see what drove the C+ grade
The composite is a weighted blend of 9 inputs, each scored 0–100. Each bar is that input's sub-score; the figure is the points it added to the 100-point composite (weight × sub-score).
- Cash flow +22.8/30.0
- 1% rule +9.3/10.0
- ARV discount +7.5/15.0
- DSCR +7.3/10.0
- Schools +5.6/10.0
- Livability +4.1/5.0
- Condition / age +2.5/5.0
- Rent growth +2.1/5.0
- Appreciation +0.0/10.0
$195,000
🖨 Deal sheet (PDF) 📄 Offer letter ✓ Due diligence
Listing remarks
Unique opportunity to own 1/4 share of a 5 bedroom 2 bath, vacation home on 9 private acres near Lake Wenatchee: giving you one week of use per month. Oscar Fuentes was a master craftsman, artisan builder, and expert in stone masonry. He called this place La Chosa— The Shack. It is anything but. Built painstakingly from locally sourced materials: river rock, massive hand-milled beams, and lumber from trees felled on site. La Chosa is the kind of home that simply isn't built anymore. Every stone fireplace, every shower, every wall tells a story of craft and intention. The main floor opens into a combined kitchen and dining room alongside a living room anchored by a grand stone fireplac
Key facts
- Private acres
- River rock
- Master craftsman
Tags
Property features AI
Finance
- Other: Zoning: RR10 (county jurisdiction)
- Financial info: Listing terms: Cash
Exterior
- Parking: Attached garage with covered parking for 2 vehicles
- Utilities: Individual well (water); Septic tank (sewer); Electric and wood energy sources; Power provided by Chelan PUD; LocalTel internet
- Home design: Single family residence; Two-story house; Entry on main level; Built on lot; Very good condition; Faces unspecified direction
- Construction: Built circa 1990; Stone and wood construction; Metal roof; Poured concrete foundation
- Exterior features: Stone and wood exterior; Deck; Hot tub/spa; Sprinkler system; High-speed internet available; Wooded lot; Level topography; Dead-end street access; Dirt road access; Open space nearby; Secluded setting; Has view
Interior
- Kitchen: Dishwasher; Refrigerator; Stove/Range
- Bedrooms: 5 bedrooms (1 on main level, 4 on upper level; primary on second level)
- Flooring: Ceramic tile; Carpet
- Bathrooms: 1 full bathroom; 1 three-quarter bathroom; 2 showers; 1 bathtub
- Heating & cooling: Baseboard heating; No central cooling
- Interior features: Ceiling fan(s); Dining room; Fireplace; Walk-in closet(s)
- Laundry & utility: Washer; Dryer
Neighborhood map
What this means for you Summary
Snapshot
- This is a 4-bed/1.0-bath single-family listed at $195k.
Deal economics
- At list price, monthly cash flow is $340 ($4k/yr) — positive.
- The deal already cash-flows at list — no discount required.
- Meets the 1% rule at list price ($3k rent vs $195k).
- Cap rate 8.4% vs local median 1.2% in Leavenworth — top-decile yield for the area; either an underpriced asset or a hidden risk that comps aren't pricing in. Stress-test before assuming the spread holds.
Location & tenants
- Location reads 82/100 on livability (#68 in WA, #1,224 nationally) — a professional / high-income tenant draw. Strengths: crime A+, amenities A+, health & safety A+; Watch: cost of living F.
- Cascade School District (town): math 59% / reading 69% proficiency, ranked #43 of 291 in WA (top 15%) — acceptable for families but not a draw, mixed tenant base, ~2y average lease.
- Zoned schools: Alpine Lakes Elementary (253 students, 44% FRL); Cascade High School (397 students, 44% FRL).
- Market conditions: Rents soft (-1.5%/yr); 255 active listings in the ZIP; solid renter incomes; 762 units permitted in Chelan County in 2024 (377 in 5+ unit buildings).
- This rent runs 38% of the median local income ($88k/yr) — at the standard rent-burdened threshold; future hikes will face affordability resistance.
Forward outlook
- Local home prices are declining (-3.0%/yr); year-one equity from $1k of loan paydown is wiped out by about $6k of value loss. Plan a longer hold.
- Chelan County population projected at +13% by 2050 — modest demand growth; plan on rents tracking national, not racing it.
Negotiation context
- Only 13 days on market — expect competitive offers; lowballing is unlikely to land.
Risks & watch-outs
- Watch-outs: property tax is 4.7% of price.
- Climate carrying-cost: severe wildfire risk — expect insurance premiums to compound above CPI over the hold.
Questions for the listing agent
- Property tax is high relative to price — has the assessment been appealed recently, and will the sale trigger a re-assessment?
- Is there a deadline driving the sale (1031 exchange, divorce, estate, relocation)? That informs how much negotiation room exists.
- Schools are A-rated — typically a magnet for longer-tenancy family renters. What's the average tenant stay here, and is there a school-zone premium baked into asking?
- What's the average days-on-market for RENTAL listings here right now (not sales)? A rising rental-DOM trend means longer vacancies and softer asking-rent achievability than the comps imply.
- What's the recent tenant-quality profile in this submarket — average credit score on applications, eviction rate, late-payment / NSF rate, and stable-employment percentage? A property-management company in the area should have these aggregated.
- How much new for-sale + rental construction is in the pipeline within 1–3 miles? Heavy new supply typically softens prices + rents 12–24 months out; constrained supply supports both.
Investment metrics
- 1% rule
- 1.43% ✓
- Cap rate
- 8.38%
- Cash-on-cash
- 7.46%
- DSCR
- 1.33
- GRM
- 5.8
CMA / ARV
- ARV (on-the-fly)
- $1,701,000
- Comps found
- 2
Show comp detail 2 sales within ~0.75 mi
| Address | Dist | Beds/Ba | Sqft | Sold | Price | $/sf | Match |
|---|---|---|---|---|---|---|---|
| 16216 N Shore Dr | 0.20mi | 5/3.5 (+1) | 2,636 (-12%) | 10mo | $1,055,000 | $400 | 47 |
| 22910 Lake Wenatchee Hwy | 0.48mi | 3/3.0 (-1) | 3,103 (+3%) | 16mo | $1,760,000 | $567 | 45 |
Match score weights: distance 35% · size 25% · config 20% · recency 20%. Top-matched comps best support the ARV.
Projected returns pro-forma
-3.0% appreciation · 0.0% rent growth · sell at horizon
- IRR
- -9.2%
- Equity multiple
- 0.67×
- Total profit
- $-17,781
- Equity at exit
- $29,075
- IRR
- -6.1%
- Equity multiple
- 0.67×
- Total profit
- $-17,750
- Equity at exit
- $16,860
Cash invested: $54,600 (down + closing). Projections, not guarantees.
Landlord ↔ Tenant lean methodology
- Overall (STATE)
- 28 Tenant-Leaning
- State Washington
- 28 Tenant-Leaning · D+8
- County
- — inherits STATE
- City
- — inherits STATE
ZIP-level market 98826
- Rents YoY
- -1.5%
- Active inventory
- 255
- Price-to-rent
- 5.8×
Monthly cashflow live
- Estimated rent
- $2,788 medium interval (Pro) →
- Mortgage (P&I)
- −$1,023
- Tax from tax record
- −$759 /mo · $9,106/yr
- Insurance
- −$81
- HOA
- −$0
- Vacancy / Maint / Mgmt
- −$585
- Net cashflow
- $340
Break-even live
Sensitivity live
| Price | -10% $989 | -5% $395 | +0% $340 | +5% $284 | +10% $229 |
|---|---|---|---|---|---|
| Rent | -10% $119 | -5% $229 | +0% $340 | +5% $450 | +10% $560 |
| Rate | -1.0pp $438 | -0.5pp $389 | base $340 | +0.5pp $289 | +1.0pp $238 |
UW: 25.0% down · 7.5% · 30yr · 1.5% tax · 5.0% vac · 8.0% maint · 8.0% mgmt
Financing live
Cash to close
- Down payment
- $48,750
- Closing costs
- $5,850
- Reserves months
- —
- Total cash needed
- —
Loan-product check · same deal, 3 products live
Conventional
25% down · 7.5% · 30yr
- Down + closing
- —
- Monthly P&I
- —
- Monthly cashflow
- —
- DSCR
- —
- Eligible?
- —
Personal DTI + credit; lowest rate.
DSCR
20% down · 8.5% · 30yr
- Down + closing
- —
- Monthly P&I
- —
- Monthly cashflow
- —
- DSCR
- —
- Eligible?
- —
No personal income docs; deal must DSCR.
Hard money
10% down · 12.0% · 12mo
- Down + closing
- —
- Monthly P&I
- —
- Monthly cashflow
- —
- DSCR
- —
- Eligible?
- —
Short-term bridge; refi at stabilization.
Listing history 8 events
-
2026-06-08status $195,000 Pending 13 DOM
-
2026-06-07days on market $195,000 Active 13 DOM
-
2026-06-05days on market $195,000 Active 10 DOM
-
2026-06-02days on market $195,000 Active 8 DOM
-
2026-06-01days on market $195,000 Active 7 DOM
-
2026-05-31days on market $195,000 Active 6 DOM
-
2026-05-30days on market $195,000 Active 5 DOM
-
2026-05-25$195,000 Active
ⓘ Source: listings_history table (triggers on properties + properties_extension) + one-shot
backfill from property_details.listing_events for pre-trigger history.
Tax reassessment forecast WA · Resets to sale price
- Current annual tax
- $9,106 · $759/mo
- Projected year-2 tax
- $9,106 · $759/mo
- Expected delta
- $0/yr ($0/mo · 0.0%)
ⓘ Screening estimate from a state-policy table — verify with the county assessor before closing.
Climate risk First Street
- Flood 1/10 Low FEMA zone X · 0% chance over 30 yrs
- Wildfire 9/10 Extreme
- Heat 2/10 Low 8 d/yr ≥91°F today · 17 d/yr by 30 yrs out
- Wind 1/10 Low
- Air quality 9/10 Extreme 17 unhealthy d/yr today · 22 by 30 yrs out
Nearby sold comps map
Loading sold comps map…
Walkable amenities ~0.75 mi
Loading nearby amenities…
Taxation est. · year 1
- Rental income
- $33,453
- − Mortgage interest
- −$10,923
- − Property taxes
- −$9,106
- − Insurance
- −$975
- − Repairs & maintenance
- −$2,676
- − Management
- −$2,676
- − Depreciation
- −$5,673
- Taxable income
- $1,423
- Est. tax owed @ 24.0%
- −$342
- After-tax cash flow
- $3,733/yr
For passive investors: Depreciation is non-cash, so a rental often shows a tax loss while cash-flowing — sheltering income. Rental losses are passive: they offset passive income freely, and up to $25,000/yr can offset ordinary (W-2) income if you actively participate and your MAGI is under $100k (phasing out to $0 by $150k); unused losses carry forward. On sale, claimed depreciation is recaptured at up to 25%, and gains may owe capital-gains tax (a 1031 exchange can defer both). Figures are a year-1 estimate at your 24.0% rate — not tax advice; consult a CPA.
Schools (NCES district)
- District
- Cascade School District
- NCES district ID
- 5300950
- Math proficiency
- 59% ▲ 5.00%
- Reading proficiency
- 69% ▲ 2.00%
- Median HH income
- $48,636
- Composite
- 55.69/100
- National rank
- #2630
- State rank
- #43 of 291 in WA
Livability — Leavenworth
- Score
- 82/100
- State rank
- #68
- US rank
- #1224
Category grades
Schools grade is shown separately in the Schools card above.
Census & demographics
- County
- Chelan County · 53,031 people
- City population
- 7,605
- Metro
- Wenatchee, WA
- Population (ZIP)
- 7,605
- Household income
- $87,646
- Rent vs Own
- Severe rent burden
- 201.0
Population outlook (Chelan County) Hauer SSP2
- Today (2025)
- 81,630 people
- By 2030
- 84,312 · +3.3%
- By 2040
- 88,619 · +8.6%
- By 2050
- 91,915 · +12.6%
- By 2075
- 99,409 · +21.8%
- By 2100
- 100,032 · +22.5%
Race, ethnicity, and origin ACS 2023
- Neighborhood character
- Predominantly White (85%)
- Race & ethnicity
- White 85% Hispanic / Latino 9% Two or more races 8% Asian 2%
- Hispanic origin (detail)
- Mexican 8%
- Common ancestry
- Portuguese 4% Italian 4% Iranian 3%
- Foreign-born
- 9% · Canada, Vietnam
- Languages at home
- 88% English-only · Spanish 8% German/W. Germanic 2% Vietnamese 1%
Political lean MEDSL · Chelan
- 2024 margin
- Lean R (+9.5) · D 43.9% · R 53.4% · Other 2.7%
- 2008→2024 swing
- +2.5pp toward D · 2008: -12.0pp · 2024: -9.5pp
- All cycles
- 2024: R+9.5 2020: R+7.8 2016: R+15.7 2012: R+16.9 2008: R+12.0
Not yet ingested
- Civics
- —
Market trends
- HPI YoY
- ▼ -321.35%
- Current HPI
- 235.1186
- Rent YoY
- ▼ -1.54%
- Metro
- Wenatchee, WA
- State GDP YoY
- ▲ 4.65%
- F500 in state
- 22
Industry mix (Fortune 500 HQ in WA)
| Industry | F500 HQs | Revenue |
|---|---|---|
| Retail | 2 | $269B |
|
||
| Technology / Retail | 1 | $638B |
|
||
| Technology | 1 | $245B |
|
||
| Telecommunications | 1 | $38B |
|
||
| Food / Beverage | 1 | $36B |
|
||
| Automotive / Trucks | 1 | $34B |
|
||
Price history
1 event — show timeline
- 2026-05-25 Listed $195,000 NWMLS as Distributed by MLS Grid
Property tax history
+4.3%/yrLatest (2026): $9,106 · -16.7% YoY. Source: county tax records.
Cash-flow waterfall
monthlySold comps — $/sqft
last 12 mo · ≤1 miLoading sold comps…