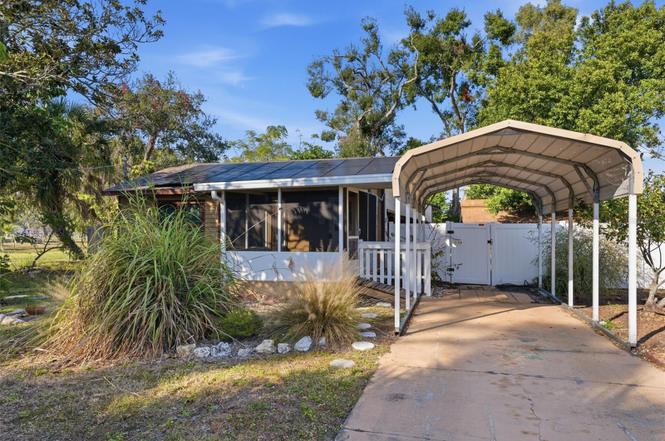
1212 8th St W · Palmetto, FL
Flood risk 5/10 · Moderate
- FEMA flood zone
- X (unshaded)
- Chance of flooding over 30 yrs
- 0.52%
- Est. flood insurance / yr
- $507 – $1,088
Fire risk 1/10 · Minimal
- Est. fire insurance / yr
- $947 – $1,759
Heat risk 10/10 · Severe
- Hot days now (above 107°F)
- 7 days/yr
- Hot days in 30 yrs
- 30 days/yr
Wind risk 10/10 · Severe
- Chance of severe wind over 30 yrs
- 99.0%
Air-quality risk 3/10 · Minor
- Unhealthy air days now
- 2 days/yr
- Unhealthy air days in 30 yrs
- 2 days/yr
Risk factors via First Street. Map © Google.
Why this score? — see what drove the C- grade
The composite is a weighted blend of 9 inputs, each scored 0–100. Each bar is that input's sub-score; the figure is the points it added to the 100-point composite (weight × sub-score).
- Cash flow +14.9/30.0
- ARV discount +14.4/15.0
- DSCR +4.5/10.0
- 1% rule +4.4/10.0
- Schools +4.4/10.0
- Livability +3.6/5.0
- Condition / age +2.5/5.0
- Rent growth +1.8/5.0
- Appreciation +0.0/10.0
$230,000
🖨 Deal sheet (PDF) 📄 Offer letter ✓ Due diligence
Listing remarks
Under contract-accepting backup offers. Come see this charming home in Palmetto Terrace that combines timeless appeal with modern conveniences. This home has 3 cozy bedrooms and 1.5 bathrooms, an updated kitchen with stainless steel appliances and eat-in kitchen. This home also has in-home laundry providing added convenience. This home also features a sunroom overlooking the backyard perfect to enjoy a book, coffee, or to retreat for a tranquil evening. The oversized yard includes a firepit and multiple sheds for storage and has great potential to transform into your own oasis. The home features SOLAR PANELS that will be paid off at closing!! This home is just a short distance to dining and
Key facts
- Multiple sheds
- Firepit
- Oversized yard
Tags
Neighborhood map
What this means for you Summary
Snapshot
- This is a 3-bed/1.5-bath single-family listed at $230k.
Deal economics
- At list price, monthly cash flow is $66 ($792/yr) — positive.
- The deal already cash-flows at list — no discount required.
- To meet the 1% rule (rent ≥ 1% of price), the offer needs to be $216k (6.3% below list).
- Recommended offer: $209k (9.0% below list) — sets the bar for market timing.
- Cap rate 6.6% vs local median 2.0% in Palmetto — top-decile yield for the area; either an underpriced asset or a hidden risk that comps aren't pricing in. Stress-test before assuming the spread holds.
Location & tenants
- Location reads 72/100 on livability (#346 in FL) — a middle-class / working-renter tenant base. Strengths: cost of living A+, housing A+, health & safety A+; Watch: crime F, amenities F, commute F.
- Manatee (suburban): math 54% / reading 50% proficiency, ranked #26 of 73 in FL (top 36%) — acceptable for families but not a draw, mixed tenant base, ~2y average lease.
- Zoned schools: Palmetto Elementary School (math 53% / reading 34%, grade F, #1,345 of 2,144 statewide, top 64%, 570 students, 78% FRL); Palmetto High School (math 22% / reading 36%, grade F, #456 of 667 statewide, top 68%, 2,100 students, 61% FRL) — zoned schools average 70% FRL vs 51% district-wide (19 pts higher); higher-poverty schools than district average — tighter screening recommended.
- Zoned-school proficiency averages 36% at this address vs 52% district-wide (-16 pts) — the specific schools serving this property underperform the Manatee average; the district grade overstates school quality for this exact location.
- Market conditions: Rents soft (-3.0%/yr); 1170 active listings in the ZIP; 26 comparable units currently listed for rent nearby; rentals at typical pace (median 26d on market — plan ~3-4 weeks tenant-placement turnaround); solid renter incomes; 7,472 units permitted in Manatee County in 2024 (1,782 in 5+ unit buildings).
- This rent runs 33% of the median local income ($78k/yr) — at the standard rent-burdened threshold; future hikes will face affordability resistance.
Forward outlook
- Local home prices are declining (-3.0%/yr); year-one equity from $2k of loan paydown is wiped out by about $7k of value loss. Plan a longer hold.
- Manatee County population projected at +43% by 2050 — long-run rental-demand tailwind backs the buy-and-hold thesis.
Negotiation context
- It's been on market 104 days — a 9% lower offer ($209k) is reasonable based on typical stale-listing flexibility.
- 11 sale attempts since 6y ago; this cycle's ask has dropped $30k (12%) from the opening price — seller is motivated, your offer sets the floor, not the list.
Risks & watch-outs
- Watch-outs: built in 1950 — expect roof / HVAC / electrical / plumbing capex.
- Climate carrying-cost: moderate flood risk; severe wind risk, 99% chance of damaging wind over 30y; extreme-heat days projected 7→30/yr by 2055 (HVAC capex compounding) — expect insurance premiums to compound above CPI over the hold.
Questions for the listing agent
- It's been on market 104 days. Have you received any prior offers? Is the seller open to a 9% concession, seller financing, or rate buy-down credit?
- Built in 1950 — when were the roof, HVAC, electrical panel, plumbing, and water heater last replaced?
- Why hasn't it sold? Are there any deal-killer items the seller is aware of (foundation, flood, title, zoning, code violations)?
- Is there a deadline driving the sale (1031 exchange, divorce, estate, relocation)? That informs how much negotiation room exists.
- Crime grade is F in this area — have there been break-ins, vandalism, or insurance claims at this property in the last 3 years? What carrier currently insures it and at what premium?
- What's the average days-on-market for RENTAL listings here right now (not sales)? A rising rental-DOM trend means longer vacancies and softer asking-rent achievability than the comps imply.
- What's the recent tenant-quality profile in this submarket — average credit score on applications, eviction rate, late-payment / NSF rate, and stable-employment percentage? A property-management company in the area should have these aggregated.
- How much new for-sale + rental construction is in the pipeline within 1–3 miles? Heavy new supply typically softens prices + rents 12–24 months out; constrained supply supports both.
Investment metrics
- 1% rule
- 0.94% ✗
- Cap rate
- 6.64%
- Cash-on-cash
- 1.23%
- DSCR
- 1.05
- GRM
- 8.9
CMA / ARV
- ARV (on-the-fly)
- $271,431
- Comps found
- 12
Show comp detail 12 sales within ~0.75 mi
| Address | Dist | Beds/Ba | Sqft | Sold | Price | $/sf | Match |
|---|---|---|---|---|---|---|---|
| 1212 8th St W | 0.00mi | 3/1.5 | 1,117 (0%) | 0mo | $225,000 | $201 | 100 |
| 1206 8th St W | 0.03mi | 3/2.0 | 1,188 (+6%) | 7mo | $257,500 | $217 | 80 |
| 705 14th Ave W | 0.15mi | 2/1.0 (-1) | 1,173 (+5%) | 1mo | $285,000 | $243 | 76 |
| 609 15th Ave W | 0.25mi | 2/1.0 (-1) | 1,056 (-6%) | 2mo | $325,000 | $308 | 71 |
| 1201 6th St W | 0.20mi | 2/2.0 (-1) | 1,257 (+12%) | 1mo | $280,000 | $223 | 62 |
| 508 18th Ave W | 0.47mi | 3/1.0 | 1,213 (+9%) | 4mo | $335,000 | $276 | 58 |
| 1814 7th St W | 0.50mi | 2/1.0 (-1) | 1,070 (-4%) | 6mo | $275,000 | $257 | 57 |
| 808 4th Ave W | 0.74mi | 3/1.0 | 1,080 (-3%) | 2mo | $227,000 | $210 | 56 |
| 1215 20th Ave W | 0.73mi | 3/2.0 | 1,100 (-2%) | 7mo | $299,000 | $272 | 55 |
| 2002 10th St W | 0.64mi | 2/1.0 (-1) | 1,056 (-6%) | 8mo | $258,000 | $244 | 47 |
| 707 13th St W | 0.61mi | 3/1.0 | 984 (-12%) | 9mo | $200,000 | $203 | 42 |
| 417 20th Ave W | 0.69mi | 2/1.0 (-1) | 1,245 (+12%) | 10mo | $297,000 | $239 | 33 |
Match score weights: distance 35% · size 25% · config 20% · recency 20%. Top-matched comps best support the ARV.
Projected returns pro-forma
-3.0% appreciation · 0.0% rent growth · sell at horizon
- IRR
- -17.8%
- Equity multiple
- 0.39×
- Total profit
- $-39,321
- Equity at exit
- $34,294
- IRR
- -17.4%
- Equity multiple
- 0.18×
- Total profit
- $-52,988
- Equity at exit
- $19,886
Cash invested: $64,400 (down + closing). Projections, not guarantees.
Landlord ↔ Tenant lean methodology
- Overall (STATE)
- 87 Strongly Landlord-Friendly
- State Florida
- 87 Strongly Landlord-Friendly · R+3
- County
- — inherits STATE
- City
- — inherits STATE
ZIP-level market 34221
- Rents YoY
- -3.0%
- Active inventory
- 1170
- Price-to-rent
- 8.9×
Monthly cashflow live
- Estimated rent
- $2,155 high interval (Pro) →
- Mortgage (P&I)
- −$1,206
- Tax from tax record
- −$335 /mo · $4,017/yr
- Insurance
- −$96
- HOA
- −$0
- Vacancy / Maint / Mgmt
- −$453
- Net cashflow
- $66
Break-even live
Sensitivity live
| Price | -10% $196 | -5% $131 | +0% $66 | +5% $1 | +10% $-64 |
|---|---|---|---|---|---|
| Rent | -10% $-104 | -5% $-19 | +0% $66 | +5% $151 | +10% $236 |
| Rate | -1.0pp $182 | -0.5pp $125 | base $66 | +0.5pp $6 | +1.0pp $-54 |
UW: 25.0% down · 7.5% · 30yr · 1.5% tax · 5.0% vac · 8.0% maint · 8.0% mgmt
Financing live
Cash to close
- Down payment
- $57,500
- Closing costs
- $6,900
- Reserves months
- —
- Total cash needed
- —
Loan-product check · same deal, 3 products live
Conventional
25% down · 7.5% · 30yr
- Down + closing
- —
- Monthly P&I
- —
- Monthly cashflow
- —
- DSCR
- —
- Eligible?
- —
Personal DTI + credit; lowest rate.
DSCR
20% down · 8.5% · 30yr
- Down + closing
- —
- Monthly P&I
- —
- Monthly cashflow
- —
- DSCR
- —
- Eligible?
- —
No personal income docs; deal must DSCR.
Hard money
10% down · 12.0% · 12mo
- Down + closing
- —
- Monthly P&I
- —
- Monthly cashflow
- —
- DSCR
- —
- Eligible?
- —
Short-term bridge; refi at stabilization.
Rent comps 26 comps
| Address | Beds | Baths | Sqft | Rent | $/sqft | DOM | Units | Dist |
|---|---|---|---|---|---|---|---|---|
| 515 15th Ave W Palmetto, FL | 3.0 | 1.0 | 1250 | $1,699 | $1.36 | 3d | 1 | 0.30mi |
| 507 10th Ave W Palmetto, FL | 2.0 | 1.0 | 737 | $1,495 | $2.03 | 18d | 1 | 0.31mi |
| 626 9th Ave W Palmetto, FL | 3.0 | 2.0 | 1200 | $2,200 | $1.83 | 25d | 1 | 0.33mi |
| 1229 11th Ave W Palmetto, FL | 3.0 | 1.0 | 1072 | $1,800 | $1.68 | 3d | 1 | 0.39mi |
| 1715 9th St W Palmetto, FL | 2.0 | 2.0 | 1104 | $2,000 | $1.81 | 25d | 1 | 0.45mi |
| 1000 Riverside Dr Unit B103 Palmetto, FL | 2.0 | 2.0 | 1435 | $1,895 | $1.32 | 25d | 1 | 0.46mi |
| 1213 15th St W Palmetto, FL | 2.0 | 1.0 | 1000 | $1,800 | $1.80 | 25d | 1 | 0.52mi |
| 1901 6th St W Palmetto, FL | 2.0 | 2.0 | 1360 | $2,200 | $1.62 | 5d | 1 | 0.60mi |
| 501 11th St W Palmetto, FL | 2.0 | 1.0 | 850 | $1,340 | $1.58 | 3d | 1 | 0.64mi |
| 1809 5th Ave W Palmetto, FL | 3.0 | 1.0 | 962 | $1,895 | $1.97 | 25d | 1 | 1.03mi |
| 2225 14th Ave W Unit 204 Palmetto, FL | 2.0 | 2.0 | 1120 | $1,795 | $1.60 | 25d | 1 | 1.08mi |
| 2225 14th Ave W Palmetto, FL | 2.0 | 2.0 | 1120 | $1,895 | $1.69 | 25d | 1 | 1.08mi |
| 105 Del Rio Dr Palmetto, FL | 2.0 | 1.0 | 872 | $1,600 | $1.83 | 18d | 1 | 1.17mi |
| 2320 Terra Ceia Bay Blvd #211 Palmetto, FL | 2.0 | 2.0 | 978 | $2,500 | $2.56 | 25d | 1 | 1.18mi |
| 1514 Fairway Oaks Dr Palmetto, FL | 3.0 | 2.0 | 1461 | $1,540 | $1.05 | 12d | 1 | 1.24mi |
| 1600 1st Ave W Unit 206A Bradenton, FL | 2.0 | 2.0 | 1221 | $2,000 | $1.64 | 16d | 1 | 1.33mi |
| 1910 3rd Ave E Palmetto, FL | 4.0 | 2.0 | 1214 | $2,600 | $2.14 | 25d | 1 | 1.34mi |
| 1650 1st Ave W Unit 507B Bradenton, FL | 2.0 | 2.0 | 1269 | $2,300 | $1.81 | 25d | 1 | 1.35mi |
| 1213 31st Ave W Palmetto, FL | 2.0 | 1.5 | 880 | $1,475 | $1.68 | 25d | 1 | 1.36mi |
| 2602 Edgewater Ct Palmetto, FL | 2.0 | 2.0 | 1253 | $4,000 | $3.19 | 25d | 1 | 1.40mi |
| 1400 1st Ave W #504 Bradenton, FL | 2.0 | 2.0 | 1280 | $2,295 | $1.79 | 25d | 1 | 1.41mi |
| 2625 Terra Ceia Bay Blvd #401 Palmetto, FL | 2.0 | 2.0 | 1349 | $3,495 | $2.59 | 25d | 1 | 1.42mi |
| 2625 Terra Ceia Bay Blvd #802 Palmetto, FL | 2.0 | 2.0 | 1148 | $2,395 | $2.09 | 25d | 1 | 1.42mi |
| 900 9th Ave E Unit 180 Palmetto, FL | 2.0 | 2.0 | 1000 | $1,650 | $1.65 | 18d | 1 | 1.46mi |
| 2725 Terra Ceia Bay Blvd #201 Palmetto, FL | 3.0 | 2.0 | 1486 | $2,200 | $1.48 | 4d | 1 | 1.50mi |
| 2725 Terra Ceia Bay Blvd #102 Palmetto, FL | 2.0 | 2.0 | 1256 | $2,200 | $1.75 | 18d | 1 | 1.50mi |
Listing history 39 events
-
2026-04-25status Pending
-
2026-04-02price $230,000
-
2026-03-04price $245,000
-
2026-02-07status Active
-
2026-02-07price $255,000
-
2026-02-04status Pending
-
2026-01-07$259,900 Active
-
2025-01-01historical $1,950
-
2024-12-23$1,950
-
2024-12-21historical
-
2024-11-15price $269,900
-
2024-11-11price $274,900
-
2024-10-27price $279,900
-
2024-10-03status Active
-
2024-10-03historical
-
2024-09-21$289,900 Active
-
2024-09-20historical
-
2024-09-18status Active
-
2024-07-26status Pending
-
2024-07-17price $289,900
-
2024-07-02price $293,900
-
2024-07-01status Active
-
2024-06-18status Pending
-
2024-05-19$294,900 Active
-
2021-06-03soldstatus $205,000
-
2021-06-02soldstatus $205,000 Closed
-
2021-04-27status Pending
-
2021-04-19$198,000 Active
-
2020-04-09historical
-
2020-04-03price $144,000
-
2020-03-30price $145,000
-
2020-03-30status Active
-
2020-03-25status Pending
-
2020-03-18price $148,000
-
2020-03-11$149,000 Active
-
2020-01-10soldstatus $70,000
-
2006-02-22soldstatus $145,000
-
1995-04-18soldstatus $40,000
-
1983-09-01soldstatus $23,500
ⓘ Source: listings_history table (triggers on properties + properties_extension) + one-shot
backfill from property_details.listing_events for pre-trigger history.
Tax reassessment forecast FL · Resets to sale price
- Current annual tax
- $4,017 · $335/mo
- Projected year-2 tax
- $4,017 · $335/mo
- Expected delta
- $0/yr ($0/mo · -0.0%)
ⓘ Screening estimate from a state-policy table — verify with the county assessor before closing.
Climate risk First Street
- Flood 5/10 Major FEMA zone X (unshaded) · 52% chance over 30 yrs
- Wildfire 1/10 Low
- Heat 10/10 Extreme 7 d/yr ≥107°F today · 30 d/yr by 30 yrs out
- Wind 10/10 Extreme 99% chance of damaging wind over 30 yrs
- Air quality 3/10 Moderate 2 unhealthy d/yr today · 2 by 30 yrs out
Nearby sold comps map
Loading sold comps map…
Walkable amenities ~0.75 mi
Loading nearby amenities…
Taxation est. · year 1
- Rental income
- $25,864
- − Mortgage interest
- −$12,884
- − Property taxes
- −$4,017
- − Insurance
- −$1,150
- − Repairs & maintenance
- −$2,069
- − Management
- −$2,069
- − Depreciation
- −$6,691
- Taxable loss
- −$3,015
- Est. tax savings @ 24.0%
- +$724
- After-tax cash flow
- $1,516/yr
For passive investors: Depreciation is non-cash, so a rental often shows a tax loss while cash-flowing — sheltering income. Rental losses are passive: they offset passive income freely, and up to $25,000/yr can offset ordinary (W-2) income if you actively participate and your MAGI is under $100k (phasing out to $0 by $150k); unused losses carry forward. On sale, claimed depreciation is recaptured at up to 25%, and gains may owe capital-gains tax (a 1031 exchange can defer both). Figures are a year-1 estimate at your 24.0% rate — not tax advice; consult a CPA.
Schools (NCES district)
- District
- Manatee
- NCES district ID
- 1201230
- Math proficiency
- 54% ▼ -6.00%
- Reading proficiency
- 50% ▼ -2.00%
- Median HH income
- $49,607
- Composite
- 44.43/100
- National rank
- #2806
- State rank
- #26 of 73 in FL
Livability — Palmetto
- Score
- 72/100
- State rank
- #346
- US rank
- #5695
Category grades
Schools grade is shown separately in the Schools card above.
Census & demographics
- Census place
- Palmetto, FL
- County
- Manatee County · 416,364 people
- City population
- 56,208
- Metro
- North Port-Sarasota-Bradenton, FL
- Population (ZIP)
- 56,208
- Household income
- $77,712
- Rent vs Own
- Severe rent burden
- 1193.0
Population outlook (Manatee County) Hauer SSP2
- Today (2025)
- 447,342 people
- By 2030
- 488,911 · +9.3%
- By 2040
- 567,934 · +27.0%
- By 2050
- 637,995 · +42.6%
- By 2075
- 781,970 · +74.8%
- By 2100
- 848,272 · +89.6%
Race, ethnicity, and origin ACS 2023
- Neighborhood character
- Diverse neighborhood (Simpson 0.58)
- Race & ethnicity
- White 59% Hispanic / Latino 22% Black 14% Two or more races 11%
- Hispanic origin (detail)
- Mexican 14% Puerto Rican 3%
- Common ancestry
- Romanian 2% Lithuanian 2% Italian 2%
- Foreign-born
- 10% · Canada, Dominican Republic, Jamaica
- Languages at home
- 81% English-only · Spanish 16% Other Indo-European 1%
Political lean MEDSL · Manatee
- 2024 margin
- Strong R (+23.5) · D 37.9% · R 61.4%
- 2008→2024 swing
- -16.5pp toward R · 2008: -7.0pp · 2024: -23.5pp
- All cycles
- 2024: R+23.5 2020: R+16.1 2016: R+17.1 2012: R+12.5 2008: R+7.0
Not yet ingested
- Civics
- —
Market trends
- HPI YoY
- ▼ -383.53%
- Current HPI
- 302.1458
- Rent YoY
- ▼ -2.98%
- Metro
- North Port-Sarasota-Bradenton, FL
- State GDP YoY
- ▲ 3.28%
- F500 in state
- 36
Industry mix (Fortune 500 HQ in FL)
| Industry | F500 HQs | Revenue |
|---|---|---|
| Industrial Technology | 2 | $29B |
|
||
| Insurance | 2 | $17B |
|
||
| Retail | 1 | $60B |
|
||
| Technology Distribution | 1 | $58B |
|
||
| Homebuilding | 1 | $35B |
|
||
| Technology Manufacturing | 1 | $35B |
|
||
Price history
+878.7% since first listed39 events — show timeline
- 2026-04-25 Pending — Stellar MLS as Distributed by MLS Grid
- 2026-04-02 Price Changed $230,000 Stellar MLS as Distributed by MLS Grid
- 2026-03-04 Price Changed $245,000 Stellar MLS as Distributed by MLS Grid
- 2026-02-07 Relisted — Stellar MLS as Distributed by MLS Grid
- 2026-02-07 Price Changed $255,000 Stellar MLS as Distributed by MLS Grid
- 2026-02-04 Pending — Stellar MLS as Distributed by MLS Grid
- 2026-01-07 Listed $259,900 Stellar MLS as Distributed by MLS Grid
- 2025-01-01 Rental Removed $1,950 STELLARMLS
- 2024-12-23 Listed for Rent $1,950 STELLARMLS
- 2024-12-21 Listing Removed — Stellar MLS as Distributed by MLS Grid
- 2024-11-15 Price Changed $269,900 Stellar MLS as Distributed by MLS Grid
- 2024-11-11 Price Changed $274,900 Stellar MLS as Distributed by MLS Grid
- 2024-10-27 Price Changed $279,900 Stellar MLS as Distributed by MLS Grid
- 2024-10-03 Relisted — Stellar MLS as Distributed by MLS Grid
- 2024-10-03 Listing Removed — Stellar MLS as Distributed by MLS Grid
- 2024-09-21 Listed $289,900 Stellar MLS as Distributed by MLS Grid
- 2024-09-20 Listing Removed — Stellar MLS as Distributed by MLS Grid
- 2024-09-18 Relisted — Stellar MLS as Distributed by MLS Grid
- 2024-07-26 Pending — Stellar MLS as Distributed by MLS Grid
- 2024-07-17 Price Changed $289,900 Stellar MLS as Distributed by MLS Grid
- 2024-07-02 Price Changed $293,900 Stellar MLS as Distributed by MLS Grid
- 2024-07-01 Relisted — Stellar MLS as Distributed by MLS Grid
- 2024-06-18 Pending — Stellar MLS as Distributed by MLS Grid
- 2024-05-19 Listed $294,900 Stellar MLS as Distributed by MLS Grid
- 2021-06-03 Sold (Public Records) $205,000 Public Records
- 2021-06-02 Sold (MLS) $205,000 Stellar MLS as Distributed by MLS Grid
- 2021-04-27 Pending — Stellar MLS as Distributed by MLS Grid
- 2021-04-19 Listed $198,000 Stellar MLS as Distributed by MLS Grid
- 2020-04-09 Listing Removed — Stellar MLS as Distributed by MLS Grid
- 2020-04-03 Price Changed $144,000 Stellar MLS as Distributed by MLS Grid
- 2020-03-30 Price Changed $145,000 Stellar MLS as Distributed by MLS Grid
- 2020-03-30 Relisted — Stellar MLS as Distributed by MLS Grid
- 2020-03-25 Pending — Stellar MLS as Distributed by MLS Grid
- 2020-03-18 Price Changed $148,000 Stellar MLS as Distributed by MLS Grid
- 2020-03-11 Listed $149,000 Stellar MLS as Distributed by MLS Grid
- 2020-01-10 Sold (Public Records) $70,000 Public Records
- 2006-02-22 Sold (Public Records) $145,000 Public Records
- 1995-04-18 Sold (Public Records) $40,000 Public Records
- 1983-09-01 Sold (Public Records) $23,500 Public Records
Property tax history
+16.8%/yrLatest (2025): $4,017 · -0.3% YoY. Source: county tax records.
Cash-flow waterfall
monthlySold comps — $/sqft
last 12 mo · ≤1 miLoading sold comps…