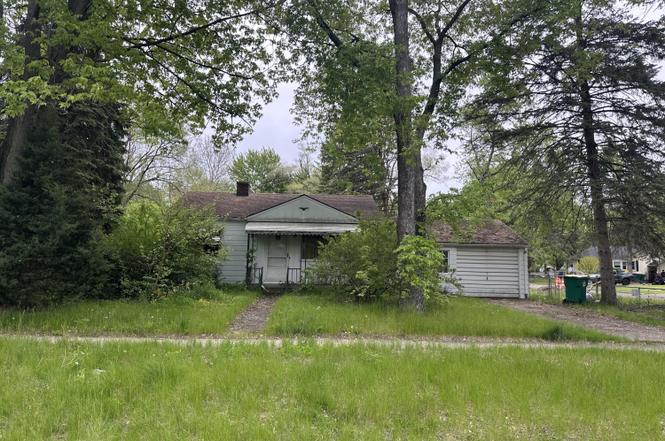
506 Hollis Ave · Ypsilanti, MI
Flood risk 1/10 · Minimal
- FEMA flood zone
- X (unshaded)
- Chance of flooding over 30 yrs
- 0.0%
- Est. flood insurance / yr
- $473 – $860
Fire risk 1/10 · Minimal
- Est. fire insurance / yr
- $784 – $1,456
Heat risk 3/10 · Minor
- Hot days now (above 98°F)
- 7 days/yr
- Hot days in 30 yrs
- 15 days/yr
Wind risk 2/10 · Minimal
- Chance of severe wind over 30 yrs
- —
Air-quality risk 2/10 · Minimal
- Unhealthy air days now
- 1 days/yr
- Unhealthy air days in 30 yrs
- 2 days/yr
Risk factors via First Street. Map © Google.
Why this score? — see what drove the B grade
The composite is a weighted blend of 9 inputs, each scored 0–100. Each bar is that input's sub-score; the figure is the points it added to the 100-point composite (weight × sub-score).
- Cash flow +27.4/30.0
- ARV discount +15.0/15.0
- DSCR +9.6/10.0
- 1% rule +7.6/10.0
- Livability +4.0/5.0
- Rent growth +3.6/5.0
- Condition / age +2.5/5.0
- Schools +1.3/10.0
- Appreciation +0.0/10.0
$100,000
🖨 Deal sheet 📄 Offer letter ✓ Due diligence
Listing remarks MLS
Investor opportunity for a cash only sale, home being sold in as-is condition and requires waiver to show due to condition. 2 bedroom ranch home with main floor full bath located on fenced corner lot just a few blocks from Prospect Park and Depot Town. Full basement with laundry and half bath. Garage is attached with breezeway entry. BTVAI.
Key facts
- Breezeway entry
- Attached garage
- Full basement
Tags
Property features AI
Exterior
- Parking: Attached garage (1 car)
- Utilities: Public water
- Home design: Ranch-style single-family home; Single story; Built in 1946
- Construction: Aluminum siding construction
- Exterior features: Aluminum siding; 0.14-acre lot; Public water
Interior
- Bathrooms: One full bathroom; One half bathroom
- Heating & cooling: Baseboard heating
- Interior features: Five total rooms; Full basement
Neighborhood map
What this means for you Summary
Snapshot
- This is a 2-bed/1.5-bath single-family listed at $100k.
Deal economics
- At list price, monthly cash flow is $292 ($4k/yr) — positive.
- The deal already cash-flows at list — no discount required.
- Meets the 1% rule at list price ($1k rent vs $100k).
- Cap rate 9.8% vs local median 4.0% in Ypsilanti — top-decile yield for the area; either an underpriced asset or a hidden risk that comps aren't pricing in. Stress-test before assuming the spread holds.
Location & tenants
- Location reads 81/100 on livability (#71 in MI, #1,539 nationally) — a professional / high-income tenant draw. Strengths: amenities A+, commute A+, cost of living A+; Watch: crime F, employment D-.
- Ypsilanti Community Schools (suburban): math 11% / reading 20% proficiency, ranked #501 of 540 in MI (top 93%) — low school quality limits family demand, transient renter base, plan for 1-2y turnover; 69% free/reduced lunch — lower-income household profile, screen leases tightly.
- Market conditions: Rents rising fast (+4.4%/yr); 166 active listings in the ZIP; 17 comparable units currently listed for rent nearby; rentals lingering (median 44d on market — plan ~5-8 weeks vacancy on turnover, expect pricing pressure); 53% of comp listings sitting > 30 days — soft ceiling on asking rent; 996 units permitted in Washtenaw County in 2024 (492 in 5+ unit buildings).
Forward outlook
- Local home prices are declining (-3.0%/yr); year-one equity from $691 of loan paydown is wiped out by about $3k of value loss. Plan a longer hold.
- Washtenaw County population projected at +25% by 2050 — long-run rental-demand tailwind backs the buy-and-hold thesis.
- At projected returns (-3.0% appreciation + 4.4% rent growth), your $28k cash investment doubles in ~8 years — after that, you're playing with house money.
Negotiation context
- Only 1 days on market — expect competitive offers; lowballing is unlikely to land.
- 3 sale attempts with the ask held roughly flat each time — persistent listings suggest the price (not the market) is what's stuck; bring a comps-based counter.
Risks & watch-outs
- Watch-outs: built in 1946 — expect roof / HVAC / electrical / plumbing capex.
Questions for the listing agent
- Built in 1946 — when were the roof, HVAC, electrical panel, plumbing, and water heater last replaced?
- Is there a deadline driving the sale (1031 exchange, divorce, estate, relocation)? That informs how much negotiation room exists.
- Crime grade is F in this area — have there been break-ins, vandalism, or insurance claims at this property in the last 3 years? What carrier currently insures it and at what premium?
- What's the average days-on-market for RENTAL listings here right now (not sales)? A rising rental-DOM trend means longer vacancies and softer asking-rent achievability than the comps imply.
- What's the recent tenant-quality profile in this submarket — average credit score on applications, eviction rate, late-payment / NSF rate, and stable-employment percentage? A property-management company in the area should have these aggregated.
- How much new for-sale + rental construction is in the pipeline within 1–3 miles? Heavy new supply typically softens prices + rents 12–24 months out; constrained supply supports both.
Investment metrics
- 1% rule
- 1.26% ✓
- Cap rate
- 9.79%
- Cash-on-cash
- 12.50%
- DSCR
- 1.56
- GRM
- 6.6
CMA / ARV
- ARV (on-the-fly)
- $142,400
- Comps found
- 12
Show comp detail 12 sales within ~0.75 mi
| Address | Dist | Beds/Ba | Sqft | Sold | Price | $/sf | Match |
|---|---|---|---|---|---|---|---|
| 580 Bagley Ave | 0.08mi | 2/1.0 | 696 (-2%) | 6mo | $157,000 | $226 | 86 |
| 318 Miles St | 0.52mi | 2/1.0 | 700 (-2%) | 2mo | $15,000 | $21 | 70 |
| 717 E Cross St | 0.33mi | 2/1.0 | 720 (+1%) | 23mo | $203,000 | $282 | 61 |
| 651 N Ivanhoe Ave | 0.28mi | 2/1.0 | 764 (+7%) | 16mo | $168,000 | $220 | 60 |
| 1099 Hawthorne Ave | 0.58mi | 2/1.0 | 725 (+2%) | 10mo | $163,177 | $225 | 60 |
| 1198 Hawthorne Ave | 0.64mi | 2/1.0 | 700 (-2%) | 11mo | $195,000 | $279 | 56 |
| 909 Maplewood Ave | 0.70mi | 2/1.0 | 727 (+2%) | 8mo | $76,519 | $105 | 56 |
| 167 N Ford Blvd | 0.58mi | 2/1.0 | 780 (+10%) | 3mo | $155,000 | $199 | 53 |
| 435 E Grand Blvd | 0.51mi | 3/1.0 (+1) | 780 (+10%) | 3mo | $145,000 | $186 | 51 |
| 739 Mildred St | 0.74mi | 2/1.0 | 700 (-2%) | 12mo | $140,000 | $200 | 51 |
| 157 Jerome Ave | 0.72mi | 2/1.0 | 720 (+1%) | 15mo | $143,500 | $199 | 50 |
| 25 Ypsi Ct | 0.45mi | 1/1.0 (-1) | 667 (-6%) | 14mo | $10,000 | $15 | 50 |
Match score weights: distance 35% · size 25% · config 20% · recency 20%. Top-matched comps best support the ARV.
Projected returns pro-forma
-3.0% appreciation · 4.38% rent growth · sell at horizon
- IRR
- 3.8%
- Equity multiple
- 1.15×
- Total profit
- $4,178
- Equity at exit
- $14,910
- IRR
- 14.6%
- Equity multiple
- 2.26×
- Total profit
- $35,162
- Equity at exit
- $8,646
Cash invested: $28,000 (down + closing). Projections, not guarantees.
Landlord ↔ Tenant lean methodology
- Overall (STATE)
- 62 Landlord-Friendly
- State Michigan
- 62 Landlord-Friendly · EVEN
- County
- — inherits STATE
- City
- — inherits STATE
ZIP-level market 48198
- Rents YoY
- 4.4%
- Active inventory
- 166
- Price-to-rent
- 6.6×
Monthly cashflow live
- Estimated rent
- $1,260 high interval (Pro) →
- Mortgage (P&I)
- −$524
- Tax from tax record
- −$138 /mo · $1,654/yr
- Insurance
- −$42
- HOA
- −$0
- Vacancy / Maint / Mgmt
- −$265
- Net cashflow
- $292
Break-even live
UW: 25.0% down · 7.5% · 30yr · 1.5% tax · 5.0% vac · 8.0% maint · 8.0% mgmt
Financing live
Cash to close
- Down payment
- $25,000
- Closing costs
- $3,000
- Reserves months
- —
- Total cash needed
- —
Loan-product check · same deal, 3 products live
Conventional
25% down · 7.5% · 30yr
- Down + closing
- —
- Monthly P&I
- —
- Monthly cashflow
- —
- DSCR
- —
- Eligible?
- —
Personal DTI + credit; lowest rate.
DSCR
20% down · 8.5% · 30yr
- Down + closing
- —
- Monthly P&I
- —
- Monthly cashflow
- —
- DSCR
- —
- Eligible?
- —
No personal income docs; deal must DSCR.
Hard money
10% down · 12.0% · 12mo
- Down + closing
- —
- Monthly P&I
- —
- Monthly cashflow
- —
- DSCR
- —
- Eligible?
- —
Short-term bridge; refi at stabilization.
Rent comps 17 comps
| Address | Beds | Baths | Sqft | Rent | $/sqft | DOM | Units | Dist |
|---|---|---|---|---|---|---|---|---|
| 506 N Miami Ave Ypsilanti, MI | 1.0 | 1.0 | 600 | $966 | $1.61 | 43d | 1 | 0.41mi |
| 232 Miles St Ypsilanti, MI | 2.0 | 1.0 | 696 | $1,400 | $2.01 | 5d | 1 | 0.48mi |
| 208 N Prospect Rd Ypsilanti, MI | 2.0 | 1.0 | 750 | $1,200 | $1.60 | 43d | 1 | 0.57mi |
| 1176 Hawthorne Ave Ypsilanti, MI | 2.0 | 1.0 | 720 | $1,400 | $1.94 | 24d | 1 | 0.62mi |
| 211 Olive St Unit 2 Ypsilanti, MI | 1.0 | 1.0 | 500 | $1,045 | $2.09 | 43d | 1 | 1.21mi |
| 206 S Huron St Ypsilanti, MI | 2.0 | 1.0 | 650 | $1,240 | $1.91 | 43d | 1 | 1.25mi |
| 212 Ferris St Unit 2125 Ypsilanti, MI | 1.0 | 1.0 | 726 | $1,095 | $1.51 | 24d | 1 | 1.29mi |
| 422 N Hamilton St Unit 1 Ypsilanti, MI | 1.0 | 1.0 | 510 | $900 | $1.76 | 43d | 1 | 1.30mi |
| 434 N Hamilton St Unit 1 Ypsilanti, MI | 1.0 | 1.0 | 410 | $1,100 | $2.68 | 43d | 1 | 1.30mi |
| 119 N Hamilton St Unit 2 Ypsilanti, MI | 1.0 | 1.0 | 400 | $1,050 | $2.62 | 20d | 1 | 1.35mi |
| 421 Emmet St Ypsilanti, MI | 3.0 | 2.0 | 676 | $1,400 | $2.07 | 18d | 1 | 1.39mi |
| 417 Pearl St Ypsilanti, MI | 2.0 | 1.0 | 680 | $1,090 | $1.60 | 18d | 1 | 1.41mi |
| 505 Emmet St Ypsilanti, MI | 1.0 | 1.0 | 435 | $925 | $2.13 | 18d | 1 | 1.42mi |
| 115 Ballard St Unit 3 Ypsilanti, MI | 1.0 | 1.0 | 600 | $830 | $1.38 | 43d | 1 | 1.43mi |
| 1428 Village Ln Ypsilanti, MI | 1.0–2.0 | 1.0 | 860 | $1,550 | $1.80 | 43d | 1 | 1.44mi |
| 669 Woburn Dr Ypsilanti, MI | 1.0–3.0 | 1.0–2.0 | 911 | $1,375 | $1.51 | 43d | 1 | 1.47mi |
| 513 Pearl St Ypsilanti, MI | 1.0 | 1.0 | 367 | $985 | $2.68 | 16d | 1 | 1.49mi |
Listing history 2 events
-
2026-06-19remarks 342-char remark
-
2026-06-19$100,000 Active 1 DOM
ⓘ Source: listings_history table (triggers on properties + properties_extension) + one-shot
backfill from property_details.listing_events for pre-trigger history.
Tax reassessment forecast MI · Partial reset (capped growth)
- Current annual tax
- $1,654 · $138/mo
- Projected year-2 tax
- $1,654 · $138/mo
- Expected delta
- $0/yr ($0/mo · 0.0%)
ⓘ Screening estimate from a state-policy table — verify with the county assessor before closing.
Climate risk First Street
- Flood 1/10 Low FEMA zone X (unshaded) · 0% chance over 30 yrs
- Wildfire 1/10 Low
- Heat 3/10 Moderate 7 d/yr ≥98°F today · 15 d/yr by 30 yrs out
- Wind 2/10 Low
- Air quality 2/10 Low 1 unhealthy d/yr today · 2 by 30 yrs out
Nearby sold comps map
Loading sold comps map…
Walkable amenities ~0.75 mi
Loading nearby amenities…
Taxation est. · year 1
- Rental income
- $15,124
- − Mortgage interest
- −$5,602
- − Property taxes
- −$1,654
- − Insurance
- −$500
- − Repairs & maintenance
- −$1,210
- − Management
- −$1,210
- − Depreciation
- −$2,909
- Taxable income
- $2,039
- Est. tax owed @ 24.0%
- −$489
- After-tax cash flow
- $3,012/yr
For passive investors: Depreciation is non-cash, so a rental often shows a tax loss while cash-flowing — sheltering income. Rental losses are passive: they offset passive income freely, and up to $25,000/yr can offset ordinary (W-2) income if you actively participate and your MAGI is under $100k (phasing out to $0 by $150k); unused losses carry forward. On sale, claimed depreciation is recaptured at up to 25%, and gains may owe capital-gains tax (a 1031 exchange can defer both). Figures are a year-1 estimate at your 24.0% rate — not tax advice; consult a CPA.
Schools (NCES district)
- District
- Ypsilanti Community Schools
- NCES district ID
- 2636630
- Math proficiency
- 11% ▼ -8.00%
- Reading proficiency
- 20% ▼ -3.00%
- Median HH income
- $37,759
- Composite
- 12.98/100
- National rank
- #9572
- State rank
- #501 of 540 in MI
Livability — Ypsilanti
- Score
- 81/100
- State rank
- #71
- US rank
- #1539
Category grades
Schools grade is shown separately in the Schools card above.
Census & demographics
- County
- Washtenaw County · 306,860 people
- City population
- 105,769
- Metro
- Ann Arbor, MI
- Population (ZIP)
- 39,244
- Household income
- $63,326
- Rent vs Own
- Severe rent burden
- 1998.0
Population outlook (Washtenaw County) Hauer SSP2
- Today (2025)
- 402,878 people
- By 2030
- 424,104 · +5.3%
- By 2040
- 464,633 · +15.3%
- By 2050
- 504,728 · +25.3%
- By 2075
- 614,463 · +52.5%
- By 2100
- 676,181 · +67.8%
Race, ethnicity, and origin ACS 2023
- Neighborhood character
- Diverse neighborhood (Simpson 0.66)
- Race & ethnicity
- White 48% Black 32% Two or more races 11% Hispanic / Latino 8% Asian 2%
- Hispanic origin (detail)
- Mexican 4%
- Common ancestry
- Romanian 3% Italian 2% Slovak 2%
- Foreign-born
- 9% · Canada, China, South Korea
- Languages at home
- 88% English-only · Spanish 7% Other Indo-European 1% Arabic 1%
Political lean MEDSL · Washtenaw
- 2024 margin
- Solid D (+44.4) · D 71.0% · R 26.6% · Other 2.4%
- 2008→2024 swing
- +3.5pp toward D · 2008: 41.0pp · 2024: 44.4pp
- All cycles
- 2024: D+44.4 2020: D+46.6 2016: D+41.5 2012: D+36.0 2008: D+41.0
Not yet ingested
- Civics
- —
Market trends
- HPI YoY
- ▼ -224.96%
- Current HPI
- 204.1228
- Rent YoY
- ▲ 4.38%
- Metro
- Ann Arbor, MI
- State GDP YoY
- ▲ 1.37%
- F500 in state
- 28
Industry mix (Fortune 500 HQ in MI)
| Industry | F500 HQs | Revenue |
|---|---|---|
| Automotive Parts | 3 | $48B |
|
||
| Automotive | 2 | $372B |
|
||
| Chemicals | 1 | $45B |
|
||
| Automotive Retail | 1 | $29B |
|
||
| Healthcare / Medical Devices | 1 | $23B |
|
||
| Automotive Technology | 1 | $20B |
|
||
Price history
+0.0% since first listed3 events — show timeline
- 2026-06-18 Listed $100,000 REALCOMP
- 2026-06-18 Listed $100,000 MiRealSource-MiMLS
- 2026-06-18 Listed $100,000 SW Michigan MLS
Property tax history
+1.6%/yrLatest (2016): $1,654 · +3.6% YoY. Source: county tax records.
Cash-flow waterfall
monthlySold comps — $/sqft
last 12 mo · ≤1 miLoading sold comps…