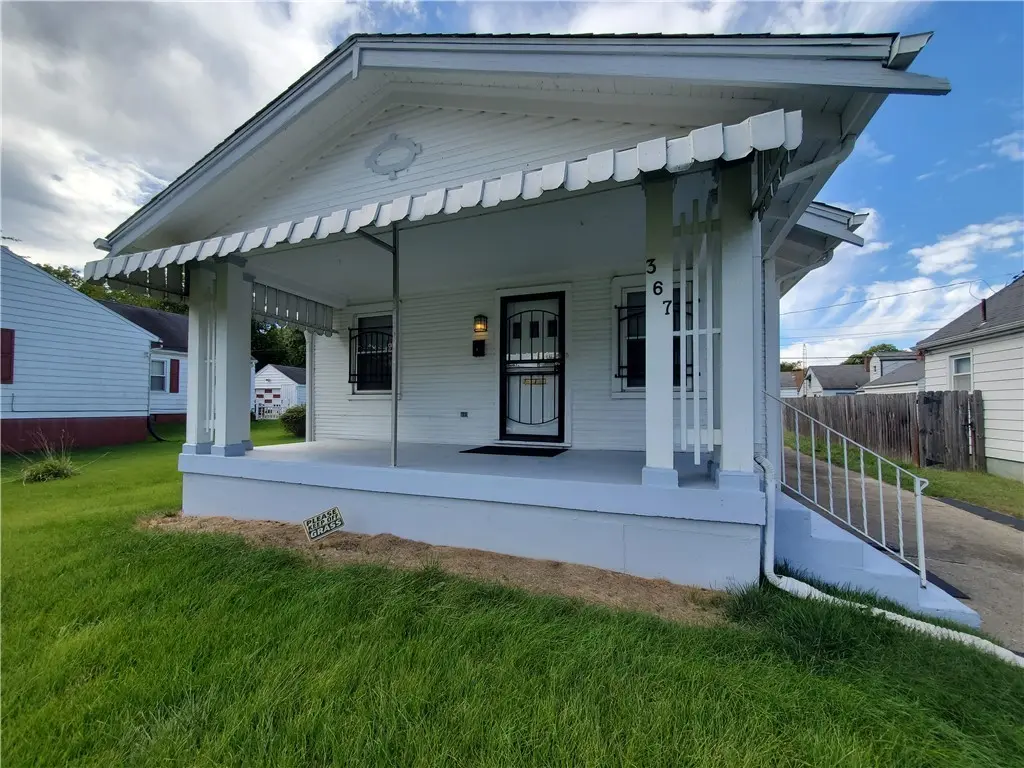
367 Geneva Rd · Dayton, OH
Flood risk No data
- FEMA flood zone
- —
- Chance of flooding over 30 yrs
- —
- Est. flood insurance / yr
- —
Fire risk No data
- Est. fire insurance / yr
- —
Heat risk No data
- Hot days now (above threshold)
- —
- Hot days in 30 yrs
- —
Wind risk No data
- Chance of severe wind over 30 yrs
- —
Air-quality risk No data
- Unhealthy air days now
- —
- Unhealthy air days in 30 yrs
- —
Risk factors via First Street. Map © Google.
Why this score? — see what drove the C grade
The composite is a weighted blend of 9 inputs, each scored 0–100. Each bar is that input's sub-score; the figure is the points it added to the 100-point composite (weight × sub-score).
- Cash flow +28.0/30.0
- DSCR +10.0/10.0
- 1% rule +6.8/10.0
- Rent growth +3.5/5.0
- Livability +3.2/5.0
- Condition / age +2.5/5.0
- ARV discount +1.7/15.0
- Schools +1.3/10.0
- Appreciation +0.0/10.0
$85,000
🖨 Deal sheet (PDF) 📄 Offer letter ✓ Due diligence
Listing remarks MLS
Great Investment Property! This home is back on the market due to a buyer's financing hiccup. Tenant Occupied long term Rental, please do not disturb. Tenant is in a Lease under priced at $850 per month. Outstanding opportunity for investors who are looking for a great house with solid income. This Property is Exceptionally Maintained that goes above typical rentals. Please allow 48hrs for access. You will not be disappointed! Many new updates in home and new driveway in 2021.
Key facts
- New driveway
- New updates
- 7,802 sq ft lot
Tags
Neighborhood map
What this means for you Summary
Snapshot
- This is a 2-bed/1.0-bath single-family listed at $85k.
Deal economics
- At list price, monthly cash flow is $266 ($3k/yr) — positive.
- The deal already cash-flows at list — no discount required.
- Meets the 1% rule at list price ($1k rent vs $85k).
- Recommended offer: $82k (3.0% below list) — sets the bar for market timing.
- Cap rate 10.0% vs local median 7.3% in Dayton — top-decile yield for the area; either an underpriced asset or a hidden risk that comps aren't pricing in. Stress-test before assuming the spread holds.
Location & tenants
- Location reads 65/100 on livability (#716 in OH) — a middle-class / working-renter tenant base. Strengths: cost of living A+, housing A+, health & safety A; Watch: amenities C-, crime F, commute F.
- Dayton City (urban): math 12% / reading 21% proficiency, ranked #641 of 656 in OH (top 98%) — low school quality limits family demand, transient renter base, plan for 1-2y turnover; 74% free/reduced lunch — lower-income household profile, screen leases tightly.
- Zoned schools: River'S Edge Montessori Elementary School (math 22% / reading 32%, grade F, #1,193 of 1,584 statewide, top 76%, 494 students, 0% FRL); Wogaman Middle School (math 8% / reading 12%, grade F, #645 of 654 statewide, top 99%, 364 students, 0% FRL); Belmont High School (math 5% / reading 20%, grade F, #720 of 781 statewide, top 93%, 1,100 students, 0% FRL) — zoned schools average 0% FRL vs 74% district-wide (74 pts lower); this property's tenant base skews higher-income than the district average.
- Market conditions: Rents rising fast (+4.1%/yr); 140 active listings in the ZIP; 24 comparable units currently listed for rent nearby; rentals leasing fast (median 5d on market — plan ~1-2 weeks tenant-placement turnaround); lower-income renter base — watch delinquency; 907 units permitted in Montgomery County in 2024 (416 in 5+ unit buildings).
- This rent runs 33% of the median local income ($37k/yr) — at the standard rent-burdened threshold; future hikes will face affordability resistance.
Forward outlook
- Local home prices are declining (-3.0%/yr); year-one equity from $588 of loan paydown is wiped out by about $3k of value loss. Plan a longer hold.
- Montgomery County population projected at -10% by 2050 — secular population decline; favor cash flow + early exit over multi-decade hold.
- At projected returns (-3.0% appreciation + 4.1% rent growth), your $24k cash investment doubles in ~8 years — after that, you're playing with house money.
Negotiation context
- It's been on market 52 days — a 3% lower offer ($82k) is reasonable based on typical stale-listing flexibility.
- 9 sale attempts since 13y ago with the ask held roughly flat each time — persistent listings suggest the price (not the market) is what's stuck; bring a comps-based counter.
- Current owner paid $67k; 27% above their basis — modest negotiation headroom, anchor on the comps not their cost.
Risks & watch-outs
- Watch-outs: built in 1924 — expect roof / HVAC / electrical / plumbing capex.
Questions for the listing agent
- It's been on market 52 days. Have you received any prior offers? Is the seller open to a 3% concession, seller financing, or rate buy-down credit?
- Built in 1924 — when were the roof, HVAC, electrical panel, plumbing, and water heater last replaced?
- Is there a deadline driving the sale (1031 exchange, divorce, estate, relocation)? That informs how much negotiation room exists.
- Crime grade is F in this area — have there been break-ins, vandalism, or insurance claims at this property in the last 3 years? What carrier currently insures it and at what premium?
- What's the average days-on-market for RENTAL listings here right now (not sales)? A rising rental-DOM trend means longer vacancies and softer asking-rent achievability than the comps imply.
- What's the recent tenant-quality profile in this submarket — average credit score on applications, eviction rate, late-payment / NSF rate, and stable-employment percentage? A property-management company in the area should have these aggregated.
- How much new for-sale + rental construction is in the pipeline within 1–3 miles? Heavy new supply typically softens prices + rents 12–24 months out; constrained supply supports both.
Investment metrics
- 1% rule
- 1.18% ✓
- Cap rate
- 10.04%
- Cash-on-cash
- 13.40%
- DSCR
- 1.60
- GRM
- 7.0
CMA / ARV
- ARV (median comp)
- $75,254
- List price
- $85,000
- Delta
- 12.95%
- Verdict
- OVERPRICED
- Comps
- 20 within 1.0 mi
Show comp detail 12 sales within ~0.75 mi
| Address | Dist | Beds/Ba | Sqft | Sold | Price | $/sf | Match |
|---|---|---|---|---|---|---|---|
| 361 Roxbury Rd | 0.12mi | 2/1.0 | 864 (-1%) | 7mo | $120,000 | $139 | 87 |
| 214 Geneva Rd | 0.18mi | 2/1.0 | 952 (+9%) | 0mo | $89,000 | $93 | 77 |
| 735 Geneva Rd | 0.26mi | 2/1.0 | 864 (-1%) | 11mo | $77,500 | $90 | 77 |
| 4519 Alfred Dr | 0.17mi | 2/1.0 | 960 (+10%) | 1mo | $81,000 | $84 | 76 |
| 720 Geneva Rd | 0.23mi | 2/1.5 | 848 (-3%) | 9mo | $149,600 | $176 | 74 |
| 752 Cleverly Rd | 0.28mi | 2/1.0 | 788 (-10%) | 2mo | $115,000 | $146 | 69 |
| 615 Circle Rd | 0.29mi | 3/1.0 (+1) | 936 (+7%) | 3mo | $66,000 | $71 | 67 |
| 420 Malden Ave | 0.36mi | 2/1.0 | 936 (+7%) | 8mo | $70,000 | $75 | 65 |
| 712 N Gettysburg Ave | 0.48mi | 3/1.0 (+1) | 896 (+2%) | 8mo | $104,900 | $117 | 62 |
| 731 Whitmore Ave | 0.46mi | 3/1.0 (+1) | 925 (+6%) | 8mo | $65,000 | $70 | 57 |
| 4126 Kammer Ave | 0.49mi | 2/1.0 | 984 (+12%) | 8mo | $143,000 | $145 | 50 |
| 38 N Hatfield St | 0.50mi | 2/1.0 | 768 (-12%) | 10mo | $60,000 | $78 | 48 |
Match score weights: distance 35% · size 25% · config 20% · recency 20%. Top-matched comps best support the ARV.
Projected returns pro-forma
-3.0% appreciation · 4.06% rent growth · sell at horizon
- IRR
- 4.5%
- Equity multiple
- 1.18×
- Total profit
- $4,218
- Equity at exit
- $12,674
- IRR
- 14.9%
- Equity multiple
- 2.26×
- Total profit
- $29,937
- Equity at exit
- $7,349
Cash invested: $23,800 (down + closing). Projections, not guarantees.
Landlord ↔ Tenant lean methodology
- Overall (STATE)
- 73 Landlord-Friendly
- State Ohio
- 73 Landlord-Friendly · R+6
- County
- — inherits STATE
- City
- — inherits STATE
ZIP-level market 45417
- Home prices YoY
- -32.3%
- Rents YoY
- 4.1%
- Active inventory
- 140
- Price-to-rent
- 7.0×
Monthly cashflow live
- Estimated rent
- $1,007 high interval (Pro) →
- Mortgage (P&I)
- −$446
- Tax from tax record
- −$49 /mo · $584/yr
- Insurance
- −$35
- HOA
- −$0
- Vacancy / Maint / Mgmt
- −$211
- Net cashflow
- $266
Break-even live
Sensitivity live
| Price | -10% $314 | -5% $290 | +0% $266 | +5% $242 | +10% $218 |
|---|---|---|---|---|---|
| Rent | -10% $186 | -5% $226 | +0% $266 | +5% $306 | +10% $345 |
| Rate | -1.0pp $309 | -0.5pp $287 | base $266 | +0.5pp $244 | +1.0pp $221 |
UW: 25.0% down · 7.5% · 30yr · 1.5% tax · 5.0% vac · 8.0% maint · 8.0% mgmt
Financing live
Cash to close
- Down payment
- $21,250
- Closing costs
- $2,550
- Reserves months
- —
- Total cash needed
- —
Loan-product check · same deal, 3 products live
Conventional
25% down · 7.5% · 30yr
- Down + closing
- —
- Monthly P&I
- —
- Monthly cashflow
- —
- DSCR
- —
- Eligible?
- —
Personal DTI + credit; lowest rate.
DSCR
20% down · 8.5% · 30yr
- Down + closing
- —
- Monthly P&I
- —
- Monthly cashflow
- —
- DSCR
- —
- Eligible?
- —
No personal income docs; deal must DSCR.
Hard money
10% down · 12.0% · 12mo
- Down + closing
- —
- Monthly P&I
- —
- Monthly cashflow
- —
- DSCR
- —
- Eligible?
- —
Short-term bridge; refi at stabilization.
Rent comps 24 comps
| Address | Beds | Baths | Sqft | Rent | $/sqft | DOM | Units | Dist |
|---|---|---|---|---|---|---|---|---|
| 729 Cleverly Rd Dayton, OH | 2.0 | 1.0 | 626 | $950 | $1.52 | 45d | 1 | 0.26mi |
| 4109 Midway Ave Dayton, OH | 3.0 | 1.0 | 971 | $1,000 | $1.03 | 4d | 1 | 0.29mi |
| 3627 Delphos Ave Dayton, OH | 1.0 | 1.0 | 525 | $625 | $1.19 | 15d | 1 | 0.71mi |
| 3925 Hoover Ave Dayton, OH | 2.0 | 1.0 | 936 | $1,100 | $1.18 | 4d | 1 | 0.79mi |
| 126 Bluecrest Ave Dayton, OH | 2.0 | 1.0 | 840 | $1,000 | $1.19 | 15d | 1 | 0.80mi |
| 342 Lookout Ave Dayton, OH | 2.0 | 1.0 | 800 | $750 | $0.94 | 4d | 1 | 0.80mi |
| 342 Lookout Ave Dayton, OH | 2.0 | 1.0 | 800 | $775 | $0.97 | 45d | 1 | 0.80mi |
| 4625 Gardendale Ave Dayton, OH | 3.0 | 1.0 | 864 | $1,150 | $1.33 | 4d | 1 | 0.97mi |
| 863 N Upland Ave Dayton, OH | 3.0 | 1.0 | 1042 | $1,200 | $1.15 | 45d | 1 | 1.02mi |
| 500 Bowie Dr Unit 122 Dayton, OH | 2.0 | 1.0 | 850 | $910 | $1.07 | 45d | 1 | 1.02mi |
| 137 Westwood Ave Dayton, OH | 2.0 | 1.0 | 784 | $900 | $1.15 | 4d | 1 | 1.04mi |
| 5336 Rockport Ave Dayton, OH | 3.0 | 1.0 | 925 | $1,025 | $1.11 | 45d | 1 | 1.14mi |
| 828 Walton Ave Unit 832 Walton Dayton, OH | 2.0 | 1.0 | 750 | $795 | $1.06 | 25d | 1 | 1.18mi |
| 1498 Elaine St Dayton, OH | 3.0 | 1.0 | 864 | $1,025 | $1.19 | 4d | 1 | 1.19mi |
| 4576 Live Oak Dr Dayton, OH | 3.0 | 1.0 | 864 | $1,400 | $1.62 | 45d | 1 | 1.22mi |
| 1427 Stuben Dr Dayton, OH | 3.0 | 1.0 | 957 | $900 | $0.94 | 4d | 1 | 1.22mi |
| 70 Gramont Ave Dayton, OH | 3.0 | 1.5 | 966 | $1,300 | $1.35 | 4d | 1 | 1.25mi |
| 1595 Elaine St Dayton, OH | 3.0 | 1.0 | 864 | $950 | $1.10 | 4d | 1 | 1.28mi |
| 920 Huron Ave Dayton, OH | 2.0 | 1.0 | 950 | $995 | $1.05 | 4d | 1 | 1.34mi |
| 1816 N James H McGee Blvd Apt B Dayton, OH | 3.0 | 1.0 | 950 | $1,150 | $1.21 | 45d | 1 | 1.40mi |
| 1816 N James H McGee Blvd Unit C Dayton, OH | 3.0 | 1.0 | 950 | $1,150 | $1.21 | 4d | 1 | 1.40mi |
| 1816 N James H McGee Blvd Apt A Dayton, OH | 3.0 | 1.0 | 950 | $1,200 | $1.26 | 4d | 1 | 1.40mi |
| 322 Lorenz Ave Dayton, OH | 1.0 | 1.0 | 634 | $850 | $1.34 | 45d | 1 | 1.46mi |
| 41 N Marion St Dayton, OH | 2.0 | 1.0 | 652 | $925 | $1.42 | 4d | 1 | 1.49mi |
Listing history 37 events
-
2026-06-18status $85,000 Pending 52 DOM
-
2026-06-17days on market $85,000 Active 52 DOM
-
2026-06-16days on market $85,000 Active 51 DOM
-
2026-06-15days on market $85,000 Active 50 DOM
-
2026-06-14days on market $85,000 Active 48 DOM
-
2026-06-13days on market $85,000 Active 47 DOM
-
2026-06-10days on market $85,000 Active 45 DOM
-
2026-06-09days on market $85,000 Active 44 DOM
-
2026-06-08days on market $85,000 Active 43 DOM
-
2026-06-07days on market $85,000 Active 42 DOM
-
2026-06-05days on market $85,000 Active 39 DOM
-
2026-06-03days on market $85,000 Active 38 DOM
-
2026-06-02days on market $85,000 Active 37 DOM
-
2026-06-01days on market $85,000 Active 36 DOM
-
2026-05-31days on market $85,000 Active 35 DOM
-
2026-04-27status Active 481-char remark
Show marketing remark (481 chars)
Great Investment Property! This home is back on the market due to a buyer's financing hiccup. Tenant Occupied long term Rental, please do not disturb. Tenant is in a Lease under priced at $850 per month. Outstanding opportunity for investors who are looking for a great house with solid income. This Property is Exceptionally Maintained that goes above typical rentals. Please allow 48hrs for access. You will not be disappointed! Many new updates in home and new driveway in 2021.
-
2026-03-21status Pending 481-char remark
Show marketing remark (481 chars)
Great Investment Property! This home is back on the market due to a buyer's financing hiccup. Tenant Occupied long term Rental, please do not disturb. Tenant is in a Lease under priced at $850 per month. Outstanding opportunity for investors who are looking for a great house with solid income. This Property is Exceptionally Maintained that goes above typical rentals. Please allow 48hrs for access. You will not be disappointed! Many new updates in home and new driveway in 2021.
-
2026-03-19$85,000 Active 481-char remark
Show marketing remark (481 chars)
Great Investment Property! This home is back on the market due to a buyer's financing hiccup. Tenant Occupied long term Rental, please do not disturb. Tenant is in a Lease under priced at $850 per month. Outstanding opportunity for investors who are looking for a great house with solid income. This Property is Exceptionally Maintained that goes above typical rentals. Please allow 48hrs for access. You will not be disappointed! Many new updates in home and new driveway in 2021.
-
2022-02-14soldstatus $67,000 Closed 304-char remark
Show marketing remark (304 chars)
First time buyers who are looking for a great house or if looking for investment property . Tenant is month to month at $700. Exceptionally Maintained home that goes above typical rentals. Please allow 24hrs access but you will not be disappointed ! Many new updates in home and new driveway in 2021.
-
2022-02-14soldstatus $67,000 Sold 304-char remark
Show marketing remark (304 chars)
First time buyers who are looking for a great house or if looking for investment property . Tenant is month to month at $700. Exceptionally Maintained home that goes above typical rentals. Please allow 24hrs access but you will not be disappointed ! Many new updates in home and new driveway in 2021.
-
2022-02-01status Pending 304-char remark
Show marketing remark (304 chars)
First time buyers who are looking for a great house or if looking for investment property . Tenant is month to month at $700. Exceptionally Maintained home that goes above typical rentals. Please allow 24hrs access but you will not be disappointed ! Many new updates in home and new driveway in 2021.
-
2021-11-05$69,500 Active 304-char remark
Show marketing remark (304 chars)
First time buyers who are looking for a great house or if looking for investment property . Tenant is month to month at $700. Exceptionally Maintained home that goes above typical rentals. Please allow 24hrs access but you will not be disappointed ! Many new updates in home and new driveway in 2021.
-
2021-09-15historical
-
2021-06-09price $70,000
-
2021-04-17historical
-
2021-04-15$67,000 Active
-
2021-04-10historical
-
2021-01-25$64,900 Active
-
2021-01-17$64,900 Active
-
2017-08-08historical
-
2017-05-24$38,500 Active
-
2013-05-15historical
-
2013-05-15historical
-
2013-02-27$45,000
-
2013-02-27$45,000
-
1979-02-23soldstatus $18,500
-
1979-02-23soldstatus $18,500
ⓘ Source: listings_history table (triggers on properties + properties_extension) + one-shot
backfill from property_details.listing_events for pre-trigger history.
Tax reassessment forecast OH · Partial reset (capped growth)
- Current annual tax
- $584 · $49/mo
- Projected year-2 tax
- $955 · $80/mo
- Expected delta
- +$371/yr (+$31/mo · 63.6%)
ⓘ Screening estimate from a state-policy table — verify with the county assessor before closing.
Nearby sold comps map
Loading sold comps map…
Walkable amenities ~0.75 mi
Loading nearby amenities…
Taxation est. · year 1
- Rental income
- $12,084
- − Mortgage interest
- −$4,761
- − Property taxes
- −$584
- − Insurance
- −$425
- − Repairs & maintenance
- −$967
- − Management
- −$967
- − Depreciation
- −$2,473
- Taxable income
- $1,908
- Est. tax owed @ 24.0%
- −$458
- After-tax cash flow
- $2,731/yr
For passive investors: Depreciation is non-cash, so a rental often shows a tax loss while cash-flowing — sheltering income. Rental losses are passive: they offset passive income freely, and up to $25,000/yr can offset ordinary (W-2) income if you actively participate and your MAGI is under $100k (phasing out to $0 by $150k); unused losses carry forward. On sale, claimed depreciation is recaptured at up to 25%, and gains may owe capital-gains tax (a 1031 exchange can defer both). Figures are a year-1 estimate at your 24.0% rate — not tax advice; consult a CPA.
Schools (NCES district)
- District
- Dayton City
- NCES district ID
- 3904384
- Math proficiency
- 12% ▼ -12.00%
- Reading proficiency
- 21% ▼ -11.00%
- Median HH income
- $28,688
- Composite
- 12.94/100
- National rank
- #9579
- State rank
- #641 of 656 in OH
Livability — Dayton
- Score
- 65/100
- State rank
- #716
- US rank
- #12895
Category grades
Schools grade is shown separately in the Schools card above.
Census & demographics
- Census place
- Dayton, OH
- County
- Montgomery County · 459,541 people
- City population
- 164,387
- Metro
- Dayton-Kettering, OH
- Population (ZIP)
- 28,186
- Household income
- $36,945
- Rent vs Own
- Severe rent burden
- 1822.0
Population outlook (Montgomery County) Hauer SSP2
- Today (2025)
- 523,241 people
- By 2030
- 514,948 · -1.6%
- By 2040
- 493,378 · -5.7%
- By 2050
- 469,639 · -10.2%
- By 2075
- 418,360 · -20.0%
- By 2100
- 353,315 · -32.5%
Race, ethnicity, and origin ACS 2023
- Neighborhood character
- Predominantly Black (71%)
- Race & ethnicity
- Black 71% White 20% Two or more races 8% Hispanic / Latino 3%
- Common ancestry
- Romanian 0%
- Foreign-born
- 3% · Canada
- Languages at home
- 96% English-only · Spanish 2% French/Haitian/Cajun 1%
Political lean MEDSL · Montgomery
- 2024 margin
- Toss-up / Even · D 49.8% · R 49.3%
- 2008→2024 swing
- -5.8pp toward R · 2008: 6.2pp · 2024: 0.5pp
- All cycles
- 2024: D+0.5 2020: D+2.2 2016: R+1.2 2012: D+3.1 2008: D+6.2
Not yet ingested
- Civics
- —
Market trends
- HPI YoY
- ▼ -92.43%
- Current HPI
- 193.4175
- Rent YoY
- ▲ 4.06%
- Metro
- Dayton-Kettering, OH
- State GDP YoY
- ▲ 1.98%
- F500 in state
- 48
Industry mix (Fortune 500 HQ in OH)
| Industry | F500 HQs | Revenue |
|---|---|---|
| Insurance | 3 | $145B |
|
||
| Industrial Machinery | 3 | $49B |
|
||
| Financial Services | 3 | $24B |
|
||
| Consumer Goods | 2 | $93B |
|
||
| Aerospace / Defense | 2 | $47B |
|
||
| Utilities | 2 | $33B |
|
||
Price history
+359.5% since first listed22 events — show timeline
- 2026-04-27 Relisted — Dayton MLS
- 2026-03-21 Pending — Dayton MLS
- 2026-03-19 Listed $85,000 Dayton MLS
- 2022-02-14 Sold (MLS) $67,000 Dayton MLS
- 2022-02-14 Sold (MLS) $67,000 Dayton MLS
- 2022-02-01 Pending — Dayton MLS
- 2021-11-05 Listed $69,500 Dayton MLS
- 2021-09-15 Listing Removed — Dayton MLS
- 2021-06-09 Price Changed $70,000 Dayton MLS
- 2021-04-17 Listing Removed — Dayton MLS
- 2021-04-15 Listed $67,000 Dayton MLS
- 2021-04-10 Listing Removed — CBRMLS
- 2021-01-25 Listed $64,900 CBRMLS
- 2021-01-17 Listed $64,900 Dayton MLS
- 2017-08-08 Listing Removed — Dayton MLS
- 2017-05-24 Listed $38,500 Dayton MLS
- 2013-05-15 Listing Removed — Cincy MLS
- 2013-05-15 Listing Removed — Dayton MLS
- 2013-02-27 Listed $45,000 Cincy MLS
- 2013-02-27 Listed $45,000 Dayton MLS
- 1979-02-23 Sold (Public Records) $18,500 Public Records
- 1979-02-23 Sold (Public Records) $18,500 Public Records
Property tax history
-1.1%/yrLatest (2025): $584 · -0.2% YoY. Source: county tax records.
Cash-flow waterfall
monthlySold comps — $/sqft
last 12 mo · ≤1 miLoading sold comps…